Case Reports
. 2020 Apr;580(7802):283-287.
doi: 10.1038/s41586-020-2043-0. Epub 2020 Feb 12.

Novel tau filament fold in corticobasal degeneration

Affiliations
Case Reports

Novel tau filament fold in corticobasal degeneration

Wenjuan Zhang et al. Nature. 2020 Apr.

Abstract

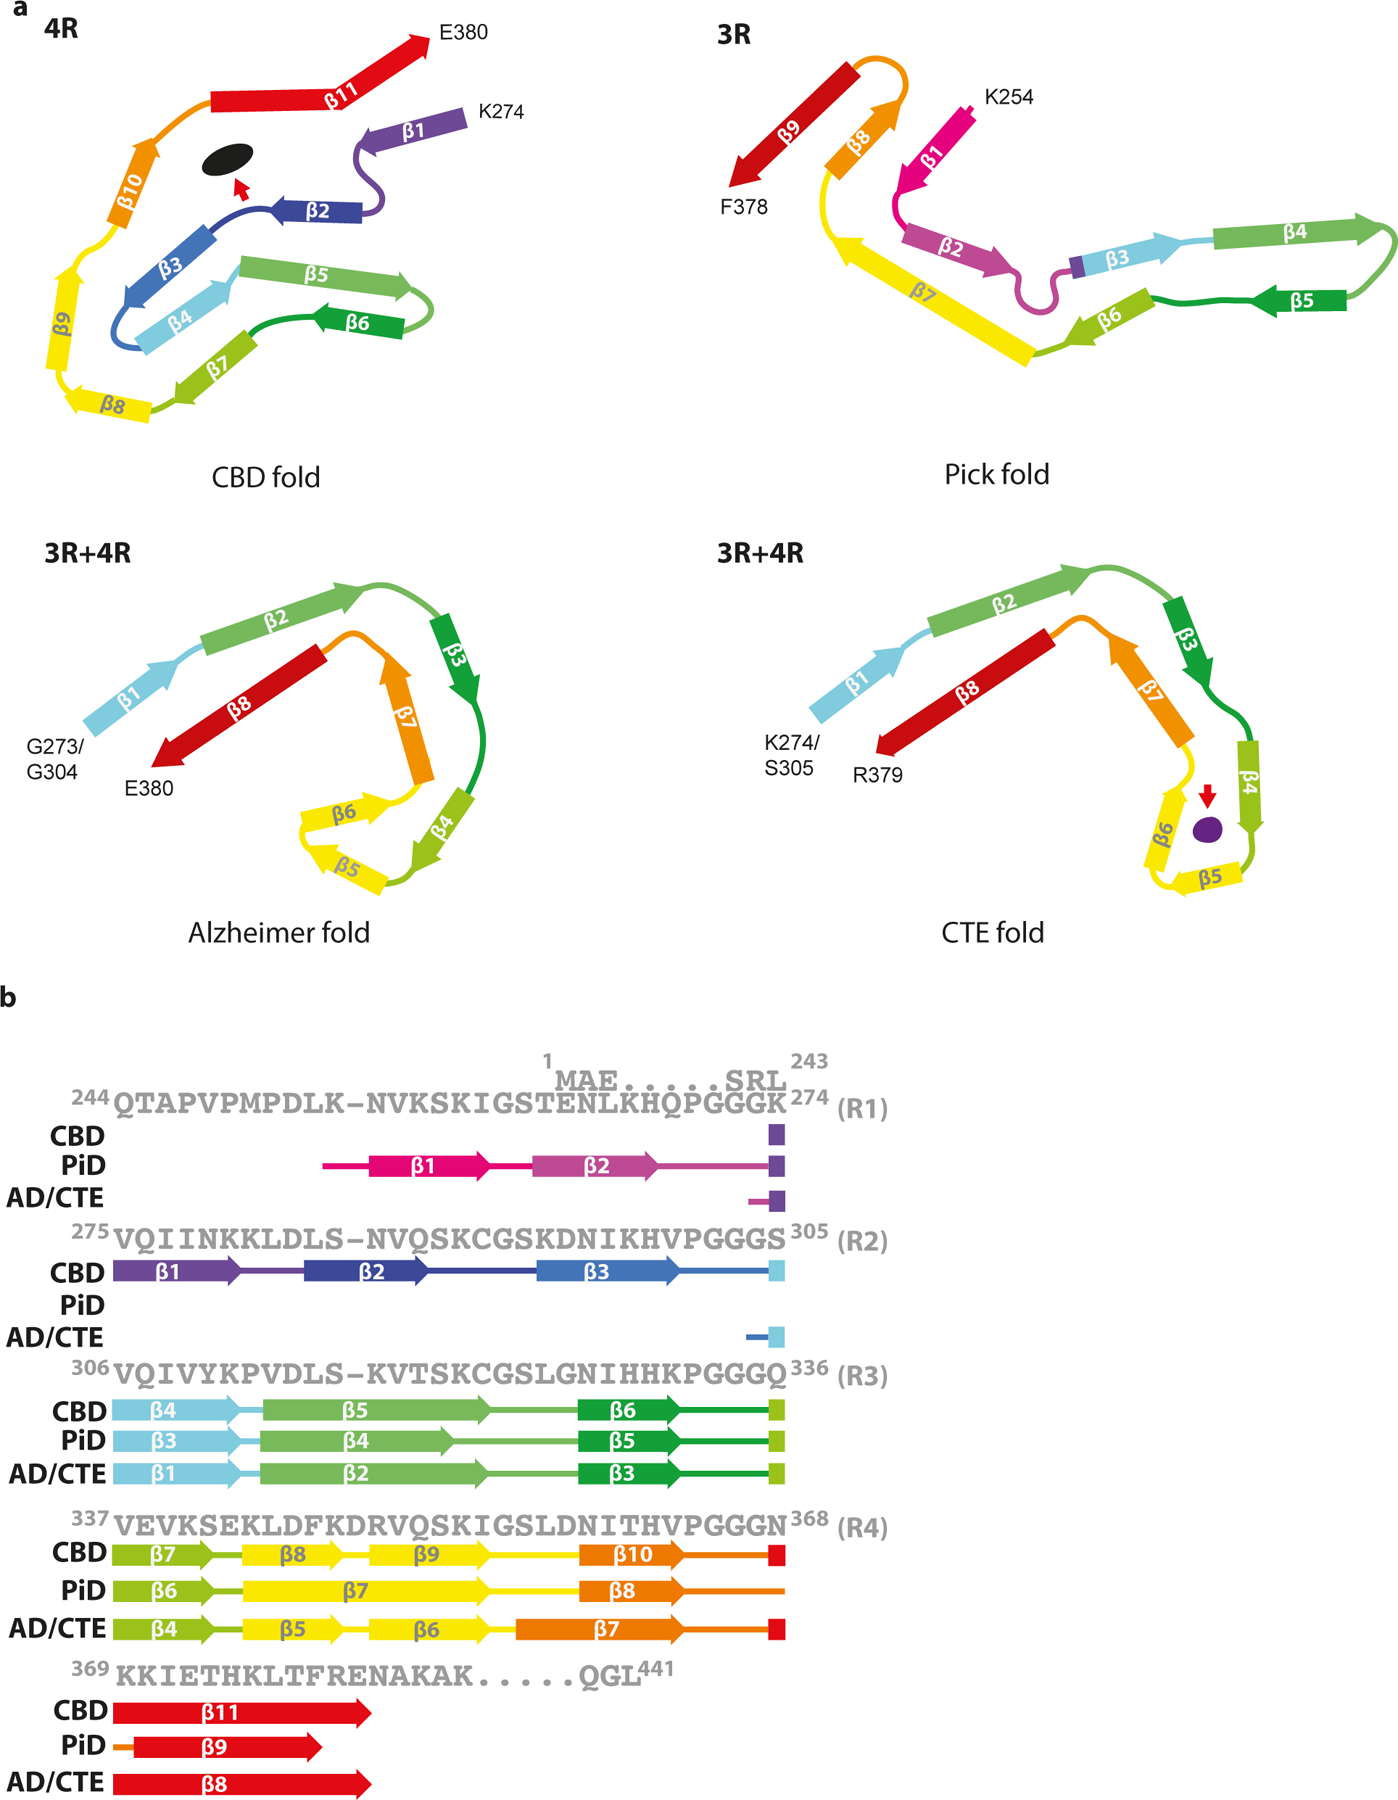
Corticobasal degeneration (CBD) is a neurodegenerative tauopathy-a class of disorders in which the tau protein forms insoluble inclusions in the brain-that is characterized by motor and cognitive disturbances1-3. The H1 haplotype of MAPT (the tau gene) is present in cases of CBD at a higher frequency than in controls4,5, and genome-wide association studies have identified additional risk factors6. By histology, astrocytic plaques are diagnostic of CBD7,8; by SDS-PAGE, so too are detergent-insoluble, 37 kDa fragments of tau9. Like progressive supranuclear palsy, globular glial tauopathy and argyrophilic grain disease10, CBD is characterized by abundant filamentous tau inclusions that are made of isoforms with four microtubule-binding repeats11-15. This distinguishes such '4R' tauopathies from Pick's disease (the filaments of which are made of three-repeat (3R) tau isoforms) and from Alzheimer's disease and chronic traumatic encephalopathy (CTE) (in which both 3R and 4R isoforms are found in the filaments)16. Here we use cryo-electron microscopy to analyse the structures of tau filaments extracted from the brains of three individuals with CBD. These filaments were identical between cases, but distinct from those seen in Alzheimer's disease, Pick's disease and CTE17-19. The core of a CBD filament comprises residues lysine 274 to glutamate 380 of tau, spanning the last residue of the R1 repeat, the whole of the R2, R3 and R4 repeats, and 12 amino acids after R4. The core adopts a previously unseen four-layered fold, which encloses a large nonproteinaceous density. This density is surrounded by the side chains of lysine residues 290 and 294 from R2 and lysine 370 from the sequence after R4.


Conflict of interest statement

Competing interests The authors declare no competing interests.

Figures

Extended Data Figure 1.
Extended Data Figure 1.. Immunolabelling of tau filaments extracted from frontal cortex of CBD cases 1–3.
Representative immunogold negative-stain electron microscopy images of Type I and Type II tau filaments extracted from frontal cortex of CBD cases 1–3. Filaments were labelled with antibodies BR133, BR136 and BR134. Antibodies Anti-4R, BR135 and TauC4 did not label filaments, which indicates that their epitopes lie within the ordered filament cores. Scale bar, 50 nm.
Extended Data Figure 2.
Extended Data Figure 2.. Immunolabelling of tau filaments extracted from additional brain regions of CBD cases 1–3.
Representative immunogold negative-stain electron microscopy images of Type I and Type II tau filaments extracted from putamen of CBD cases 1–3, as well as from globus pallidus and thalamus of CBD case 3. Similar to filaments extracted from frontal cortex (Extended Data Figure 1), tau filaments were labelled with antibodies BR133, BR136 and BR134, whereas antibodies Anti-4R, BR135 and TauC4 did not label filaments. Scale bar, 50 nm.
Extended Data Figure 3.
Extended Data Figure 3.. Assembled TDP-43 in frontal cortex of CBD cases 1–3.
a, Immunoblots using anti-phospho-TDP-43 antibody. Sarkosyl-insoluble material was prepared as described and all the samples were applied on the same gel. The 43 kDa band (*) corresponds to full-length TDP-43 and the 18–26 kDa bands (**) to C-terminal fragments. This experiment was repeated twice with similar results.
Extended Data Figure 4.
Extended Data Figure 4.. Cryo-EM images and characteristics of tau filaments from frontal cortex of CBD cases 1–3.
a, Representative cryo-EM images. Total numbers of acquired micrographs are shown in Extended Data Table 1. Scale bar, 20nm. b, Tau filament characteristics. Minimum width, maximum width, and crossover distance were measured by hand in the cryo-EM images. Box plots show the mean, standard deviation, and individual values from n=25 independent measurements for each filament type and each CBD case. Statistical analyses on these measurements were performed using a one-way ANOVA test, followed by Tukey’s multiple comparisons test; n.s., not significant.
Extended Data Figure 5.
Extended Data Figure 5.. Cryo-EM map and model comparisons.
a, b, Fourier shell correlation (FSC) curves between two independently refined half-maps (black, solid), of the final model versus the full map (red, solid), of a model refined in the first half-map versus the first half-map (green, solid), and of the same model versus the second half-map (blue, dashed) for CBD Type I (a) and Type II (b) filaments. c, d, Local resolution estimates for the CBD Type I (c) and Type II (d) filament reconstructions. e, f, Side views of the 3D reconstructions of CBD Type I (c) and Type II (d) filaments. g, h, Sharpened, high-resolution cryo-EM maps of CBD Type I (g) and Type II (h) tau filaments with their corresponding atomic models overlaid.
Extended Data Figure 6.
Extended Data Figure 6.. CBD tau filament fold.
a, Schematic of the CBD fold. b, Rendered view of the secondary structure elements in the CBD fold, depicted as three successive rungs. c, As in b, but in a view perpendicular to the helical axis, revealing the changes in height within a single molecule. d, Comparison of the protofilament structures of CBD Type I (blue) and Type II (pink).
Extended Data Figure 7.
Extended Data Figure 7.. Protofilament interface in CBD Type II tau filaments.
Packing between residues 343KLDFKDR349 of the two protofilaments. Inter-protofilament hydrogen bonds are shown in yellow. Intra-protofilament hydrogen bonds are shown in green.
Extended Data Figure 8.
Extended Data Figure 8.. Seeded tau aggregation induced by CBD filaments in SH-SY5Y cells.
a, Immunoblotting of sarkosyl-insoluble (Ppt) and sarkosyl-soluble (Sup.) fractions extracted from mock-transfected SH-SY5Y cells and from cells transfected with tau seeds from frontal cortex of CBD cases 1–3. SH-SY5Y cells transiently expressed either hemagglutinin (HA)-tagged 1N4R or HA-tagged 1N3R human tau. Insoluble tau was detected with anti-HA and anti-pS396 tau antibodies. Total tau was detected with anti-TauC. Blotting with an anti-α-tubulin antibody served as loading control. b, Quantitation of anti-HA-positive bands. The results are expressed as the means ± S.E.M. (n=3).
Figure 1.
Figure 1.. Filamentous tau pathology of CBD.
(a-f), Staining of neuronal inclusions, neuropil threads and astrocytic plaques in the frontal cortex of CBD cases 1–3 by antibody RD4 (specific for 4R tau, brown) (a-c), and in the frontal cortex of case 3 by antibody AT8 (pS202, pT205 tau, brown) (e) and Gallyas-Braak silver (black) (f). Staining of frontal cortex from CBD cases 1–3 was negative when antibody RD3 (specific for 3R tau) was used (d). Nuclei were counterstained in blue. Scale bars, 50 μm. (g), Immunoblots using antibodies RD4, RD3 and AT8 of sarkosyl-insoluble tau extracted from the frontal cortex of CBD cases 1–3. (h), Negative-stain electron micrographs of Type I (narrow) and Type II (wide) tau filaments extracted from the frontal cortex of CBD case 1. Scale bar, 50 nm.
Figure 2.
Figure 2.. Cryo-EM maps of CBD Type I and Type II tau filaments and atomic model of Type II filaments.
(a), Cryo-EM maps of Type I tau filaments (upper panels) and Type II tau filaments (lower panels) from the frontal cortex of cases 1–3. Details of cryo-EM data acquisition and the atomic model are shown in Extended Data Table 1. (b), Atomic model of the CBD Type II tau filament (upper panel). The extra density is shown in light blue, with K290, K294 and K370 indicated. Schematic depicting the microtubule-binding repeats (R1-R4) of tau and the sequence after R4 that is present in the core of CBD filaments (all shown in different colours) (lower panel). The positions of β-strands (β1-β11) are indicated.
Figure 3.
Figure 3.. Structures of tau filament cores from human brain.
(a), Protofilament from corticobasal degeneration (CBD fold), a 4R tauopathy; protofilament from Pick’s disease (Pick fold), a 3R tauopathy; protofilaments from Alzheimer’s disease (Alzheimer fold) and chronic traumatic encephalopathy (CTE fold), both 3R + 4R tauopathies. Red arrows point to the internal, non-proteinaceous densities in CBD and CTE folds. (b), Schematic depicting the microtubule binding repeats (R1-R4) of tau and the sequence after R4, with the β-strands found in the cores of tau filaments in the different diseases marked by thick arrows.

References

    1. Lhermitte J, Lévy G & Kyriaco N Les perturbations de la représentation spatiale chez les apraxiques. Rev. Neurol. (Paris) 2, 586–600 (1925).
    1. Rebeiz JJ, Kolodny EH & Richardson EP Corticodentatonigral degeneration with neuronal achromasia. Arch. Neurol 18, 20–33 (1968). - PubMed
    1. Gibb WRG, Luthert PJ & Marsden CD Corticobasal degeneration. Brain 112, 1171–1192 (1989). - PubMed
    1. Di Maria E et al. Corticobasal degeneration shares a common genetic background with progressive supranuclear palsy. Ann. Neurol 47, 374–377 (2000). - PubMed
    1. Houlden H et al. Corticobasal degeneration and progressive supranuclear palsy share a common tau haplotype. Neurology 56, 1702–1706 (2001). - PubMed

Publication types

MeSH terms