

The Maximum Eigenvalue of the Brain Functional Network Adjacency Matrix: Meaning and Application in Mental Fatigue Evaluation
- PMID: 32050462
- PMCID: PMC7071607
- DOI: 10.3390/brainsci10020092
The Maximum Eigenvalue of the Brain Functional Network Adjacency Matrix: Meaning and Application in Mental Fatigue Evaluation
Abstract
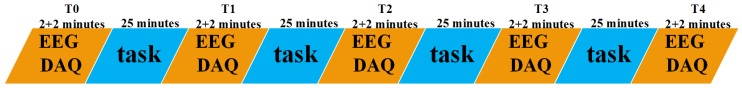
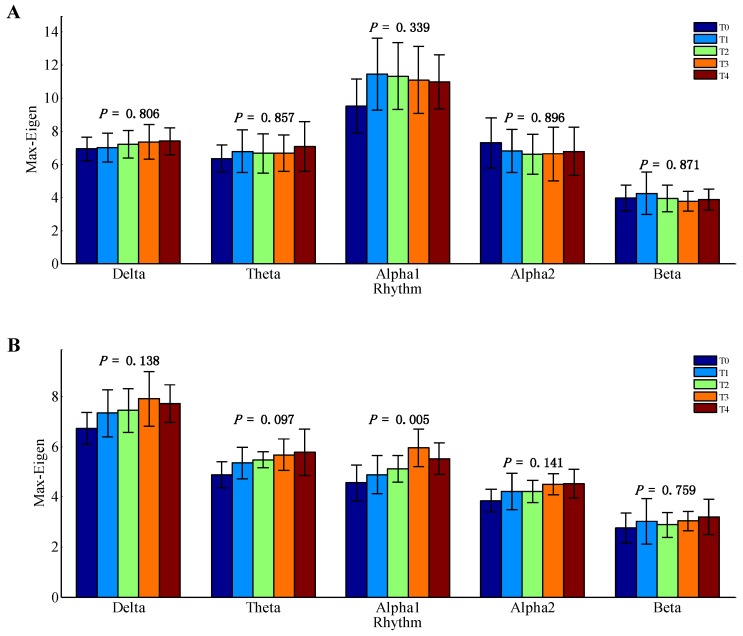
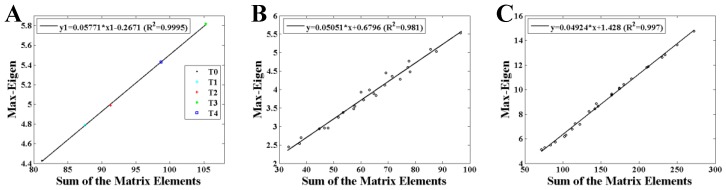
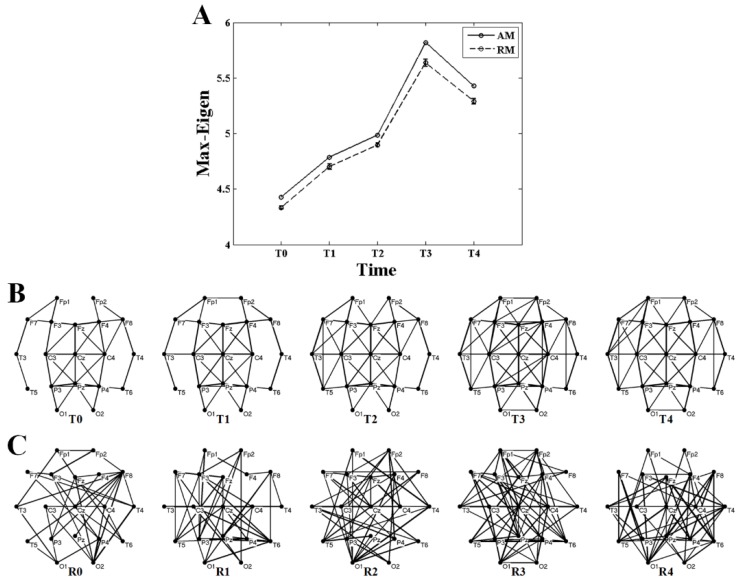
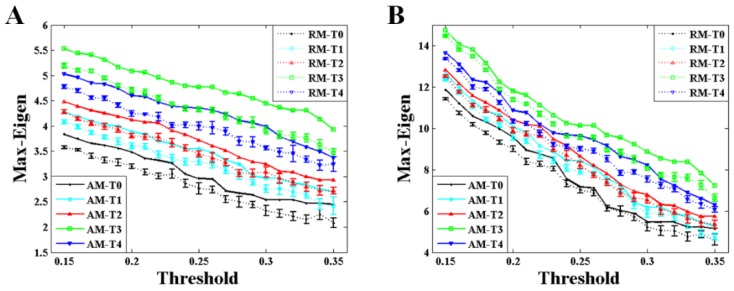
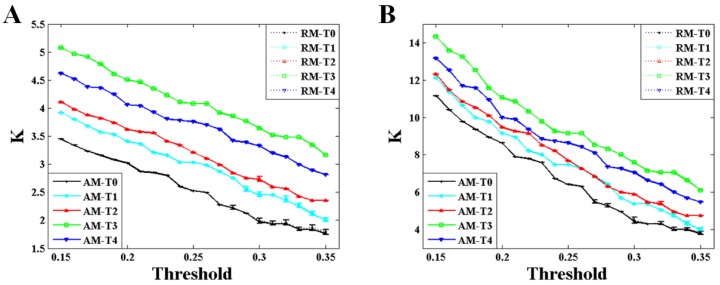
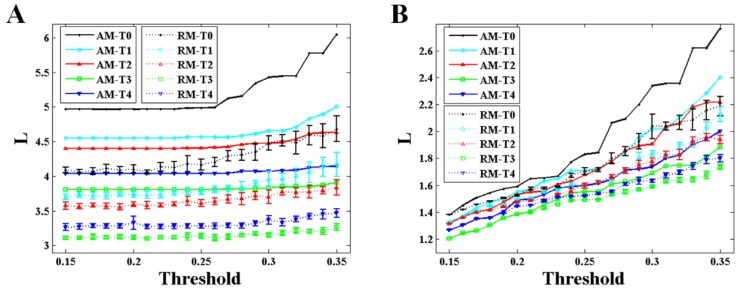
The maximum eigenvalue of the adjacency matrix (AM) has been supposed to contain rich information about the corresponding network. An experimental study focused on revealing the meaning and application of the maximum eigenvalue is missing. To this end, AM was constructed using mutual information (MI) to determine the functional connectivity with electroencephalogram (EEG) data recorded with a mental fatigue model, and then was converted into both binary and weighted brain functional network (BFN) and corresponding random networks (RNs). Both maximum eigenvalue and corresponding network characters in BFNs and RNs were considered to explore the changes during the formation of mental fatigue. The results indicated that large maximum eigenvalue means more edges in the corresponding network, along with a high degree and a short characteristic path length both in weighted and binary BFNs. Interestingly, the maximum eigenvalue of AM was always a little larger than that of the corresponding random matrix (RM), and had an obvious linearity with the sum of the AM elements, indicating that the maximum eigenvalue can be able to distinguish the network structures which have the same mean degree. What is more, the maximum eigenvalue, which increased with the deepening of mental fatigue, can become a good indicator for mental fatigue estimation.
Keywords: adjacency matrix; brain functional network; electroencephalogram (EEG); maximum eigenvalue; mental fatigue; network characters.
Conflict of interest statement
The authors declare no conflict of interest. The funders had no role in the design of the study; in the collection, analyses, or interpretation of data; in the writing of the manuscript, or in the decision to publish the results.
Figures
Similar articles
-
Mental Fatigue Has Great Impact on the Fractal Dimension of Brain Functional Network.Neural Plast. 2020 Nov 12;2020:8825547. doi: 10.1155/2020/8825547. eCollection 2020. Neural Plast. 2020. PMID: 33273905 Free PMC article.
-
Effects of Mental Fatigue on Small-World Brain Functional Network Organization.Neural Plast. 2019 Dec 6;2019:1716074. doi: 10.1155/2019/1716074. eCollection 2019. Neural Plast. 2019. PMID: 31885535 Free PMC article.
-
Approximating the largest eigenvalue of the modified adjacency matrix of networks with heterogeneous node biases.Phys Rev E Stat Nonlin Soft Matter Phys. 2009 May;79(5 Pt 2):056111. doi: 10.1103/PhysRevE.79.056111. Epub 2009 May 22. Phys Rev E Stat Nonlin Soft Matter Phys. 2009. PMID: 19518525
-
Eigenvalue spectra and stability of directed complex networks.Phys Rev E. 2022 Dec;106(6-1):064302. doi: 10.1103/PhysRevE.106.064302. Phys Rev E. 2022. PMID: 36671075
-
[Research on classification of brain functional network features during mental fatigue].Sheng Wu Yi Xue Gong Cheng Xue Za Zhi. 2018 Apr 25;35(2):171-175. doi: 10.7507/1001-5515.201609032. Sheng Wu Yi Xue Gong Cheng Xue Za Zhi. 2018. PMID: 29745520 Free PMC article. Chinese.
Cited by
-
Machine Learning Techniques Reveal Aberrated Multidimensional EEG Characteristics in Patients with Depression.Brain Sci. 2023 Feb 22;13(3):384. doi: 10.3390/brainsci13030384. Brain Sci. 2023. PMID: 36979194 Free PMC article.
-
Mental Fatigue Has Great Impact on the Fractal Dimension of Brain Functional Network.Neural Plast. 2020 Nov 12;2020:8825547. doi: 10.1155/2020/8825547. eCollection 2020. Neural Plast. 2020. PMID: 33273905 Free PMC article.
-
Effects of traditional Chinese exercises on brain-derived neurotrophic factor in middle-aged and older adults: A systematic review and meta-analysis of randomized controlled trials.J Exerc Sci Fit. 2025 Jan;23(1):32-41. doi: 10.1016/j.jesf.2024.12.004. Epub 2024 Dec 17. J Exerc Sci Fit. 2025. PMID: 39811698 Free PMC article. Review.
-
The impact of mental fatigue on brain activity: a comparative study both in resting state and task state using EEG.BMC Neurosci. 2020 May 12;21(1):20. doi: 10.1186/s12868-020-00569-1. BMC Neurosci. 2020. PMID: 32398004 Free PMC article.
-
High-order brain functional network for electroencephalography-based diagnosis of major depressive disorder.Front Neurosci. 2022 Aug 9;16:976229. doi: 10.3389/fnins.2022.976229. eCollection 2022. Front Neurosci. 2022. PMID: 36017184 Free PMC article.
References
-
- Li G., Li B., Jiang Y.H., Jiao W.D., Lan H., Zhu C.G. A new method for automatically modelling brain functional networks. Biomed. Signal Process. Control. 2018;45:70–79. doi: 10.1016/j.bspc.2018.05.024. - DOI
-
- Horstmann M.T., Bialonski S., Noennig N., Mai H., Prusseit J., Wellmer J., Hinrichs H., Lehnertz K. State dependent properties of epileptic brain networks: Comparative graph-theoretical analyses of simultaneously recorded EEG and MEG. Clin. Neurophysiol. 2010;121:172–185. doi: 10.1016/j.clinph.2009.10.013. - DOI - PubMed
Grants and funding
- 51575497/National Natural Science Foundation of China
- QJD1803024/Qianjiang Talent Plan from Human Resources and Social Security Department of Zhejiang Province
- LQ19E050011, LY18E050010/Zhejiang Provincial Natural Science Foundation of China
- LGF19G010005/Zhejiang Provincial Public Welfare Technology Application Research Foundation of China
LinkOut - more resources
Full Text Sources
