Clinical Trial
. 2020 Feb 12;13(1):25.
doi: 10.1186/s12920-020-0690-5.

Amniotic fluid cell-free transcriptome: a glimpse into fetal development and placental cellular dynamics during normal pregnancy

Affiliations
Clinical Trial

Amniotic fluid cell-free transcriptome: a glimpse into fetal development and placental cellular dynamics during normal pregnancy

Adi L Tarca et al. BMC Med Genomics. .

Abstract

Background: The amniotic fluid (AF) cell-free transcriptome is modulated by physiologic and pathologic processes during pregnancy. AF gene expression changes with advancing gestation reflect fetal development and organ maturation; yet, defining normal expression and splicing patterns for biomarker discovery in obstetrics requires larger heterogeneous cohorts, evaluation of potential confounding factors, and novel analytical approaches.

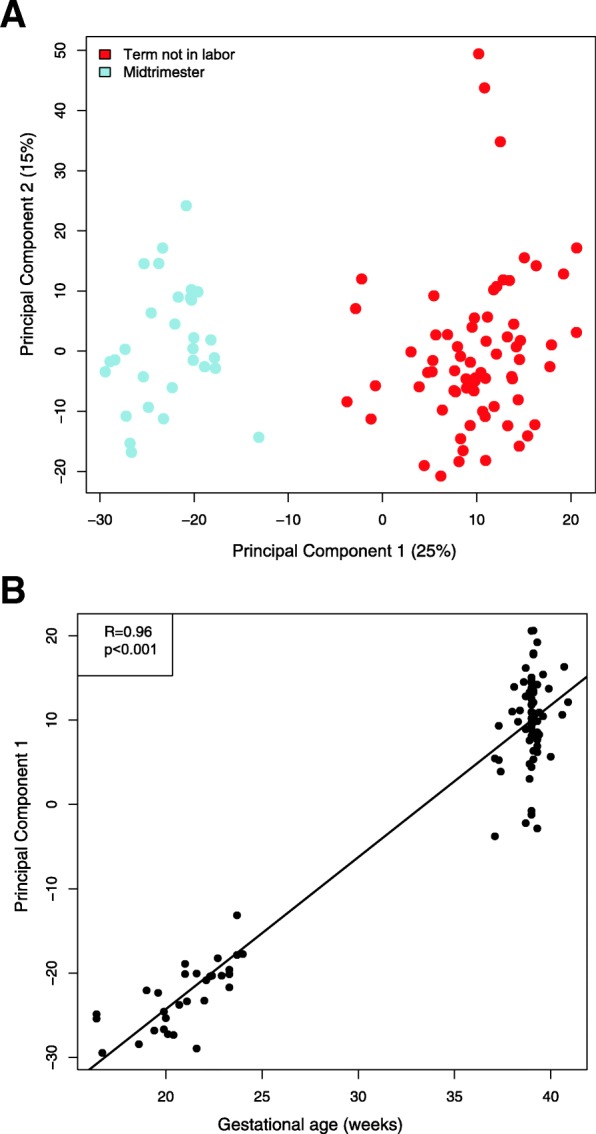
Methods: Women with a normal pregnancy who had an AF sample collected during midtrimester (n = 30) or at term gestation (n = 68) were included. Expression profiling at exon level resolution was performed using Human Transcriptome Arrays. Differential expression was based on moderated t-test adjusted p < 0.05 and fold change > 1.25; for differential splicing, a splicing index > 2 and adjusted p < 0.05 were required. Functional profiling was used to interpret differentially expressed or spliced genes. The expression of tissue-specific and cell-type specific signatures defined by single-cell genomics was quantified and correlated with covariates. In-silico validation studies were performed using publicly available datasets.

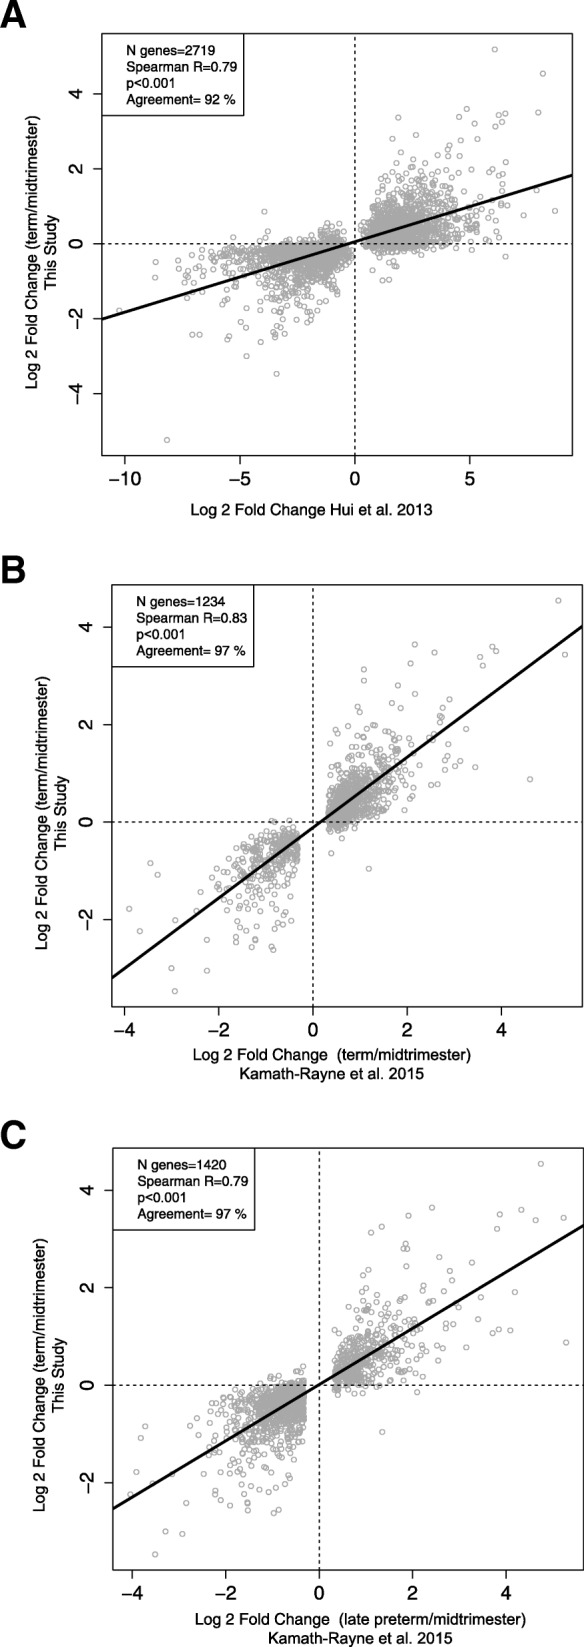
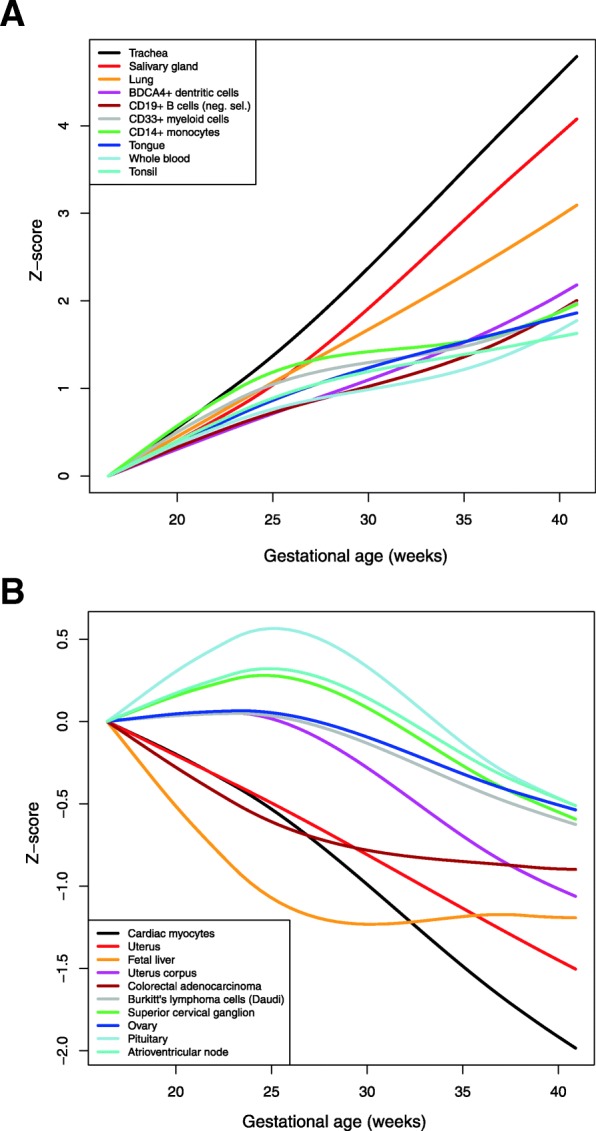
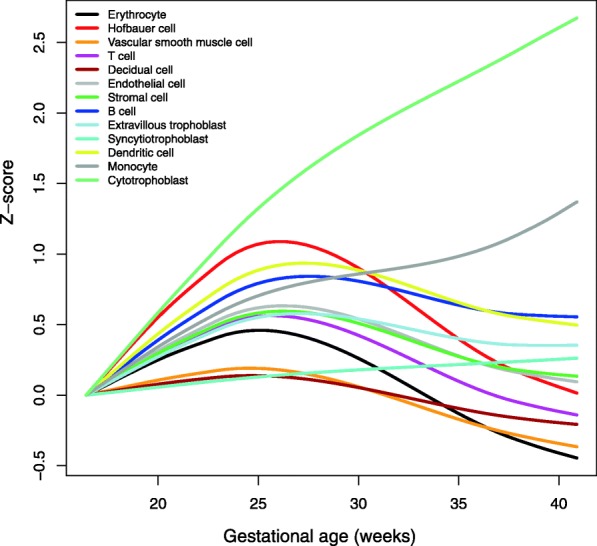
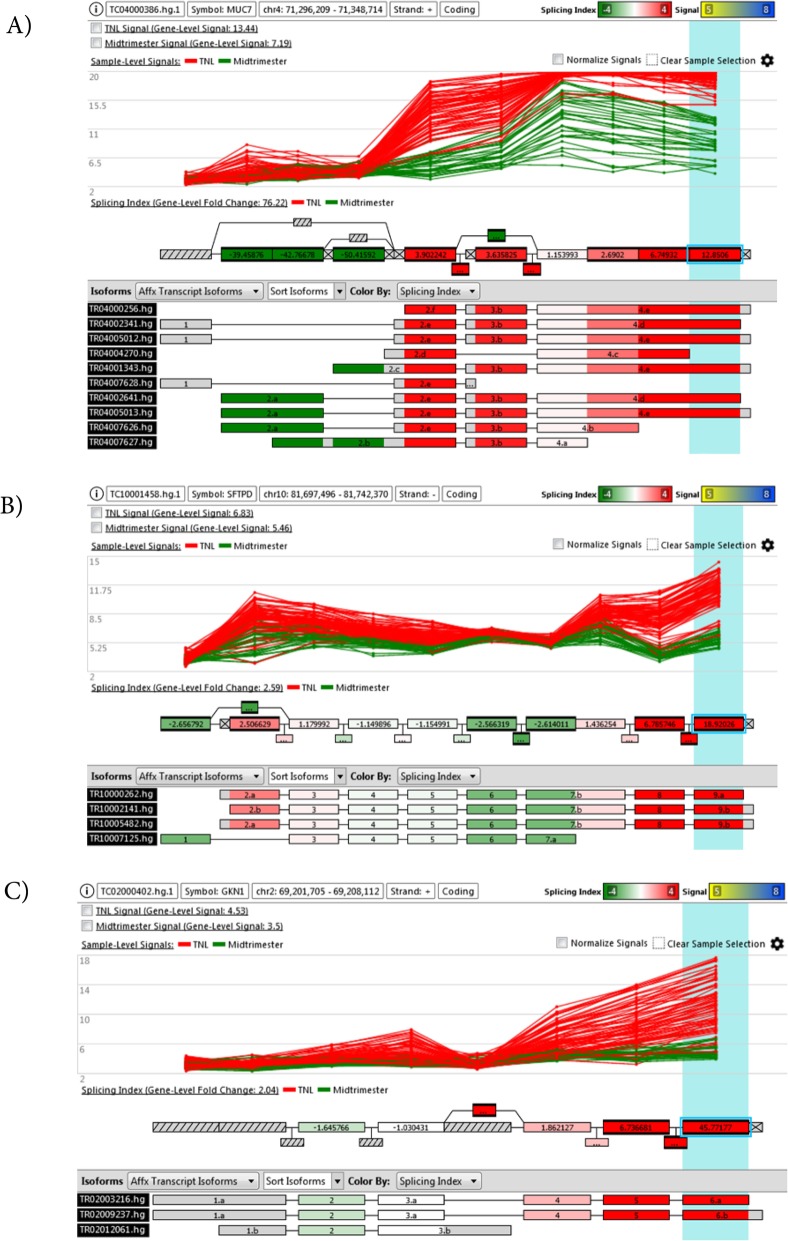
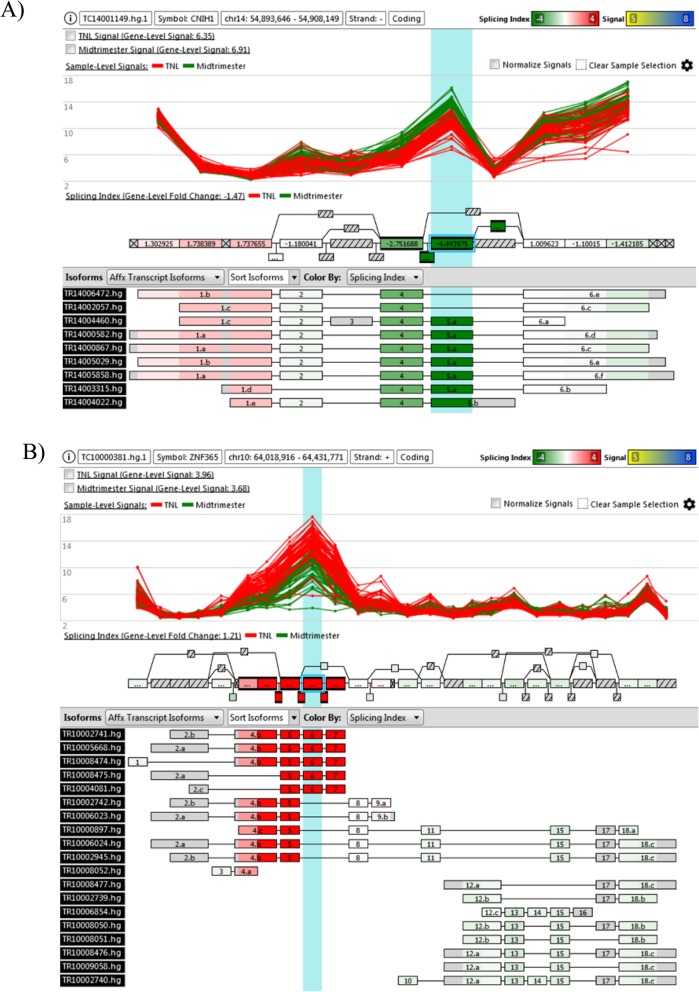
Results: 1) 64,071 genes were detected in AF, with 11% of the coding and 6% of the non-coding genes being differentially expressed between midtrimester and term gestation. Expression changes were highly correlated with those previously reported (R > 0.79, p < 0.001) and featured increased expression of genes specific to the trachea, salivary glands, and lung and decreased expression of genes specific to the cardiac myocytes, uterus, and fetal liver, among others. 2) Single-cell RNA-seq signatures of the cytotrophoblast, Hofbauer cells, erythrocytes, monocytes, T and B cells, among others, showed complex patterns of modulation with gestation (adjusted p < 0.05). 3) In 17% of the genes detected, we found differential splicing with advancing gestation in genes related to brain development processes and immunity pathways, including some that were missed based on differential expression analysis alone.

Conclusions: This represents the largest AF transcriptomics study in normal pregnancy, reporting for the first time that single-cell genomic signatures can be tracked in the AF and display complex patterns of expression during gestation. We also demonstrate a role for alternative splicing in tissue-identity acquisition, organ development, and immune processes. The results herein may have implications for the development of fetal testing to assess placental function and fetal organ maturity.

Keywords: Cell-free RNA; Differential expression; Differential splicing; Fetal sex; Gestational age; Maternal obesity; Single-cell genomic signature; Tissue-specific signature.


Conflict of interest statement

The authors report no conflicts of interest. Dr. Romero has contributed to this work as part of his official duties as an employee of the United States Federal Government.

Figures

Fig. 1
Fig. 1
Principal component analysis of amniotic fluid cell-free RNA expression in normal pregnancy. The principal components (PC) were derived from expression of the top 1000 most varying genes (unsupervised selection). The first panel (a) depicts each sample based on the first two principal components (PC1 and PC2). The values in parentheses are the % of variance explained by each principal component. TNL: term not in labor. The linear correlation between gestational age and PC1 is also shown in panel (b)
Fig. 2
Fig. 2
In-silico validation of differential expression between midtrimester and term gestation groups. Each dot represents a unique annotated gene. The y axis represents the log2 fold change (term/midtrimester) obtained in the current study. The x-axis represents: a) log2 fold change reported by Hui et al. [120] (term vs midtrimester); b) log2 fold change based on a re-analysis of RNA-Seq data reported by Kamath-Rayne et al. [85] between late preterm and midtrimester gestation; and c) between term and midtrimester gestation. R: Spearman’s correlation coefficient
Fig. 3
Fig. 3
Changes in the expression of tissue-specific signatures with gestational age. For each tissue, the expression of the top 20 most-specific genes (based on the Gene Atlas dataset) was transformed into a Z-score and averaged in each AF sample. A Robust Locally Weighted Regression and Smoothing Scatterplots (LOESS) model fit through the Z-scores as a function of gestational age is shown using lines (see Fig. S2 for individual values). Tissue signature trends are set to have the same value at 16 weeks of gestation. Differentially expressed tissue signatures were sorted by the magnitude of change from 16 to 41 weeks of gestation and the top 10 tissues with increased (a) and deceased (b) expression are shown. AF, amniotic fluid
Fig. 4
Fig. 4
Changes in the expression of RNA Seq single-cell signatures with gestational age. For each single-cell signature, the expression of member genes (based on Tsang et al. [105]) was transformed into Z-scores and averaged in each AF sample. A Robust Locally Weighted Regression and Smoothing Scatterplots (LOESS) model fit through the Z-scores as a function of gestational age is shown using lines (see Fig. S3 for individual values). Single-cell signature trends are set to have the same value at 16 weeks of gestation. AF, amniotic fluid
Fig. 5
Fig. 5
Example of differential expression and splicing associated with gestational age differences between midtrimester and term gestation groups. Each panel refers to a different gene (a: MUC7; b: SFTPD; c: GKN1). The top panel shows the normalized gene expression levels in each sample (line) and each probeset (dot) of a given patient. The middle panel shows a representation of the gene model with the color scale giving the splicing index for each probeset. The bottom layer shows possible transcript isoforms
Fig. 6
Fig. 6
Example of differential splicing but not expression associated with gestational age differences between midtrimester and term groups. Each panel refers to a different gene (a: CNIH1; b: ZNF365). Details as shown in Fig. 3

References

    1. Davis LE, McLaren LC, Stewart JA, James CG, Levine MD, Skipper BJ. Immunological and microbiological studies of midtrimester amniotic fluid. Gynecol Obstet Investig. 1983;16(5):261–268. doi: 10.1159/000299275. - DOI - PubMed
    1. Schmidt W. The amniotic fluid compartment: the fetal habitat. Adv Anat Embryol Cell Biol. 1992;127:1–100. doi: 10.1007/978-3-642-77300-6_1. - DOI - PubMed
    1. Underwood MA, Gilbert WM, Sherman MP. Amniotic fluid: not just fetal urine anymore. J Perinatol: official journal of the California Perinatal Association. 2005;25(5):341–348. doi: 10.1038/sj.jp.7211290. - DOI - PubMed
    1. Cherry SH. Amniotic fluid analysis as an index of fetal health in utero. Med Times. 1967;95(7):713–717. - PubMed
    1. Barham KA. Amnioscopy, meconium and fetal well-being. J Obstet Gynaecol Br Commonw. 1969;76(5):412–418. doi: 10.1111/j.1471-0528.1969.tb05856.x. - DOI - PubMed

Publication types