. 2020 Feb 12;18(1):24.
doi: 10.1186/s12964-019-0485-5.

Doublecortin undergo nucleocytoplasmic transport via the RanGTPase signaling to promote glioma progression

Affiliations

Doublecortin undergo nucleocytoplasmic transport via the RanGTPase signaling to promote glioma progression

Abiola Abdulrahman Ayanlaja et al. Cell Commun Signal. .

Abstract

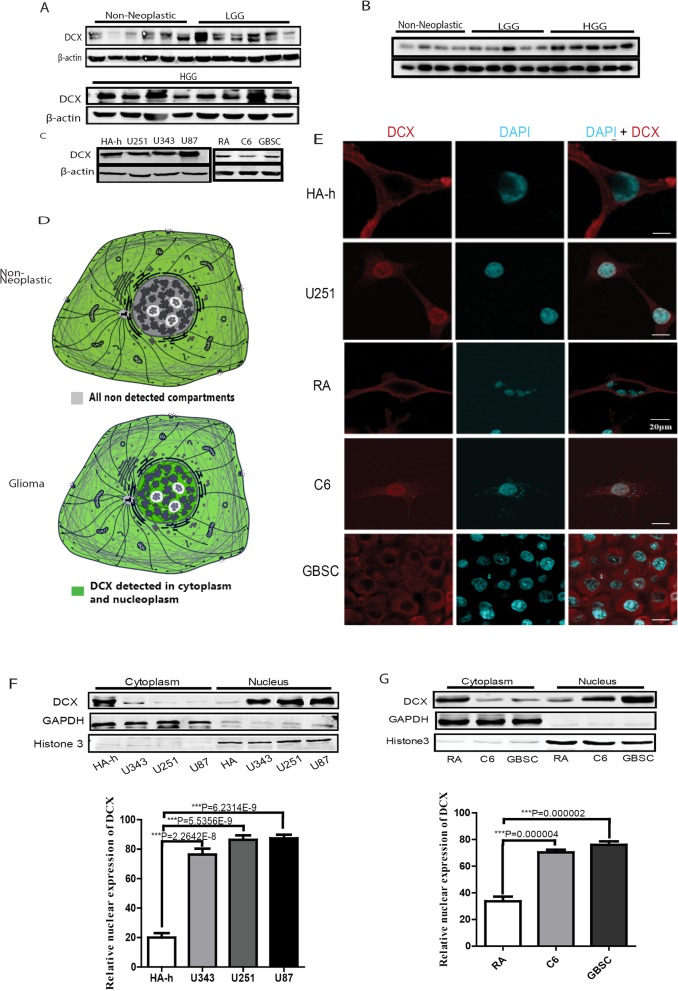
Background: Nuclear translocation of several oncogenic proteins have previously been reported, but neither the translocation of doublecortin (DCX) nor the mechanism involved has been studied. DCX is a neuronal microtubule-associated protein (MAP) that is crucial for adult neurogenesis and neuronal migration and has been associated with poor prognosis in gliomas.

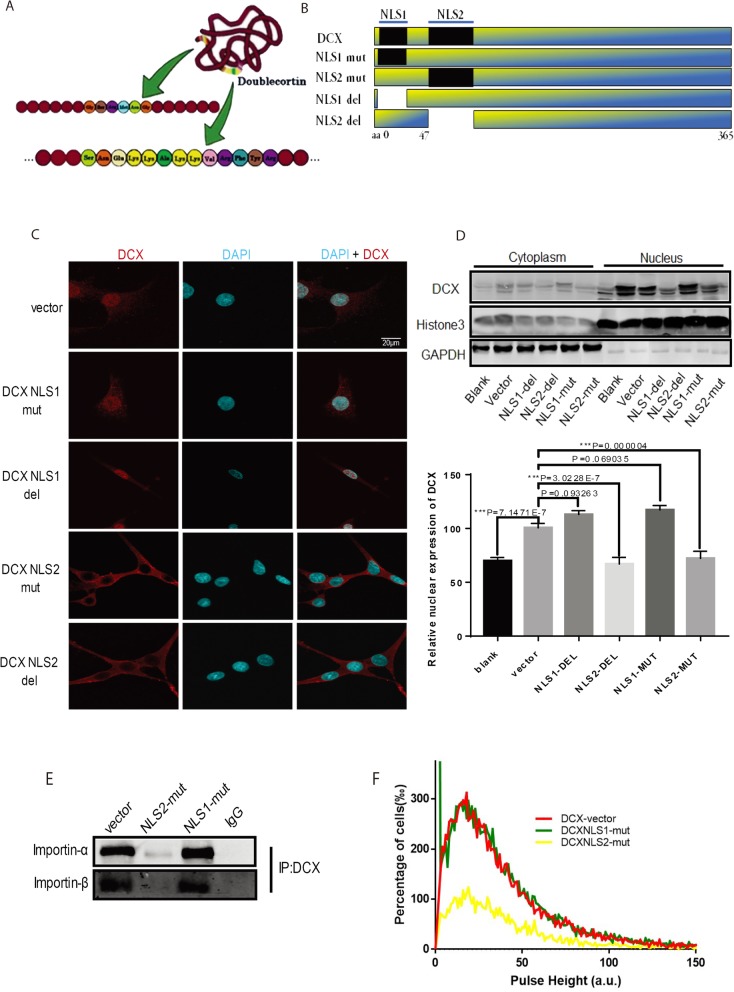
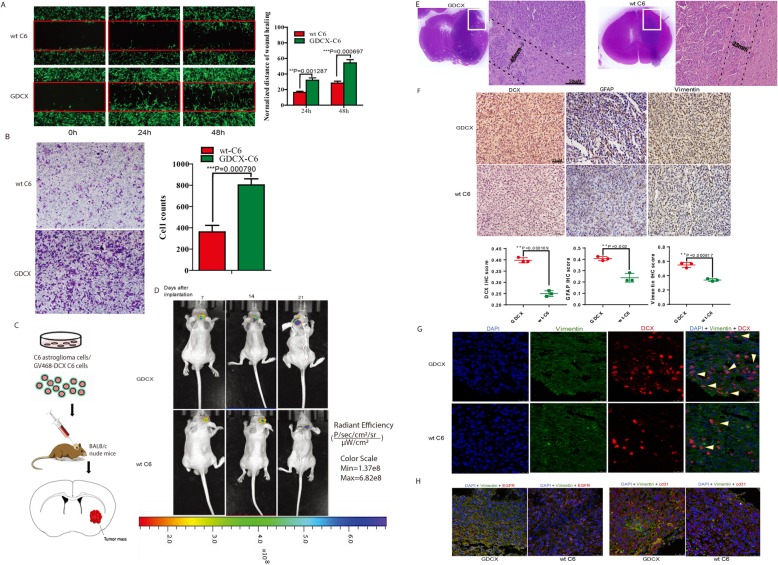
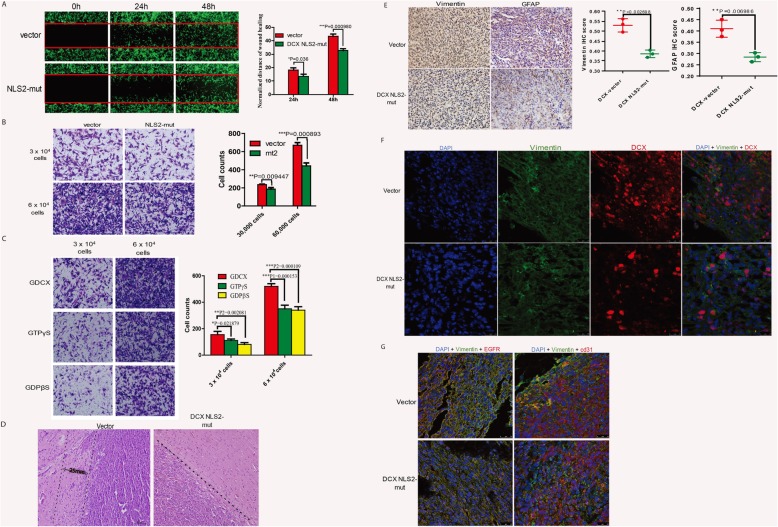
Methods: We probed DCX expression in different grades of glioma tissues and conventional cells via western blotting. Then we analyzed the expression pattern in the Oncomine cancer profiling database. Confocal Immunofluorescence was used to detect DCX expression in the cellular compartments, while subcellular fractionation was probed via western blotting. Pulse shape height analysis was utilized to verify DCX localization in a larger population of cells. Co-immunoprecipitation was used in detecting DCX-import receptors interactions. To probe for DCX functions, stable cells expressing high DCX expression or knockdown were generated using CRISPR-Cas9 viral transfection, while plasmid site-directed mutant constructs were used to validate putative nuclear localization sequence (NLS) predicted via conventional algorithms and comparison with classical NLSs. in-silico modeling was performed to validate DCX interactions with import receptors via the selected putative NLS. Effects of DCX high expression, knockdown, mutation, and/or deletion of putative NLS sites were probed via Boyden's invasion assay and wound healing migration assays, and viability was detected by CCK8 assays in-vitro, while xenograft tumor model was performed in nude mice.

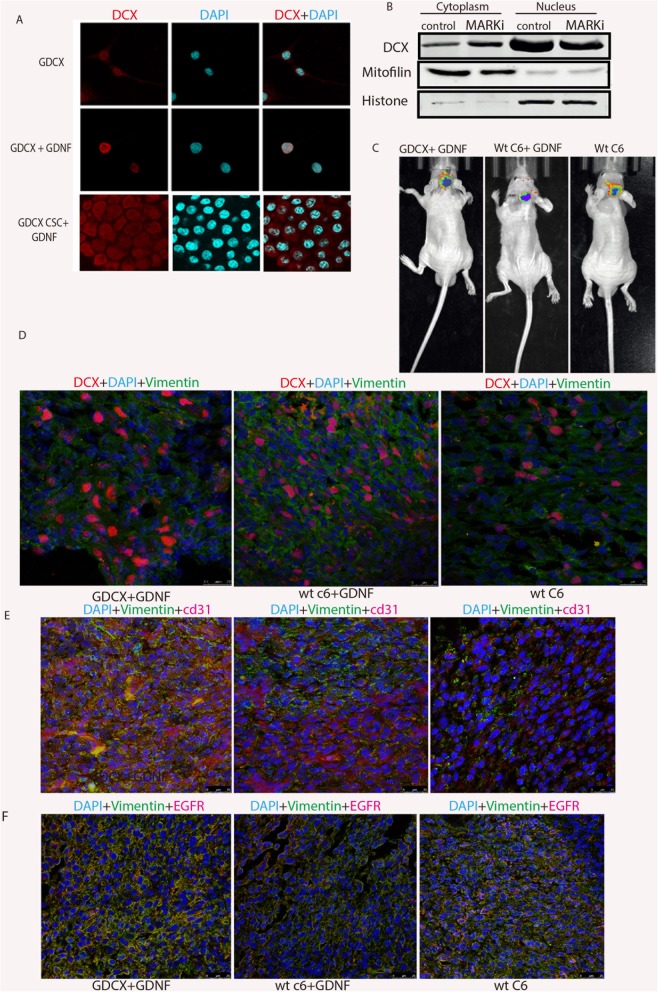
Results: DCX undergoes nucleocytoplasmic movement via the RanGTPase signaling pathway with an NLS located on the N-terminus between serine47-tyrosine70. This translocation could be stimulated by MARK's phosphorylation of the serine 47 residue flanking the NLS due to aberrant expression of glial cell line-derived neurotrophic factor (GDNF). High expression and nuclear accumulation of DCX improve invasive glioma abilities in-vitro and in-vivo. Moreover, knocking down or blocking DCX nuclear import attenuates invasiveness and proliferation of glioma cells.

Conclusion: Collectively, this study highlights a remarkable phenomenon in glioma, hence revealing potential glioma dependencies on DCX expression, which is amenable to targeted therapy. Video abstract.

Keywords: Classical nuclear localization signals (cNLS); Doublecortin (DCX); Glioblastoma Multiforme (GBM); Nucleocytoplasmic transport; RanGTPase pathway.


Conflict of interest statement

The authors declare that they have no competing interests.

Figures

Fig. 1
Fig. 1
DCX is Expressed in both cytoplasmic and nuclear compartments of gliomas. a DCX protein levels as detected by western blotting in non-neoplastic tissues, LGG (low-grade gliomas patients), and HGG (WHO III&IV high-grade glioma). b Immunoblotting of another cohort excised at a different time and in a different set of patients derived tissues showing DCX protein expression. c DCX protein levels in human astrocyte-hippocampal (HA-h), U251MG, U343, U87MG, rat’s astrocytes (RA), C6 rat’s astroglioma cell line, and stem-like cells derived from C6 cells (GBSC), as detected by western blotting d Schematic drawing of DCX subcellular localization: general knowledge of DCX localization in normal cells (upper panel) and representative image of the current discovery of DCX subcellular localization in gliomas (lower panel) (image credit: Human Protein Atlas https://www.proteinatlas.org/ENSG00000077279-DCX/cell, https://www.proteinatlas.org/ENSG00000082898-XPO1/cell#gene_information). DCX-positive sites are marked green. e Subcellular localization of DCX (Red) in HA-h, U251, RA, C6, and GBSC as detected by immunofluorescence with representative laser confocal microscopy images. Scale bar, 20 μM. f Nucleocytosolic protein level of DCX as detected by western blotting and its subcellular localization quantitation. F = 300.715 and df = 3. g Western blotting and quantitation of DCX subcellular localization in RA, C6, and GBSC. F = 200.831 and df = 2
Fig. 2
Fig. 2
DCX nuclear import occurs via the RanGTPase dependent pathway. a Formation of protein-protein interaction of DCX with endogenous importin-α and importin-β by co-immunoprecipitation, Rabbit IgG was loaded in the second lane as the control immunoprecipitation. b Subcellular localization of DCX from GDCX-C6 cells treated with GTP analogs. F = 60.328 and df = 2. c Immunostaining of GDCX-C6 cells treated with GTPγS and GDPβS. Scale bar, 20 μM. d Schematics showing the principles of pulse shape analysis (PulSA), non-aggregated fluorescent protein generates a higher pulse height than inclusion body. e Cytograms showing pulse height of GTPγS-treated and untreated GDCX cells, upper panels. Histographs of analyzed data generated from flow cytometry experiments (in arbitrary units, a.u.), lower panels. Data are presented as Mean ± SEM. GDCX 0 min vs. GDPβS 30 min treatment (P = 0.0032, t = 2.964 df = 465.8), GDCX 0 min vs GDPβS 1 h treatment (P = 0.0031, t = 2.97 df = 541), GDCX 0 min vs GTPγS 30 mins treatment (P = 0.0001, t = 4.695 df = 882.6), GDCX 0 min vs GTPγS 1 h treatment (P = 0.0001, t = 4.595 df = 897). f Co-immunoprecipitation of DCX with importin-α and importin-β in whole-cell lysates of GTPγS, GDPβS, and untreated GDCX-C6 cells
Fig. 3
Fig. 3
DCX nuclear import requires a classical nuclear localization signal. a Schematics of putative DCX NLS position and sequence as well as their structural position in the cartoon representation of DCX N-terminal region (suspension point indicates the extended part of DCX NLS2). b Illustration of DCX truncates containing putative DCX NLS mutants fused with GFP. Black bars indicate the location of NLS; blank spaces indicate deleted corresponding putative NLSs. c Subcellular localization of DCX in stable U251MG cells expressing DCX NLS mutant compared with DCX+ vector as detected by immunofluorescence. Scale bar 20 μm. d DCX subcellular localization levels in mutant cells as detected by western blotting. F = 67.156 and df = 5. e Co-immunoprecipitation of DCX with importin-α and importin-β in DCX mutants and vector control cells. f Pulse shape analysis of U251MG cells expressing DCX mutants compared with the vector showing lower pulse height in DCXNLS2 mutant cells
Fig. 4
Fig. 4
Induced High DCX Expression effectively improves GBM tumor growth and invasiveness. a Wound healing migration assay for detection of GFP-fused C6 (wt-C6) cell migration compared with GDCX-C6 cells, distance covered was quantified and represented by histogram data t = − 9.459 and df = 4. b Invasion assay conducted with GDCX-C6 and wt C6 cells and the quantification of invasive cells at the lower chamber. t = − 9.154 and df = 4. c Schematic of GDCX and wt C6 cells implantation into the brain of nude BALB/c mice. d Representative bioluminescence images from GDCX mouse and C6-GFP mouse. e Representative Hematoxylin-Eosin staining derived from of 8 μm tissue slices of GDCX and wt-C6 mice brain from a 200 μm region beyond the macroscopic boundary and the enlarged section of tumor edge showing infiltrating tumors at the invasive frontiers. The dashed boundary depicts the distance covered by invasive cells. Scale bar, 50 μm. f Immunohistochemical staining comparing DCX (df = 4, t = 15.211), GFAP (df = 4, t = 6.886), and vimentin (df = 4, t = 9.075) immunoreactivity in GDCX and wt-C6 tumors. Immunoreactivity was quantified using Image-Pro Plus, one to two sections per subject. Scale bars = 25 μm. g Immunostaining of brain sections showing DCX nuclear accumulation intensity with representative images of nuclei stained DAPI. Arrows indicate nuclear DCX-positive cells at the edge of tumors. Scale bars = 25 μm. h Representative immunofluorescence images of invasive glioma markers (CD31 and EGFR) in GDCX and wt-C6 tumors. Scale bar, 25 μm
Fig. 5
Fig. 5
DCX Nuclear Import contributes to GBM development. a Wound healing migration assay comparing DCX+ U251MG cells with DCX NLS2-mutant cells. t1=3.118, df1=4, t2=8.655, and df2=4. b Boyden’s transwell invasion assay involving DCX+ vector cells and DCX NLS2-mut cells, quantitated by Image-Pro-Plus. t1=4.680, df1=4, t2=8.868 df2=4. c Similar experiments were performed with GDCX-C6 cells treated with GTP analogs. F1=13.508, df1=2, F2=50.392, df2=2. d Hematoxylin-Eosin staining of enlarged mice brain section showing infiltrating tumors at the invasive frontiers. The dashed boundary depicts the distance covered by invasive cells. Scale bars, 50μm. e Representative immunohistochemical staining to compare GFAP (df=4, t=5.099), or vimentin (df=4, t=6.622) immunoreactivity in vector and DCX NLS2-mut tumors. Scale bars, 25μm. f Immunostaining of brain sections showing DCX nuclear accumulation intensity. Scale bars=25μm. g Immunofluorescence image of invasive glioma markers (CD31 and EGFR) in DCX-vector and DCX NLS2-mut tumors. Scale bar, 25μm
Fig. 6
Fig. 6
DCX Nuclear import is promoted by GDNF. a Immunostaining of GDNF-treated GDCX and GDCXU251 stem cells compared with untreated GDCX cells. Scale bar, 20 μM. b Western blotting assay showing DCX nucleocytoplasmic expression in both MARK1-treated and untreated GDCX U251 cells. c Representative bioluminescence images comparing GDNF-treated GDCXC6 cells, GDNF-treated-wt C6, and untreated wt C6 cells at week 3 post-implantation. d Immunostaining of brain sections showing DCX nuclear accumulation intensity. Scale bars = 25 μm. Immunofluorescence image of invasive glioma markers, CD31 (E), and EGFR (F), Scale bars = 25 μm

References

    1. Inoue H, Kauffman M, Shacham S, Landesman Y, Yang J, Evans CP, et al. CRM1 blockade by selective inhibitors of nuclear export attenuates kidney cancer growth. J Urol. 2013;189(6):2317–2326. doi: 10.1016/j.juro.2012.10.018. - DOI - PMC - PubMed
    1. Xiong Y, Liu L, Zhu S, Zhang B, Qin Y, Yao R, et al. Precursor N-cadherin mediates glial cell line-derived neurotrophic factor-promoted human malignant glioma. Oncotarget. 2017;8(15):24902–24914. - PMC - PubMed
    1. Roth DM, Moseley GW, Pouton CW, Jans DA. Mechanism of microtubule-facilitated "fast track" nuclear import. J Biol Chem. 2011;286(16):14335–14351. doi: 10.1074/jbc.M110.210302. - DOI - PMC - PubMed
    1. Giannakakou P, Sackett DL, Ward Y, Webster KR, Blagosklonny MV, Fojo T. p53 is associated with cellular microtubules and is transported to the nucleus by dynein. Nat Cell Biol. 2000;2(10):709–717. doi: 10.1038/35036335. - DOI - PubMed
    1. Roth DM, Moseley GW, Glover D, Pouton CW, Jans DA. A microtubule-facilitated nuclear import pathway for cancer regulatory proteins. Traffic. 2007;8(6):673–686. doi: 10.1111/j.1600-0854.2007.00564.x. - DOI - PubMed

Publication types

MeSH terms