An Unexpected Dependence of Cortical Depth in Shaping Neural Responsiveness and Selectivity in Mouse Visual Cortex
- PMID: 32051142
- PMCID: PMC7092962
- DOI: 10.1523/ENEURO.0497-19.2020
An Unexpected Dependence of Cortical Depth in Shaping Neural Responsiveness and Selectivity in Mouse Visual Cortex
Abstract
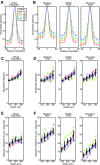
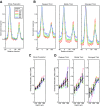
Two-photon imaging studies in mouse primary visual cortex (V1) consistently report that around half of the neurons respond to oriented grating stimuli. However, in cats and primates, nearly all neurons respond to such stimuli. Here we show that mouse V1 responsiveness and selectivity strongly depends on neuronal depth. Moving from superficial layer 2 down to layer 4, the percentage of visually responsive neurons nearly doubled, ultimately reaching levels similar to what is seen in other species. Over this span, the amplitude of neuronal responses also doubled. Moreover, stimulus selectivity was also modulated, not only with depth but also with response amplitude. Specifically, we found that orientation and direction selectivity were greater in stronger responding neurons, but orientation selectivity decreased with depth whereas direction selectivity increased. Importantly, these depth-dependent trends were found not just between layer 2/3 and layer 4 but at different depths within layer 2/3 itself. Thus, neuronal depth is an important factor to consider when pooling neurons for population analyses. Furthermore, the inability to drive the majority of cells in superficial layer 2/3 of mouse V1 with grating stimuli indicates that there may be fundamental differences in the micro-circuitry and role of V1 between rodents and other mammals.
Keywords: calcium; laminae; multi-photon; neocortex; selectivity; two-photon.
Copyright © 2020 O’Herron et al.
Figures


Similar articles
-
Cortical layer-specific differences in stimulus selectivity revealed with high-field fMRI and single-vessel resolution optical imaging of the primary visual cortex.Neuroimage. 2022 May 1;251:118978. doi: 10.1016/j.neuroimage.2022.118978. Epub 2022 Feb 7. Neuroimage. 2022. PMID: 35143974 Free PMC article.
-
Complex Visual Motion Representation in Mouse Area V1.J Neurosci. 2017 Jan 4;37(1):164-183. doi: 10.1523/JNEUROSCI.0997-16.2017. J Neurosci. 2017. PMID: 28053039 Free PMC article.
-
Pure tones modulate the representation of orientation and direction in the primary visual cortex.J Neurophysiol. 2019 Jun 1;121(6):2202-2214. doi: 10.1152/jn.00069.2019. Epub 2019 Apr 10. J Neurophysiol. 2019. PMID: 30969800
-
Orientation selectivity in the visual cortex of the nine-banded armadillo.J Neurophysiol. 2017 Mar 1;117(3):1395-1406. doi: 10.1152/jn.00851.2016. Epub 2017 Jan 4. J Neurophysiol. 2017. PMID: 28053246 Free PMC article.
-
The dynamics of visual responses in the primary visual cortex.Prog Brain Res. 2007;165:21-32. doi: 10.1016/S0079-6123(06)65003-6. Prog Brain Res. 2007. PMID: 17925238 Review.
Cited by
-
High fidelity sensory-evoked responses in neocortex after intravenous injection of genetically encoded calcium sensors.bioRxiv [Preprint]. 2023 Mar 10:2023.03.09.531938. doi: 10.1101/2023.03.09.531938. bioRxiv. 2023. Update in: Front Neurosci. 2023 May 12;17:1181828. doi: 10.3389/fnins.2023.1181828. PMID: 36945523 Free PMC article. Updated. Preprint.
-
Functional and structural features of L2/3 pyramidal cells continuously covary with pial depth in mouse visual cortex.Cereb Cortex. 2023 Mar 21;33(7):3715-3733. doi: 10.1093/cercor/bhac303. Cereb Cortex. 2023. PMID: 36017976 Free PMC article.
-
Sensing and processing whisker deflections in rodents.PeerJ. 2021 Feb 22;9:e10730. doi: 10.7717/peerj.10730. eCollection 2021. PeerJ. 2021. PMID: 33665005 Free PMC article.
-
Portrait of visual cortical circuits for generating neural oscillation dynamics.Cogn Neurodyn. 2021 Feb;15(1):3-16. doi: 10.1007/s11571-020-09623-4. Epub 2020 Aug 10. Cogn Neurodyn. 2021. PMID: 34109010 Free PMC article. Review.
-
Cortical layer-specific differences in stimulus selectivity revealed with high-field fMRI and single-vessel resolution optical imaging of the primary visual cortex.Neuroimage. 2022 May 1;251:118978. doi: 10.1016/j.neuroimage.2022.118978. Epub 2022 Feb 7. Neuroimage. 2022. PMID: 35143974 Free PMC article.
References
Publication types
MeSH terms
Grants and funding
LinkOut - more resources
Full Text Sources
Miscellaneous
