. 2020 Mar 20;295(12):3891-3905.
doi: 10.1074/jbc.RA119.011487. Epub 2020 Feb 12.

Vitamin D receptor targets hepatocyte nuclear factor 4α and mediates protective effects of vitamin D in nonalcoholic fatty liver disease

Affiliations

Vitamin D receptor targets hepatocyte nuclear factor 4α and mediates protective effects of vitamin D in nonalcoholic fatty liver disease

Hong Zhang et al. J Biol Chem. .

Abstract

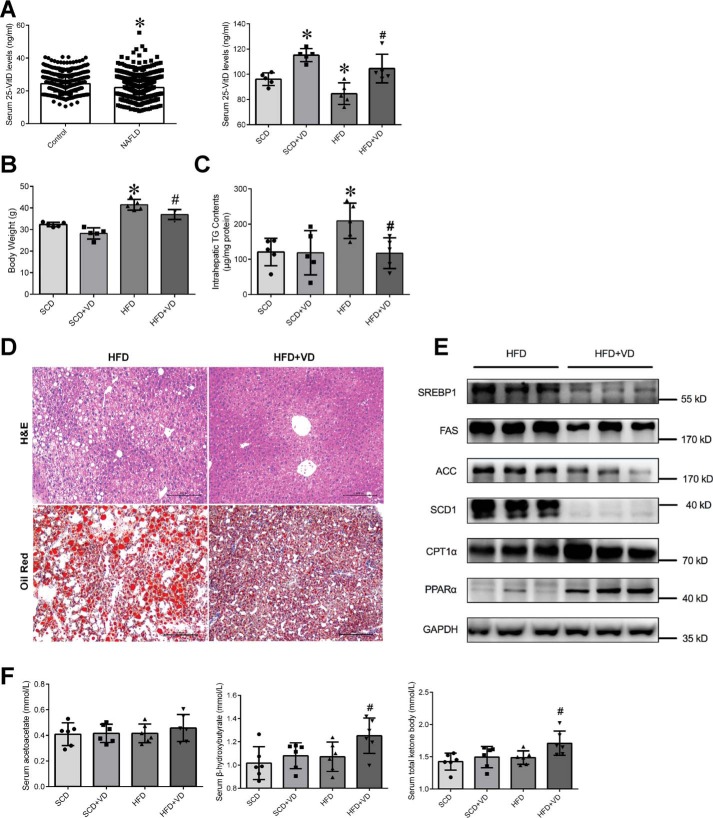
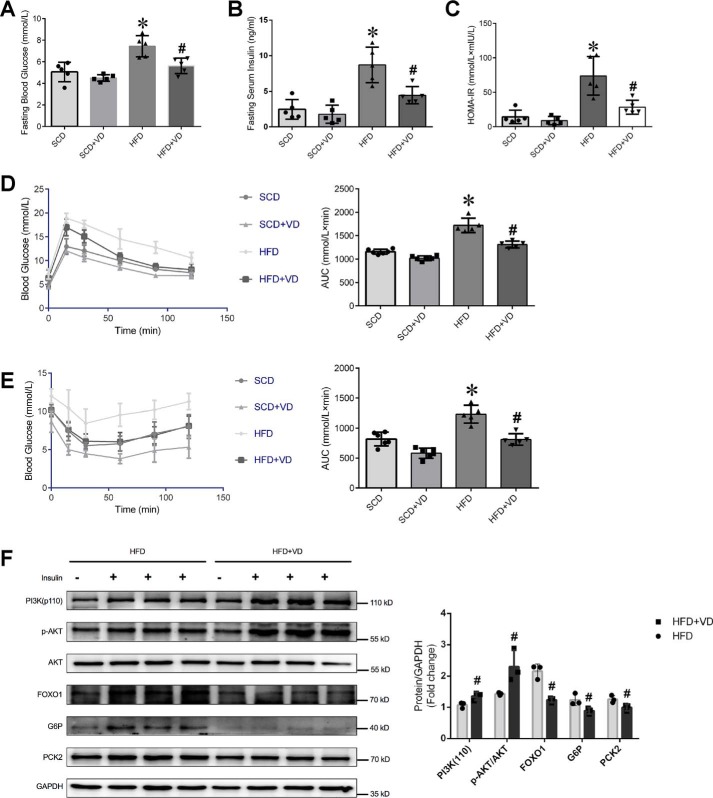
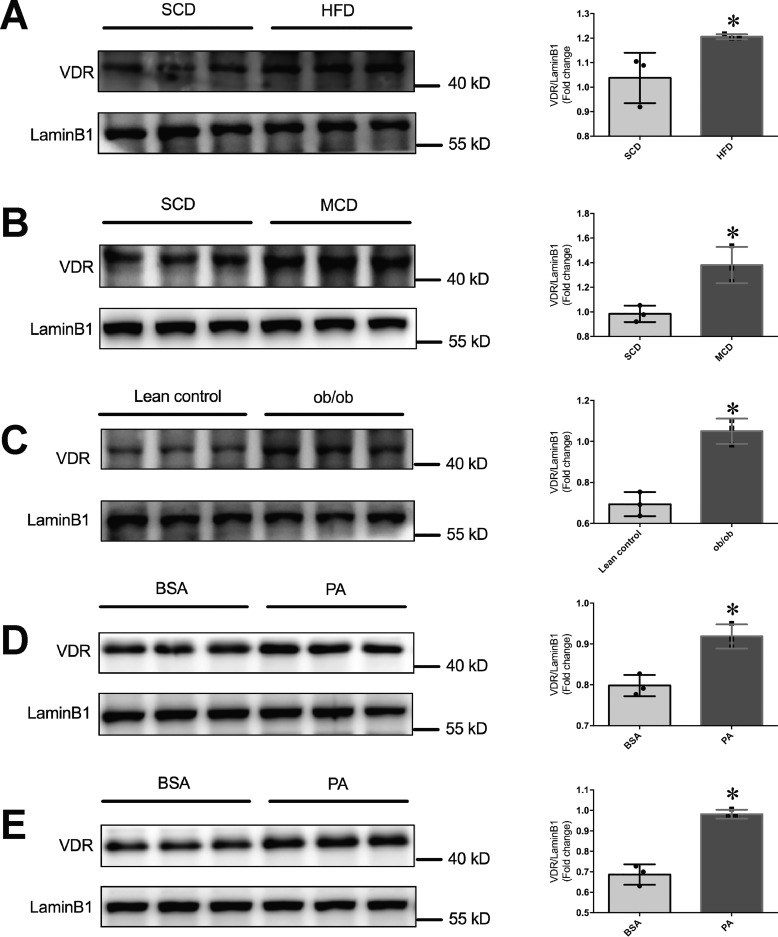
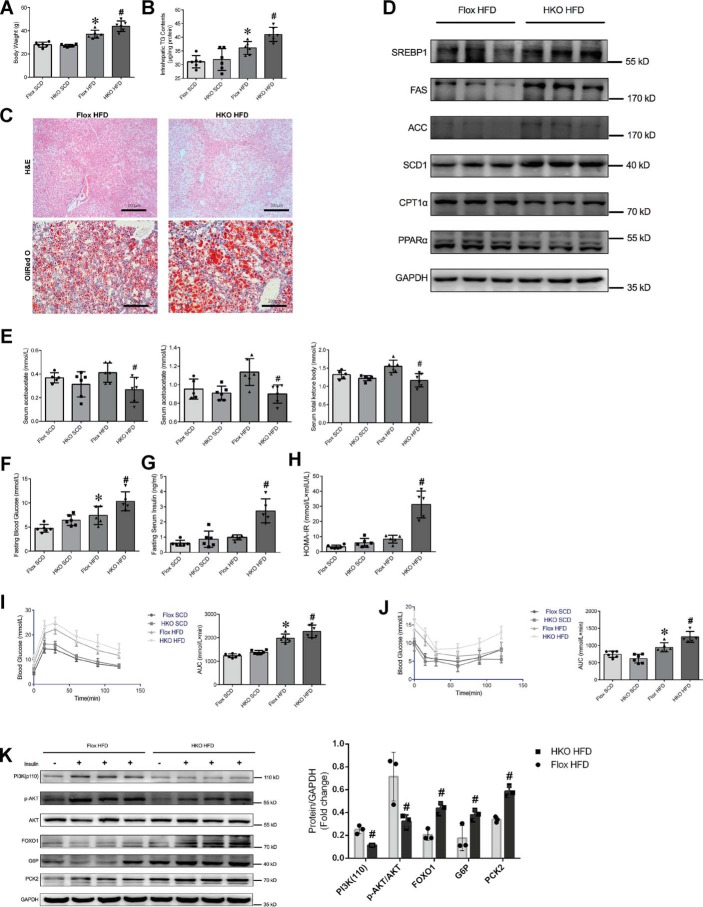
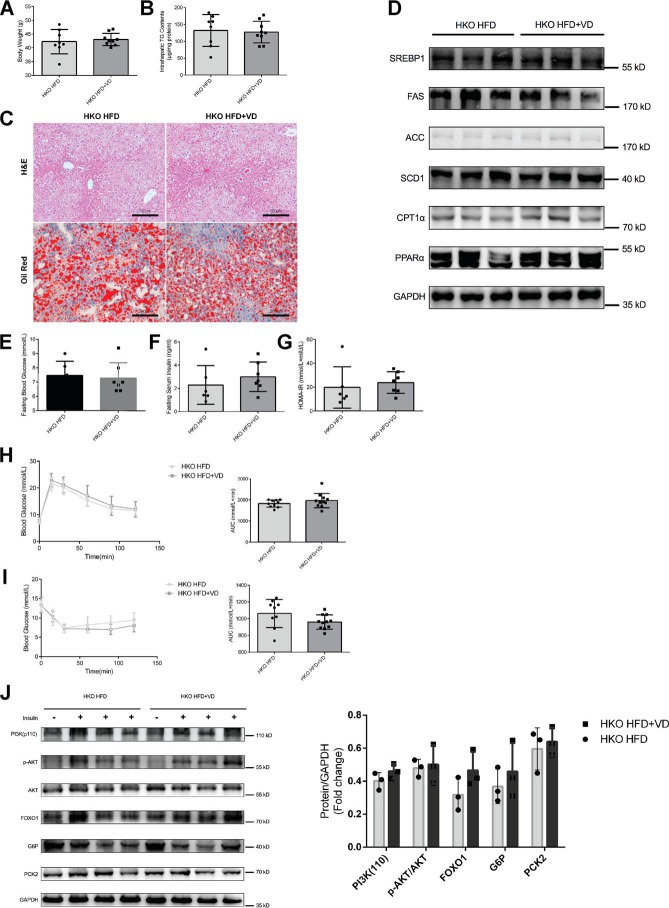
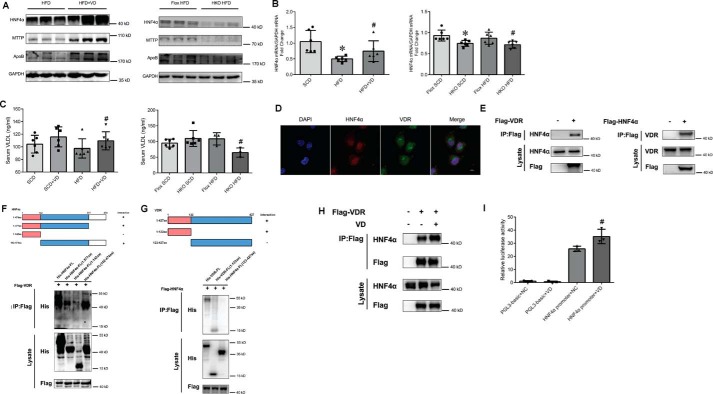
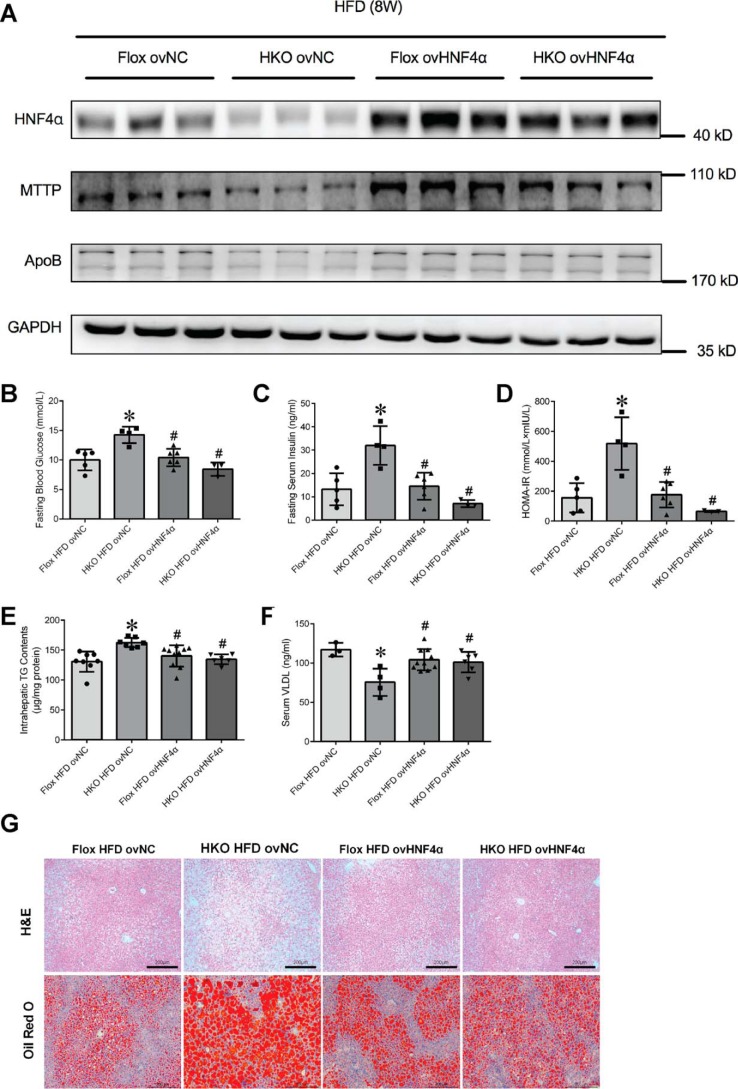
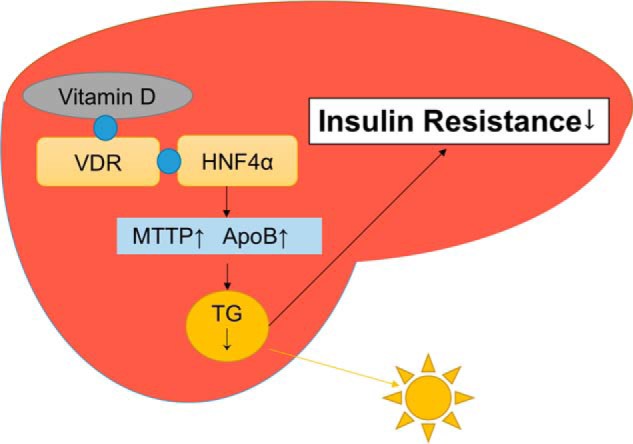
Epidemiological studies have suggested a link between vitamin D deficiency and increased risk for nonalcoholic fatty liver disease (NAFLD); however, the underlying mechanisms have remained unclear. Here, using both clinical samples and experimental rodent models along with several biochemical approaches, we explored the specific effects and mechanisms of vitamin D deficiency in NAFLD pathology. Serum vitamin D levels were significantly lower in individuals with NAFLD and in high-fat diet (HFD)-fed mice than in healthy controls and chow-fed mice, respectively. Vitamin D supplementation ameliorated HFD-induced hepatic steatosis and insulin resistance in mice. Hepatic expression of vitamin D receptor (VDR) was up-regulated in three models of NAFLD, including HFD-fed mice, methionine/choline-deficient diet (MCD)-fed mice, and genetically obese (ob/ob) mice. Liver-specific VDR deletion significantly exacerbated HFD- or MCD-induced hepatic steatosis and insulin resistance and also diminished the protective effect of vitamin D supplementation on NAFLD. Mechanistic experiments revealed that VDR interacted with hepatocyte nuclear factor 4 α (HNF4α) and that overexpression of HNF4α improved HFD-induced NAFLD and metabolic abnormalities in liver-specific VDR-knockout mice. These results suggest that vitamin D ameliorates NAFLD and metabolic abnormalities by activating hepatic VDR, leading to its interaction with HNF4α. Our findings highlight a potential value of using vitamin D for preventing and managing NAFLD by targeting VDR.

Keywords: gene regulation; hepatic steatosis; hepatocyte nuclear factor 4 α (HNF4α); insulin resistance; lipid metabolism; liver metabolism; metabolic syndrome; nonalcoholic fatty liver disease (NAFLD); nuclear receptor; vitamin D.


Conflict of interest statement

The authors declare that they have no conflicts of interest with the contents of this article

Figures

Figure 1.
Figure 1.
Vitamin D supplementation attenuates HFD-induced hepatic steatosis in mice. Mice were fed with a SCD or HFD for 8 weeks with or without adding 2000 IU of vitamin D per 4057 kcal (n = 5–7 mice/group). A: left, serum 25-VitD levels of nonsteatosis controls (NC) (n = 798) and NAFLD patients (n = 1596); *, p < 0.05 versus the NC group (p values calculated by Student's t test). Right, serum 25-VitD levels from mice. B, body weights of mice. C, liver TG contents in the indicated groups. D, H&E and Oil Red O staining of liver sections of mice (100-fold magnification and scale bar = 200 μm). E, representative Western blot analyses of the protein levels of genes related to lipid synthesis (SREBP-1, FAS, SCD1, and ACC) and β-oxidation (CPT-1α and PPARα) in mouse livers. F, serum ketone body levels from mice: left, acetoacetate; middle, β-hydroxybutyrate; and right, total ketone bodies. *, p < 0.05, compared with the SCD group; #, p < 0.05, compared with the HFD group (p values calculated by one-way ANOVAs). SCD + VD indicates SCD with added 2000 IU of vitamin D (VD) per 4057 kcal; HFD + VD indicates HFD with added 2000 IU of vitamin D per 4057 kcal.
Figure 2.
Figure 2.
Vitamin D supplementation improves HFD-induced insulin sensitivity in HFD-fed mice. Mice were fed with SCD or HFD for 8 weeks with or without adding 2000 IU of vitamin D per 4057 kcal (n = 5–7 mice/group). A, fasting blood glucose levels in mice. B, fasting serum insulin levels in mice. C, HOMA-IR indices in the indicated groups. D and E, GTT (D) and ITT (E) with the corresponding areas under the curve (AUCs) in mice. F: left, representative Western blot analyses; right, quantification of hepatic protein levels of PI3K, as well as the phosphorylation levels of AKT, FOXO1, PCK2, and G6P of 8-week-old HFD-fed mice with or without vitamin D supplementation and insulin administration (n = 3 mice/group without insulin injection; n = 3 mice/group with insulin injection). *, p < 0.05, compared with the SCD group; #, p < 0.05, compared with the HFD group (p values calculated by one-way ANOVAs). SCD + VD indicates SCD with added 2000 IU of vitamin D per 4057 kcal; HFD + VD indicates HFD with added 2000 IU of vitamin D per 4057 kcal.
Figure 3.
Figure 3.
VDR expression is up-regulated in fatty livers. A, left: representative Western blot analyses, and right, quantification of livers from mice fed with an SCD or HFD for 8 weeks (n = 6 mice/group). B: left, representative Western blot analyses, and right, quantification of livers from mice fed with an SCD or MCD for 5 weeks (n = 5–6 mice/group). C: left, representative Western blot analyses, and right, quantification of livers in ob/ob mice and lean controls (n = 4 mice/group). D: left, representative Western blot analyses, and right, quantification of VDR expression in primary cultured hepatocytes that were treated with BSA or PA (0.3 mmol/liter) (n = 3/group). E: left, representative Western blot analyses, and right, quantification of VDR expression in QSG-7701 cells that were treated with BSA or PA (0.3 mmol/liter) (n = 3/group). *, p < 0.05, compared with the corresponding control group (p values calculated by Student's t tests).
Figure 4.
Figure 4.
Hepatic-specific VDR knockout mice are more susceptible to HFD-induced steatosis. VDR–Flox control mice and VDR–HKO mice were fed with a HFD for 8 weeks (n = 5–6 mice/group). A, body weights of mice. B, liver TG contents in the indicated groups. C, H&E and Oil Red O staining of liver sections of the mice (100-fold magnification and scale bar = 200 μm). D, representative Western blot analyses of the protein levels of genes related to lipid synthesis (SREBP-1, FAS, SCD1, and ACC) and β-oxidation (CPT-1α and PPARα) in mouse livers. E, serum ketone body levels from mice: left, acetoacetate; middle, β-hydroxybutyrate; and right, total ketone bodies. F, fasting blood glucose levels in mice. G, fasting serum insulin levels in mice. H, HOMA-IR indices in the indicated groups. I and J, GTT (I) and ITT (J) with the corresponding AUCs in mice. K: left, representative Western blot analyses, and right, quantification of protein levels of PI3K, as well as the phosphorylation levels of AKT, FOXO1, PCK2, and G6P in the livers of 8-week HFD-fed VDR–Flox and VDR–HKO mice with or without insulin administration (n = 3 mice/group without insulin injection and n = 3 mice/group with insulin injection). *, p < 0.05, compared with the SCD group; #, p < 0.05, compared with the HFD group (p values calculated by one-way ANOVAs). Flox indicates the VDR–Flox group; HKO indicates the VDR–HKO group.
Figure 5.
Figure 5.
Genetic deletion of VDR in hepatocyte abolishes the beneficial effect of vitamin D in NAFLD. VDR–HKO mice were fed an HFD for 8 weeks with or without adding 2000 IU of vitamin D per 4057 kcal (n = 8–9 mice/group). A, body weights of mice. B, liver TG contents in the indicated groups. C, H&E and Oil Red O staining of liver sections of mice (100-fold magnification and scale bar = 200 μm). D, representative Western blot analyses of the protein levels of genes related to lipid synthesis (SREBP-1, FAS, SCD1, and ACC) and β-oxidation (CPT-1α and PPARα) in mouse livers. E, fasting blood glucose levels in mice. F, fasting serum insulin levels in mice. G, HOMA-IR indices in the indicated groups. H and I, GTT (H) and ITT (I) with the corresponding AUCs in mice. J, left, representative Western blot analyses, and right, quantification of the protein levels of PI3K, as well as the phosphorylation levels of AKT, FOXO1, PCK2, and G6P in the livers of mice with or without insulin administration (n = 5–6 mice/group without insulin injection, n = 3 mice/group with insulin injection). HKO HFD indicates HFD-fed VDR–HKO group; HKO HFD + VD indicates HFD with 2000 IU of vitamin D per 4057 kcal added VDR–HKO group.
Figure 6.
Figure 6.
VDR regulates HNF4α-mediated TG transportation via interaction with HNF4α. A: left, representative Western blot analyses of the protein levels of HNF4α, MTTP, and ApoB in the livers of mice fed a HFD for 8 weeks with or without vitamin D added (n = 3 mice/group), and right, in the livers of the VDR–Flox and VDR–HKO mice after administration of a HFD for 8 weeks (n = 3 mice/group). GAPDH panel right, was the same with the GAPDH panel in Fig. 4D because the same samples were analyzed. B, representative quantitative real-time PCR analyses of the mRNA levels of HNF4α in the livers of the mice fed a HFD for 8 weeks with or without vitamin D added (n = 5–6 mice/group), and right, in the livers of VDR–Flox and VDR–HKO mice after administration of HFD for 8 weeks (n = 5–6 mice/group). C, serum VLDL levels from left, mice fed a HFD for 8 weeks with or without vitamin D added (n = 3–6 mice/group), and right, in the livers of the VDR–Flox and VDR–HKO mice after administration of HFD for 8 weeks (n = 3–6 mice/group). D, representative immunofluorescent images of DAPI, VDR, and HNF4α and the merge of all stainings in QSG-7701 cells (scale bar = 10 μm). E, Co-IP and Western blot analyses showing the interaction between VDR and HNF4α in QSG-7701 cells transfected with Flag-VDR or Flag-HNF4α. F and G: top, schematics of the HNF4α (F) and VDR (G) constructs. Bottom, interaction domains of HNF4α and VDR were explored using full-length and truncated HNF4α (F) and VDR (G) expression constructs based on co-immunoprecipitation assays in QSG-7701 cells. H, Co-IP and Western blot analyses showing the interaction between VDR and HNF4α in QSG-7701 cells transfected with or without Flag-VDR and 100 nm/liter vitamin D. I, relative luciferase activity in L02 cells transfected with PGL3-basic vector or the HNF4α-promoter luciferase reporter plasmids for 48 h with or without 100 nm/liter vitamin D added (n = 3/group). *, p < 0.05, compared with the SCD group; #, p < 0.05, compared with the HFD group or HNF4α promoter + NC group (p values calculated by one-way ANOVAs). SCD + VD indicates SCD with added 2000 IU of vitamin D per 4057 kcal; HFD + VD indicates HFD with added 2000 IU of vitamin D per 4057 kcal. Flox indicates the VDR–Flox group; HKO indicates the VDR–HKO group.
Figure 7.
Figure 7.
Overexpression of HNF4α ameliorates HFD-induced NAFLD in VDR–HKO mice. Eight-week-old HFD-fed VDR–Flox and VDR–HKO mice were injected with HNF4α overexpressing AAV or ovNC AAV through the tail vein (n = 6–10 mice/group). A, representative Western blot analyses of the protein levels of HNF4α, MTTP, and ApoB in the livers of mice. B, fasting blood glucose levels in mice. C, fasting serum insulin levels in mice. D, HOMA-IR indices in the indicated groups. E, liver TG contents in the indicated groups. F, serum VLDL levels in mice. G, H&E and Oil Red O staining of liver sections from mice (100-fold magnification and scale bar = 200 μm). *, p < 0.05, compared with the Flox HFD ovNC group; #, p < 0.05, compared with the HKO HFD ovNC group (p values calculated by one-way ANOVAs). Flox HFD ovNC indicates the HFD-fed VDR–Flox group with ovNC AAV injected; HKO HFD ovNC indicates the HFD-fed VDR–HKO group with ovNC AAV injected; Flox HFD ovHNF4α indicates the HFD-fed VDR–Flox group with HNF4α overexpressing AAV injected; HKO HFD ovHNF4α indicates the HFD-fed VDR–HKO group with HNF4α overexpressing AAV injected.
Figure 8.
Figure 8.
Summary of pathological and underlying regulatory mechanisms of vitamin D and VDR in NAFLD.

Similar articles

Cited by

References

    1. Diehl A. M., and Day C. (2017) Cause, pathogenesis, and treatment of nonalcoholic steatohepatitis. N. Engl. J. Med. 377, 2063–2072 10.1056/NEJMra1503519 - DOI - PubMed
    1. Lee M. S., Han H. J., Han S. Y., Kim I. Y., Chae S., Lee C. S., Kim S. E., Yoon S. G., Park J. W., Kim J. H., Shin S., Jeong M., Ko A., Lee H. Y., Oh K. J., et al. (2018) Loss of the E3 ubiquitin ligase MKRN1 represses diet-induced metabolic syndrome through AMPK activation. Nat. Commun. 9, 3404 10.1038/s41467-018-05721-4 - DOI - PMC - PubMed
    1. Wong V. W., Chitturi S., Wong G. L., Yu J., Chan H. L., and Farrell G. C. (2016) Pathogenesis and novel treatment options for non-alcoholic steatohepatitis. Lancet Gastroenterol. Hepatol. 1, 56–67 10.1016/S2468-1253(16)30011-5 - DOI - PubMed
    1. Anstee Q. M., Reeves H. L., Kotsiliti E., Govaere O., and Heikenwalder M. (2019) From NASH to HCC: current concepts and future challenges. Nat. Rev. Gastroenterol. Hepatol. 16, 411–428 10.1038/s41575-019-0145-7 - DOI - PubMed
    1. Xie L., Wang P. X., Zhang P., Zhang X. J., Zhao G. N., Wang A., Guo J., Zhu X., Zhang Q., and Li H. (2016) DKK3 expression in hepatocytes defines susceptibility to liver steatosis and obesity. J. Hepatol. 65, 113–124 10.1016/j.jhep.2016.03.008 - DOI - PubMed

Publication types

MeSH terms