. 2020 Feb 12;12(530):eaax0876.
doi: 10.1126/scitranslmed.aax0876.

Engineered probiotics for local tumor delivery of checkpoint blockade nanobodies

Affiliations

Engineered probiotics for local tumor delivery of checkpoint blockade nanobodies

Candice R Gurbatri et al. Sci Transl Med. .

Abstract

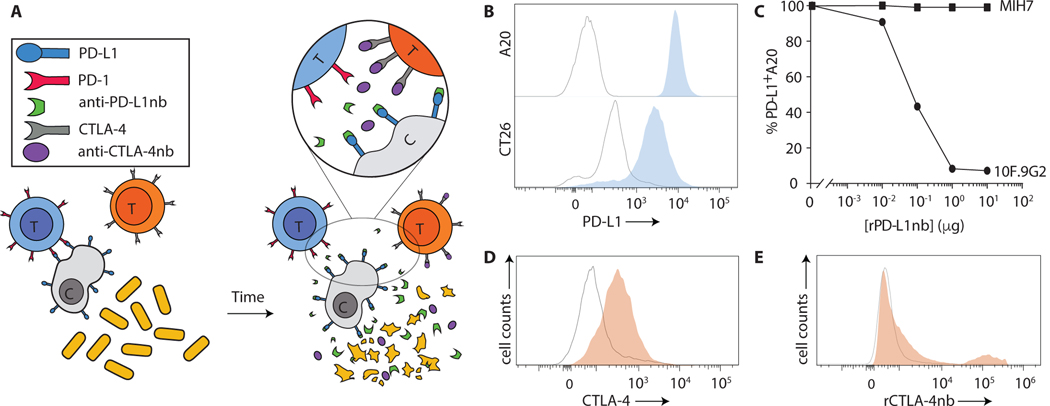
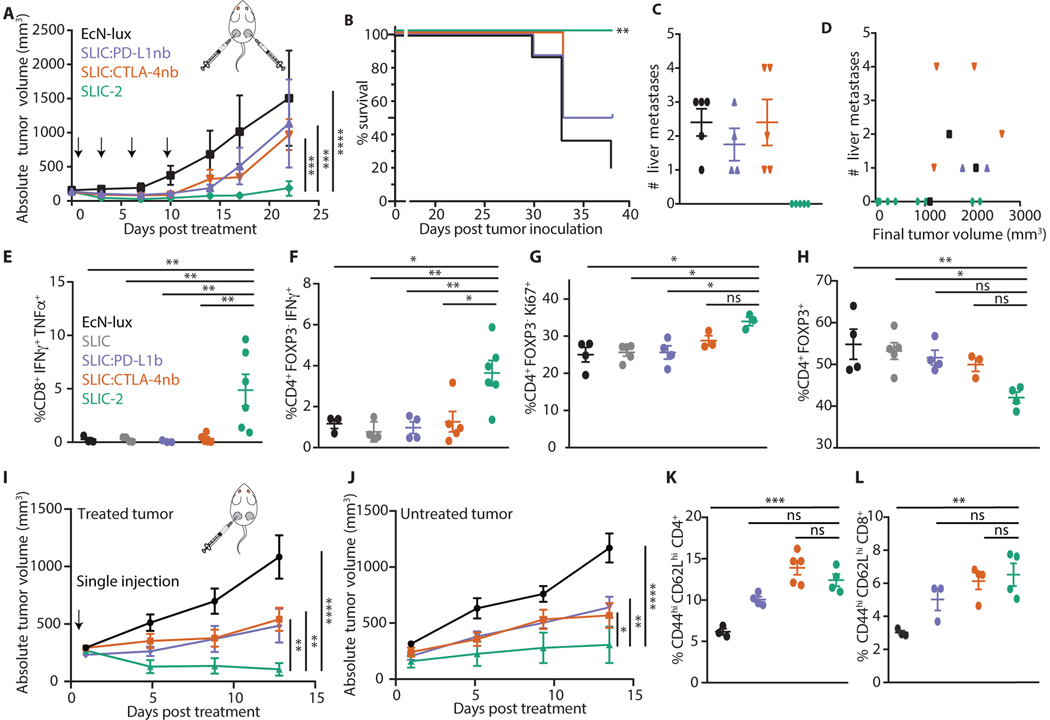
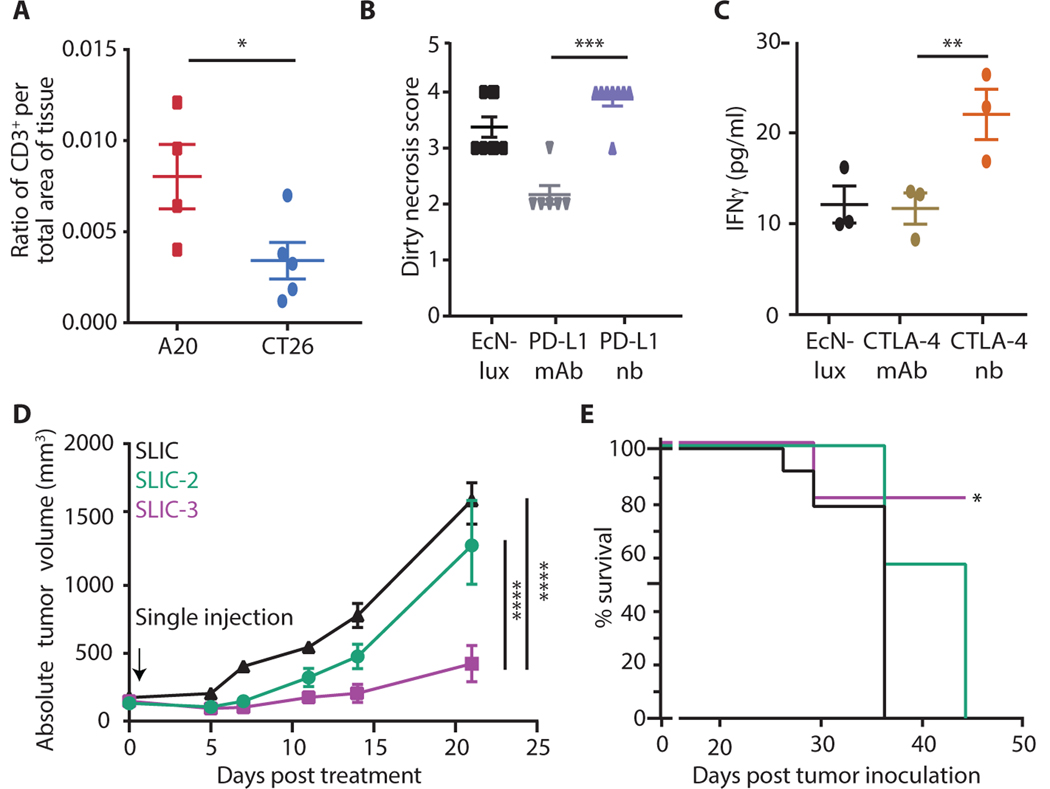
Checkpoint inhibitors have revolutionized cancer therapy but only work in a subset of patients and can lead to a multitude of toxicities, suggesting the need for more targeted delivery systems. Because of their preferential colonization of tumors, microbes are a natural platform for the local delivery of cancer therapeutics. Here, we engineer a probiotic bacteria system for the controlled production and intratumoral release of nanobodies targeting programmed cell death-ligand 1 (PD-L1) and cytotoxic T lymphocyte-associated protein-4 (CTLA-4) using a stabilized lysing release mechanism. We used computational modeling coupled with experimental validation of lysis circuit dynamics to determine the optimal genetic circuit parameters for maximal therapeutic efficacy. A single injection of this engineered system demonstrated an enhanced therapeutic response compared to analogous clinically relevant antibodies, resulting in tumor regression in syngeneic mouse models. Supporting the potentiation of a systemic immune response, we observed a relative increase in activated T cells, an abscopal effect, and corresponding increases in systemic T cell memory populations in mice treated with probiotically delivered checkpoint inhibitors. Last, we leveraged the modularity of our platform to achieve enhanced therapeutic efficacy in a poorly immunogenic syngeneic mouse model through effective combinations with a probiotically produced cytokine, granulocyte-macrophage colony-stimulating factor (GM-CSF). Together, these results demonstrate that our engineered probiotic system bridges synthetic biology and immunology to improve upon checkpoint blockade delivery.


Figures

Figure 1:
Figure 1:. Design and characterization of a probiotic cancer therapy system for release of functional PD-L1 and CTLA-4 blocking nanobodies.
(A) Schematic showing the mechanism by which engineered bacteria controllably release constitutively produced PD-L1 and CTLA-4 blocking nanobodies intratumorally. (B) Flow cytometric analysis of PD-L1 expression on A20 and CT26 cells (gray: unstained; blue: PD-L1), where the y-axis of histograms represents cell counts normalized to mode. (C) Binding curves of rPD-L1nb to the 10F.9G2 and MIH7 PD-L1 epitopes on A20 cells. (D-E) Splenocytes were isolated from healthy C57BL/6 mice and analyzed by flow cytometry for (D) intracellular CTLA-4 expression (gray: unstimulated CD3+ splenocytes; orange: PMA/I-simulated CD3+ splenocytes), where the y-axis of the histogram represents cell counts normalized to mode and (E) rCTLA-4nb binding to extracellular CTLA-4 (gray: secondary anti-HIS antibody alone gated on CD3+ splenocytes; orange: rCTLA-4nb gated on CD3+ splenocytes), where the y-axis of the histogram represents cell counts normalized to mode.
Figure 2:
Figure 2:. Characterization of lysis circuit variant dynamics.
(A) Lysis circuit diagram in which plux drives the transcription of luxI and ϕX174E genes under a single promoter. The circuit was cloned onto three plasmids with different copy numbers: sc101* (3–4 copies, low), p15A (15–20 copies, medium), and colE1 (70–100 copies, high) and integrated once into the ϕ80 site of the EcN-lux genome (synchronized lysing integrated circuit – SLIC). (B) Computational simulation of the number of bacteria required for the first lysis event as a function of copy number (left y axis: black) and the time to first lysis event (right y axis: gray); a.u. arbitrary units. (C) Simulated heatmap of therapeutic protein produced (z-axis, where the amount produced is represented by the color bar) as a function of copy number (y-axis) and time (x-axis). (D) Experimental data showing the number of bacteria required for the first lysis event as a function of copy number and time to the first lysis event. Data represented as means +/− SEM of 3 repeated experiments. (E) Heatmap of sfGFP produced over time by the copy number variants as quantified by a plate reader; RFU, relative fluorescence units. (F) IVIS images showing bioluminescent bacterial populations and heatmaps quantifying the total flux (photons/second) of bacterial populations over time for SLIC-2 and SLC-p15A-2 variants. (G) Quantification of IVIS images plotting the total flux (black) of SLIC-2 and SLC-p15A-2 variant bacterial populations and time to first lysis event (gray). (H) BALB/c mice were implanted subcutaneously with 5×10⁶ A20 cells on both hind flanks. When tumors reached ~150–200 mm3, mice received one intratumoral injection of EcN-lux, SLIC-2 or SLIC-p15A-2. Graph is of mean absolute tumor trajectories (n = 4–5 tumors per group, 2-way ANOVA with Bonferroni post-test, *P = 0.0172, **P = 0.0033, ****P < 0.0001, error bars represent SEM of biological replicates); individual tumor trajectories are shown in fig. S3.
Figure 3:
Figure 3:. Therapeutic response to probiotically-produced checkpoint inhibitors is mediated by the adaptive immune system.
(A-D) BALB/c mice were implanted subcutaneously with 5×10⁶ A20 cells on both hind flanks. When tumors reached ~150–200 mm3, mice received intratumoral injections of EcN-lux, SLIC, SLIC:CTLA-4nb, SLIC:PD-L1nb, or an equal parts combination of the latter two strains (SLIC-2) in both flanks every 3–4 days, such that the total concentration of bacteria injected was 5×10⁶ per tumor in all groups. (A) Mean absolute tumor trajectories (n = 4–7 tumors per group, 2-way ANOVA with Bonferroni post-test, ***P < 0.0005, ****P < 0.0001, error bars represent SEM of biological replicates); individual tumor trajectories are shown in fig. S4A. (B) Survival of different treatment groups (**P = 0.0011, log-rank test, n = 4–5 mice per group). (C-D) Aggregated data from multiple trials showing the (C) number of visible liver metastases identified ex vivo 40 days after tumor inoculation and (D) relationship beween number of liver metastases counted and the final volume of the primary tumor. (E-H) Tumor-infiltrating lymphocytes were isolated on day 8 after initial treatment and analyzed by flow cytometry for frequencies of activated (E) CD8+IFNγ+TNFα+ and (F) CD4+ FOXP3 IFNγ+ T cells, (G) proliferating CD4+FOXP3Ki67+ conventional T cells, and (H) CD4+FOXP3+ regulatory T cells (n = 3–6 tumors per group, ordinary 1-way ANOVA with Tukey’s post-test, *P < 0.05, **P < 0.01, data is represented as means +/− SEM of biological replicates; ns, not significant). (I-J) BALB/c mice were grafted as stated above. When tumors reached ~150 mm3, mice received a single intratumoral injection of EcN-lux, SLIC:CTLA-4nb, SLIC:PD-L1nb, or an equal parts combination of both strains (SLIC-2) into their left flank, such that the total concentration of bacteria injected was 5×10⁶ per tumor in all groups. Mean absolute tumor trajectories of the (I) treated tumor and (J) untreated tumor (n = 4–5 tumors per group, 2-way ANOVA with Holm-Sidak post-test, *P < 0.05, **P < 0.01, ****P < 0.0001, error bars represent SEM of biological replicates); individual tumor trajectories are shown in fig. S4C-D. (K-L) Splenocytes were isolated on day 8 after initial treatment and analyzed by flow cytometry for frequencies of CD44hi CD62Lhi central memory (K) CD4+ T cells and (L) CD8+ T cells (n = 3–5 tumors per group, ordinary 1-way ANOVA with Tukey’s post-test, ***P < 0.001, **P < 0.01, data are represented as means +/− SEM of biological replicates).
Figure 4:
Figure 4:. Single injection of probiotics expressing checkpoint inhibitors demonstrates robustness.
(A-C) BALB/c mice were implanted subcutaneously with 5×10⁶ A20 cells on both hind flanks. When tumors reached ~150–200 mm3, mice received one intratumoral injection of EcN-lux, SLIC-2, or a combination of anti-PD-L1 and anti-CTLA-4 mAbs at 100 μg/mouse and 200 μg/mouse, respectively. (A) Mean absolute tumor trajectories (n = 8–10 tumors per group, 2-way ANOVA with Bonferroni post-test, ****P < 0.0001, error bars represent SEM of biological replicates); individual tumor trajectories shown in fig. S5A. (B) Serum concentrations of TNFα ( n = 3 mice per group, ordinary 1-way ANOVA with Holm-Sidak post-test, *P = 0.0385, data are represented as means +/− SEM. of biological replicates). (C) Rate of body weight change in g/day (n = 4–5 mice per group, ordinary 1-way ANOVA with Tukey’s post-test, *P = 0.0387, error bars represent SEM of biological replicates; ns, not significant). (D) Scatter plot showing each tumor’s final volume plotted against its initial tumor volume. Black line (y=x) represents the threshold where points below the line indicate tumor regression and points above the line indicate tumor growth. (E) Representative IVIS images of mice from the experimental groups described above, where mice were dosed once with nonlysing EcN-lux or SLIC-2. (F) Heatmaps quantifying total flux (photons/second) of luminescent bacteria populations over time, corresponding to IVIS images. (G) Plate reader experiment showing the oscillations of plated colonies from tumors harvested on days 3 and 14 after treatment and a grid showing the number of successful lysis events. (H-J) A20-bearing mice were grafted as stated above, and mice received a single intraveneous injection of either 5×10⁶ EcN-lux or SLIC-2 via tail vein. (H) Mean absolute tumor trajectories (n = 9–11 tumors per group, 2-way ANOVA with Bonferroni post-test, ****P < 0.0001, error bars represent SEM of biological replicates); individual tumor trajectories shown in fig. S5D. (I) Representative IVIS images from mice treated with SLIC-2 and a heatmap quantifying the total flux (photons/second) of luminescent bacterial populations over time. (J) Plate reader experiment showing the oscillations of colonies plated from tumors harvested on day 14 after treatment and a grid of the number of successul lysis events. (K) Biodistribution of bacterial populations in the tumor and peripheral organs (liver, lung, spleen, and kidney) calculated as colony-forming units per gram of tissue (CFU/g).
Figure 5:
Figure 5:. The SLIC platform allows for multiple therapeutics to be effectively combined for an enhanced antitumor effect in poorly immunogenic cancers.
(A) When A20 or CT26 tumors reached ~100–200 mm3, mice received an intratumoral injection of PBS, and tumors were IHC stained for CD3+ populations (n = 4–5 tumors per group, unpaired T test, *P = 0.048, data represented as means +/− SEM of biological replicates). (B-C) BALB/c mice were implanted subcutaneously with 5×10⁶ CT26 cells on both hind flanks. When tumors reached ~100–200 mm3, mice received an intratumoral injection of EcN-lux, SLIC:PD-L1nb, or SLIC:CTLA-4nb, or an intraperitoneal injection of anti-PD-L1 or anti-CTLA-4 mAbs. Tumors were extracted and processed for subsequent analysis. (B) Dirty necrosis scores of tissue samples from tumors treated with EcN-lux, SLC-int:PD-L1nb, or anti-PD-L1 mAb (***P = 0.007 Mann-Whitney Test ordinal non-parametric between SLIC:PD-L1nb and anti-PD-L1 mAb, n = 6–8 scores per group, data represented as means +/− SEM of biological replicates). (C) IFNγ concentration in SLIC:CTLA-4nb-treated tumor lysates measured by Luminex Multiplex Assay (n = 3 tumors per group, ordinary 1-way ANOVA with Holm-Sidak post-test, *P = 0.0390, data represented as means +/− SEM of biological replicates). (D-E) BALB/c mice were implanted subcutaneously with 5×10⁶ CT26 cells on both hind flanks. When tumors reached a volume of ~200 mm3, mice received a single intratumoral injection of SLIC, an equal parts mix of SLIC bacteria expressing PD-L1nb and CTLA-4nb (SLIC-2), or an equal parts mix of SLIC bacteria expressing PD-L1nb, CTLA-4nb, and GM-CSF (SLIC-3). (D) Mean absolute tumor trajectories (n = 5–6 tumors per group, 2-way ANOVA with Bonferroni post-test, ****P < 0.0001, error bars represent SEM of biological replicates); individual tumor trajectories shown in fig. S9B. (E) Survival of different treatment groups (*P = 0.0377, Log-rank test, n = 4–5 mice per group).

References

    1. Zhang T, Xie J, Arai S, Wang L, Shi X, Shi N, Ma F, Chen S, Huang L, Yang L, The efficacy and safety of anti-PD-1/PD-L1 antibodies for treatment of advanced or refractory cancers: a meta-analysis. Oncotarget 7, 73068 (2016). - PMC - PubMed
    1. D’Angelo SP, Larkin J, Sosman JA, Lebbé C, Brady B, Neyns B, Schmidt H, Hassel JC, Hodi FS, Lorigan P, Efficacy and safety of nivolumab alone or in combination with ipilimumab in patients with mucosal melanoma: a pooled analysis. Journal of Clinical Oncology 35, 226 (2017). - PMC - PubMed
    1. Naidoo J, Page D, Li B, Connell L, Schindler K, Lacouture M, Postow M, Wolchok J, Toxicities of the anti-PD-1 and anti-PD-L1 immune checkpoint antibodies. Annals of Oncology 26, 2375–2391 (2015). - PMC - PubMed
    1. Topalian SL, Hodi FS, Brahmer JR, Gettinger SN, Smith DC, McDermott DF, Powderly JD, Carvajal RD, Sosman JA, Atkins MB, Safety, activity, and immune correlates of anti–PD-1 antibody in cancer. New England Journal of Medicine 366, 2443–2454 (2012). - PMC - PubMed
    1. Brahmer JR, Tykodi SS, Chow LQ, Hwu W-J, Topalian SL, Hwu P, Drake CG, Camacho LH, Kauh J, Odunsi K, Safety and activity of anti–PD-L1 antibody in patients with advanced cancer. New England Journal of Medicine 366, 2455–2465 (2012). - PMC - PubMed

Publication types