. 2020 Feb 12;12(530):eaaw9996.
doi: 10.1126/scitranslmed.aaw9996.

GLP-1 receptor agonists synergize with DYRK1A inhibitors to potentiate functional human β cell regeneration

Affiliations

GLP-1 receptor agonists synergize with DYRK1A inhibitors to potentiate functional human β cell regeneration

Courtney Ackeifi et al. Sci Transl Med. .

Abstract

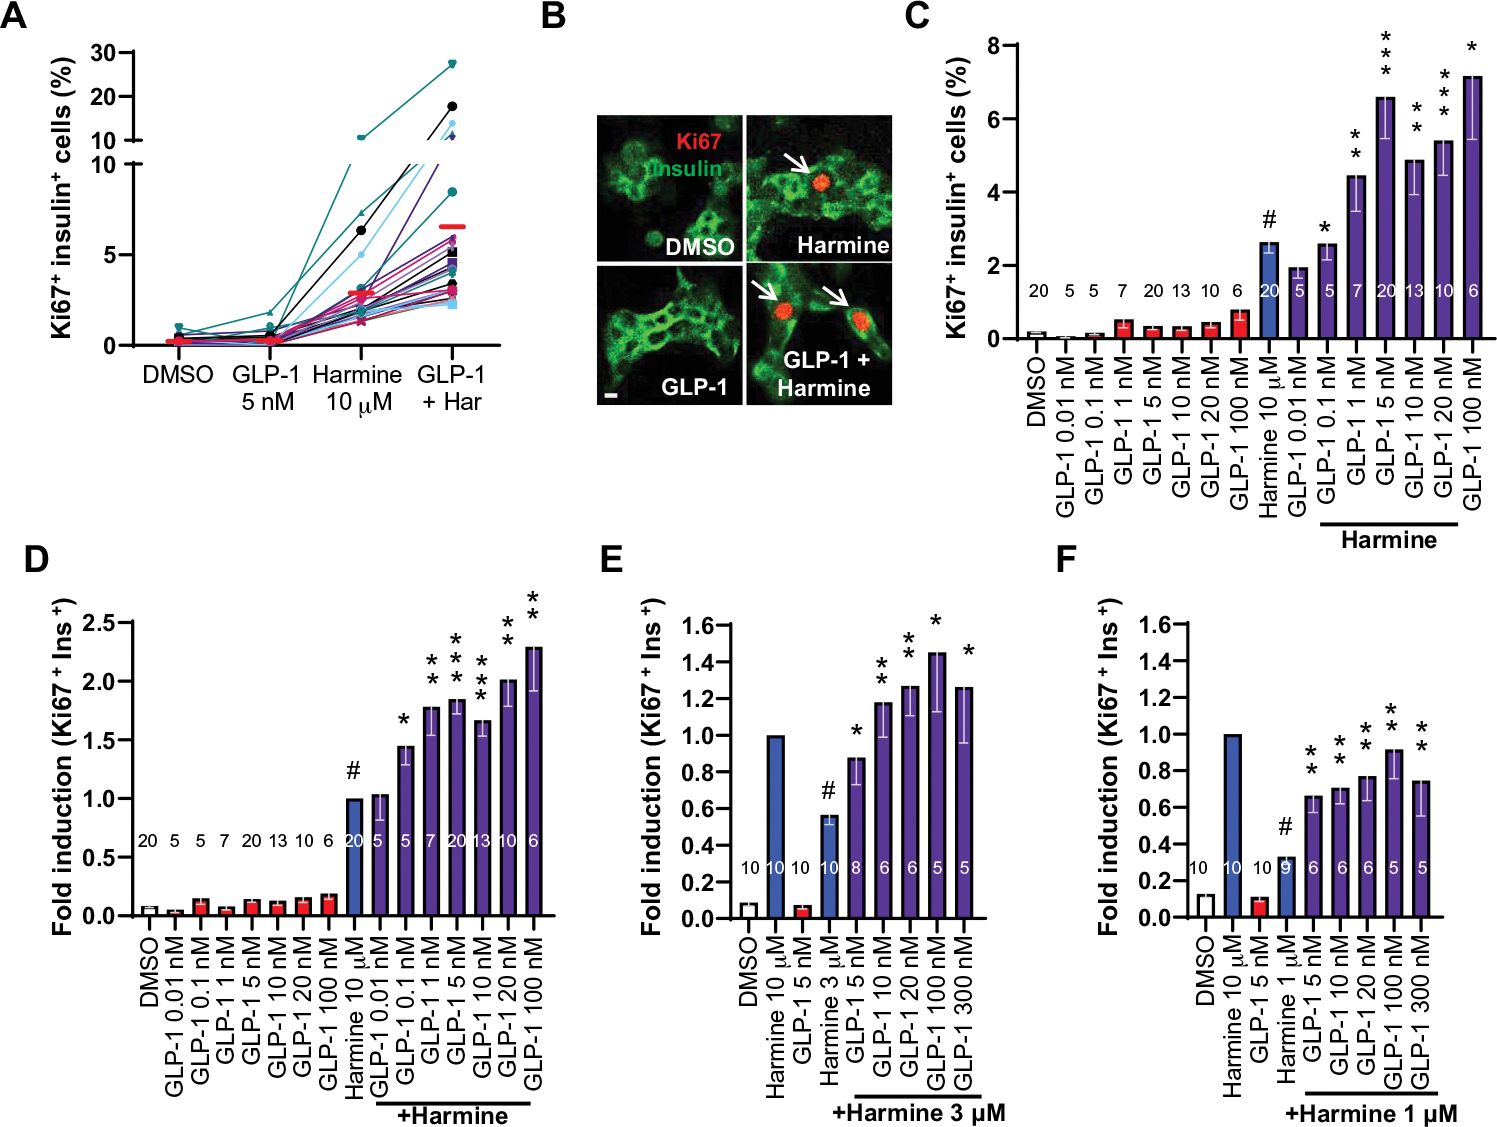
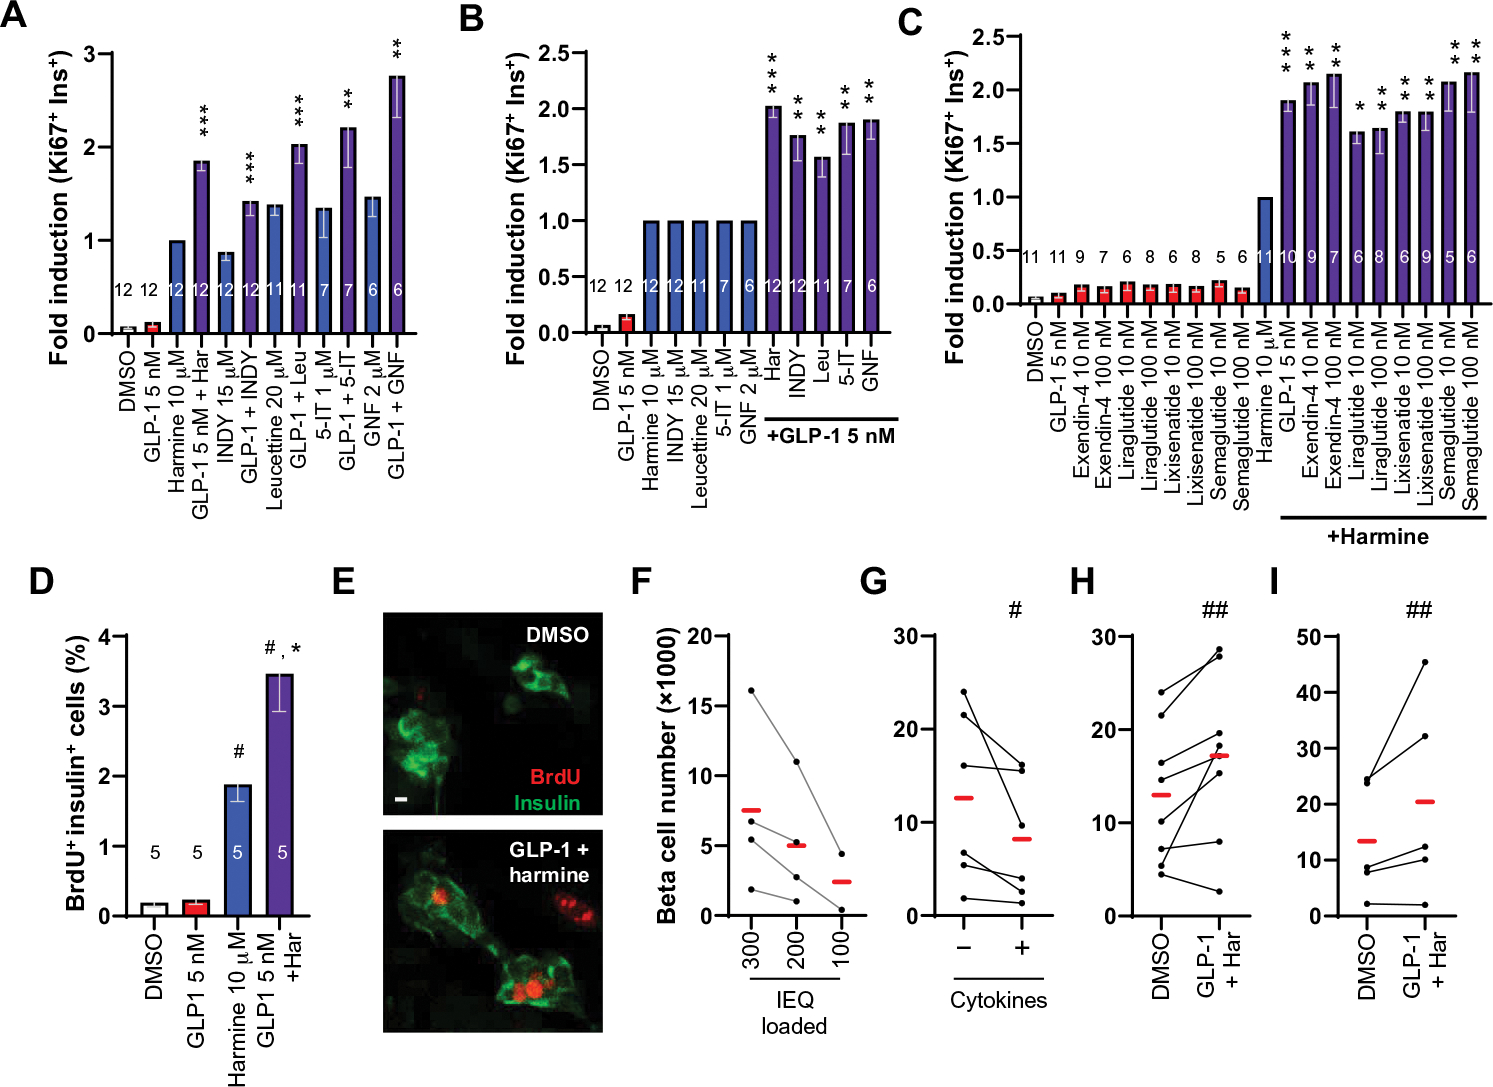
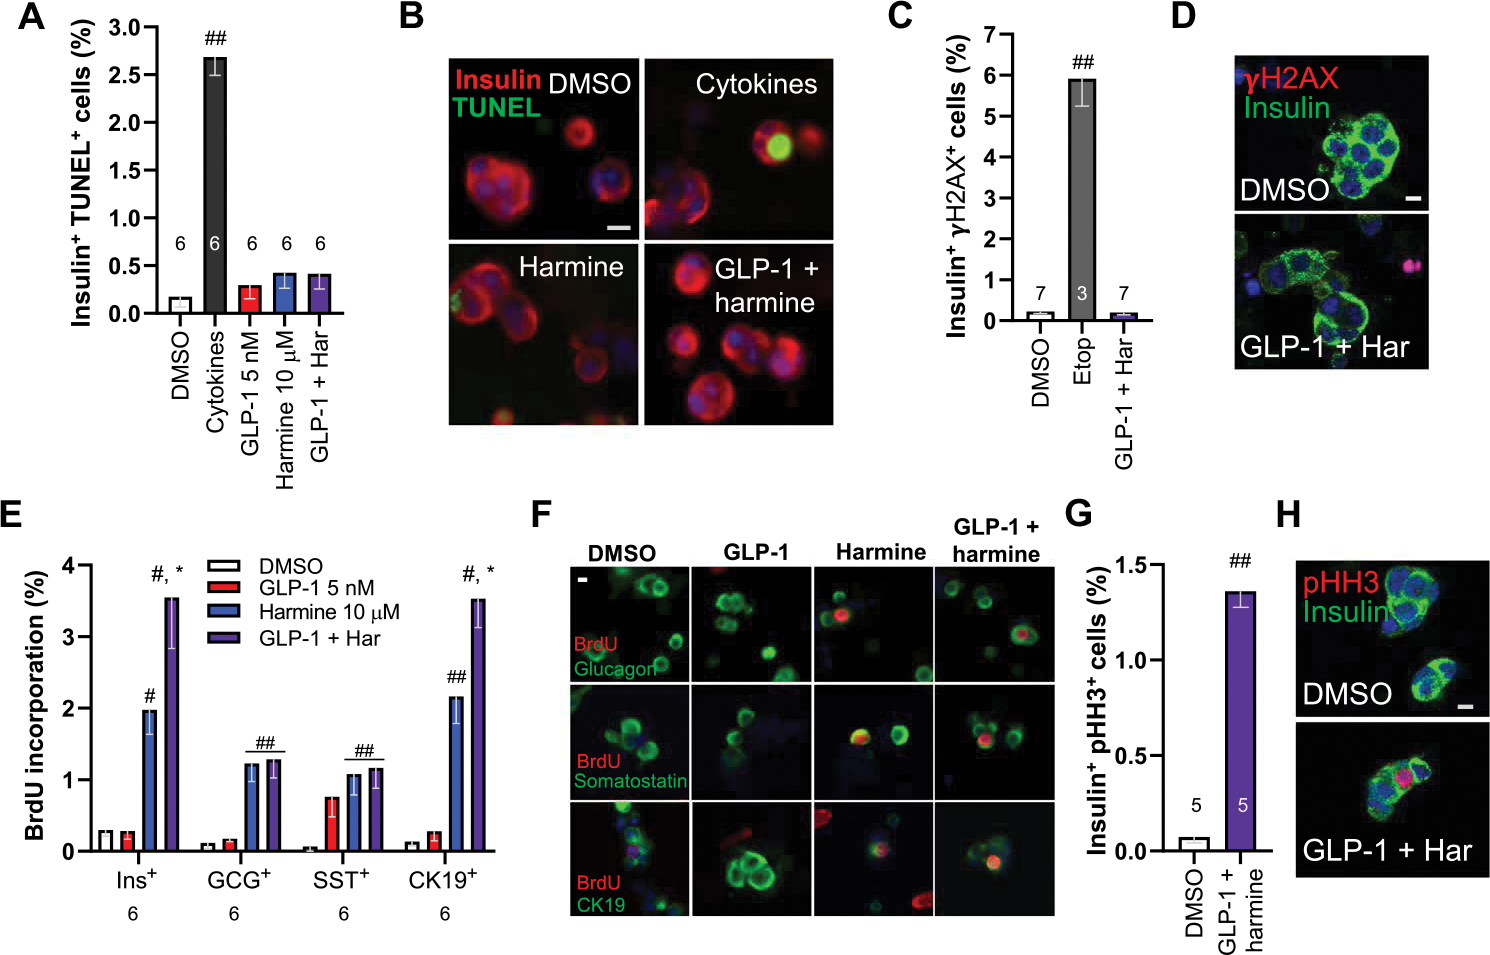
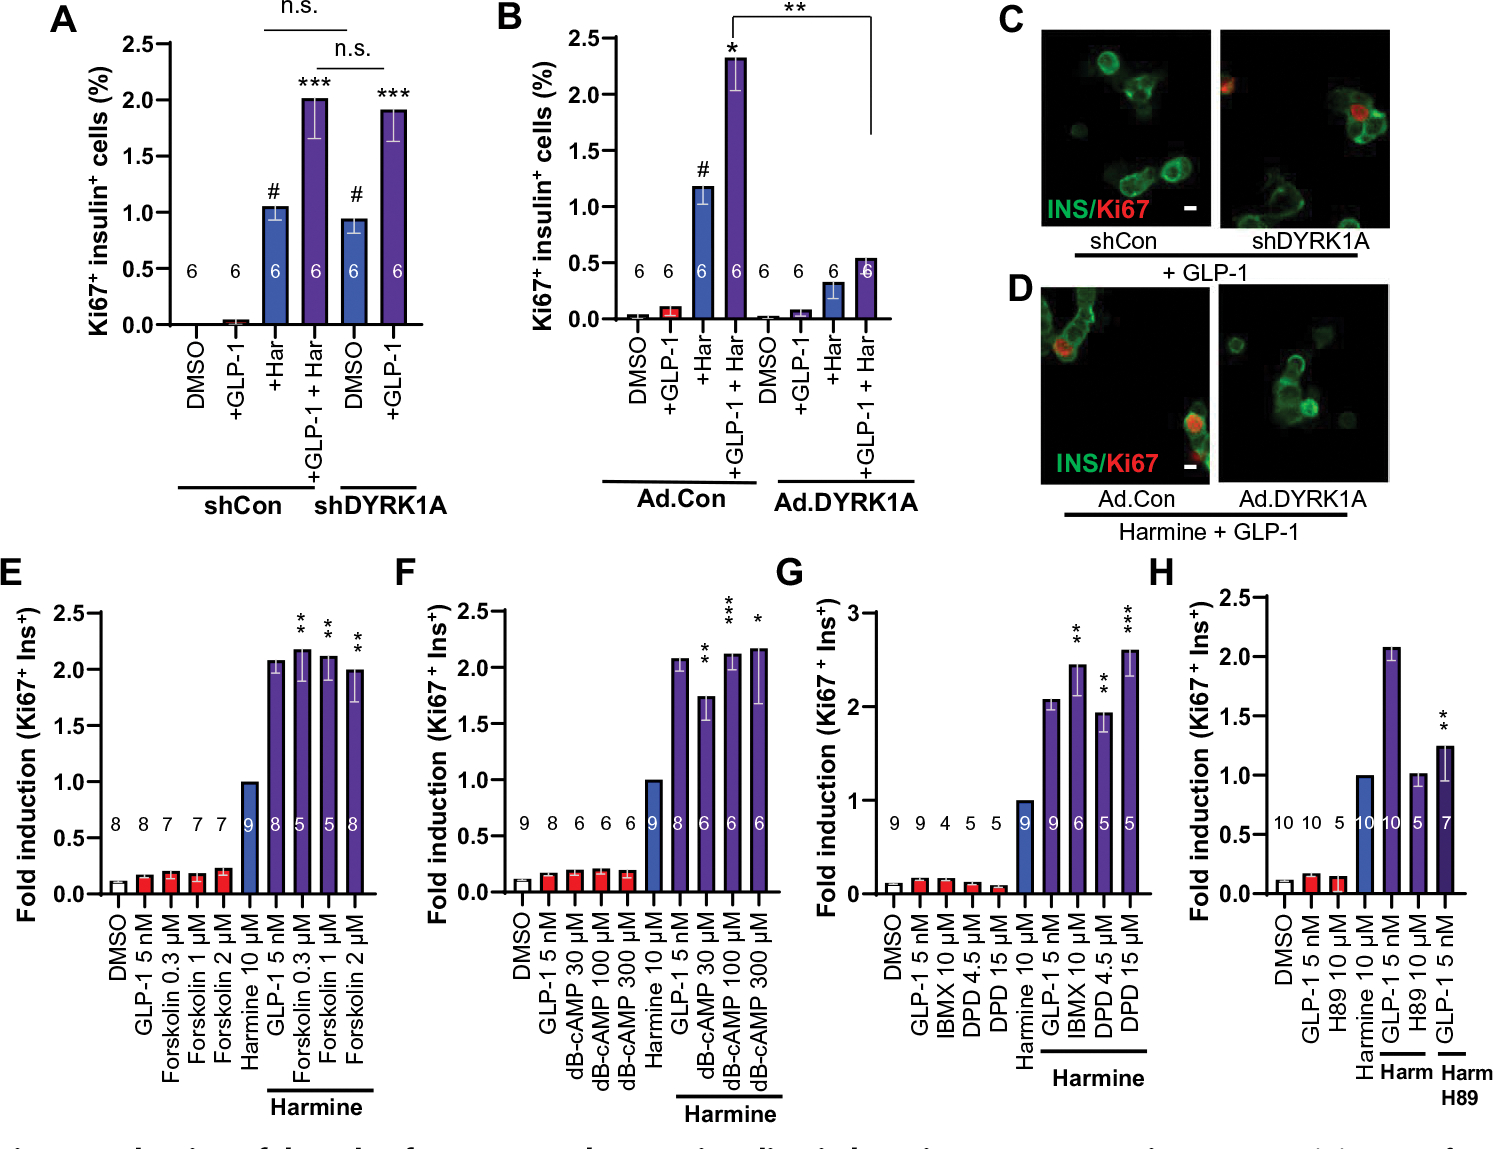
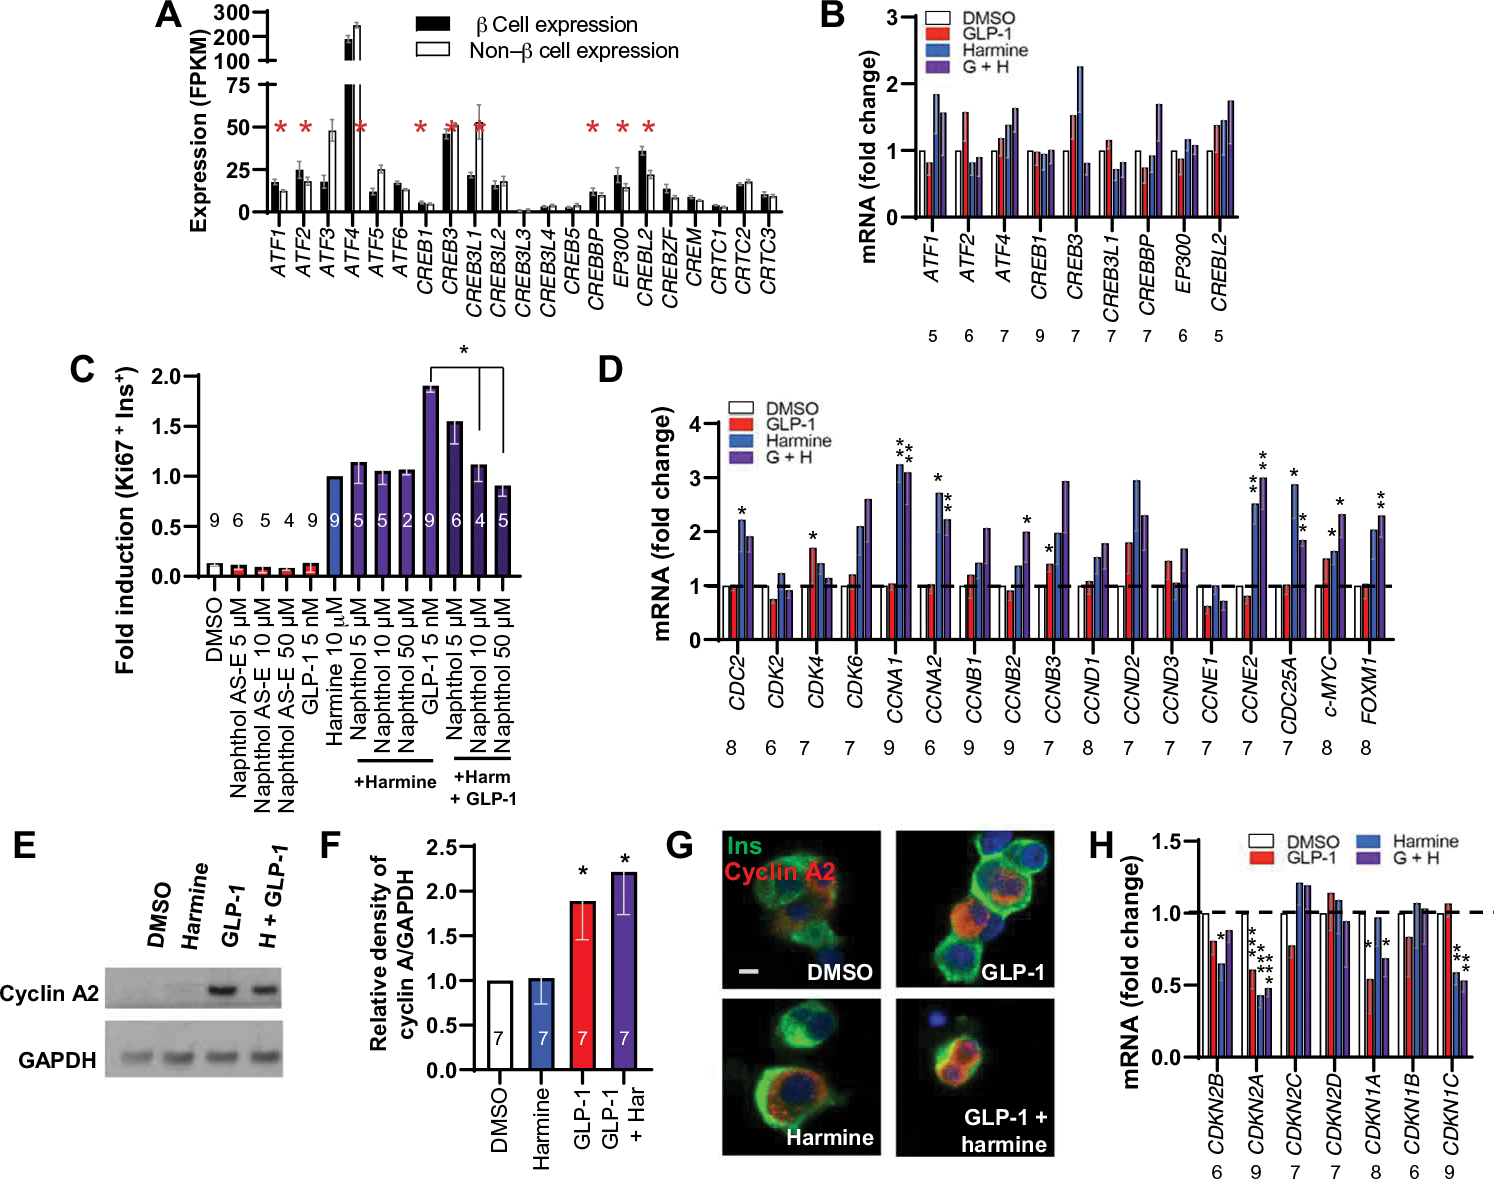
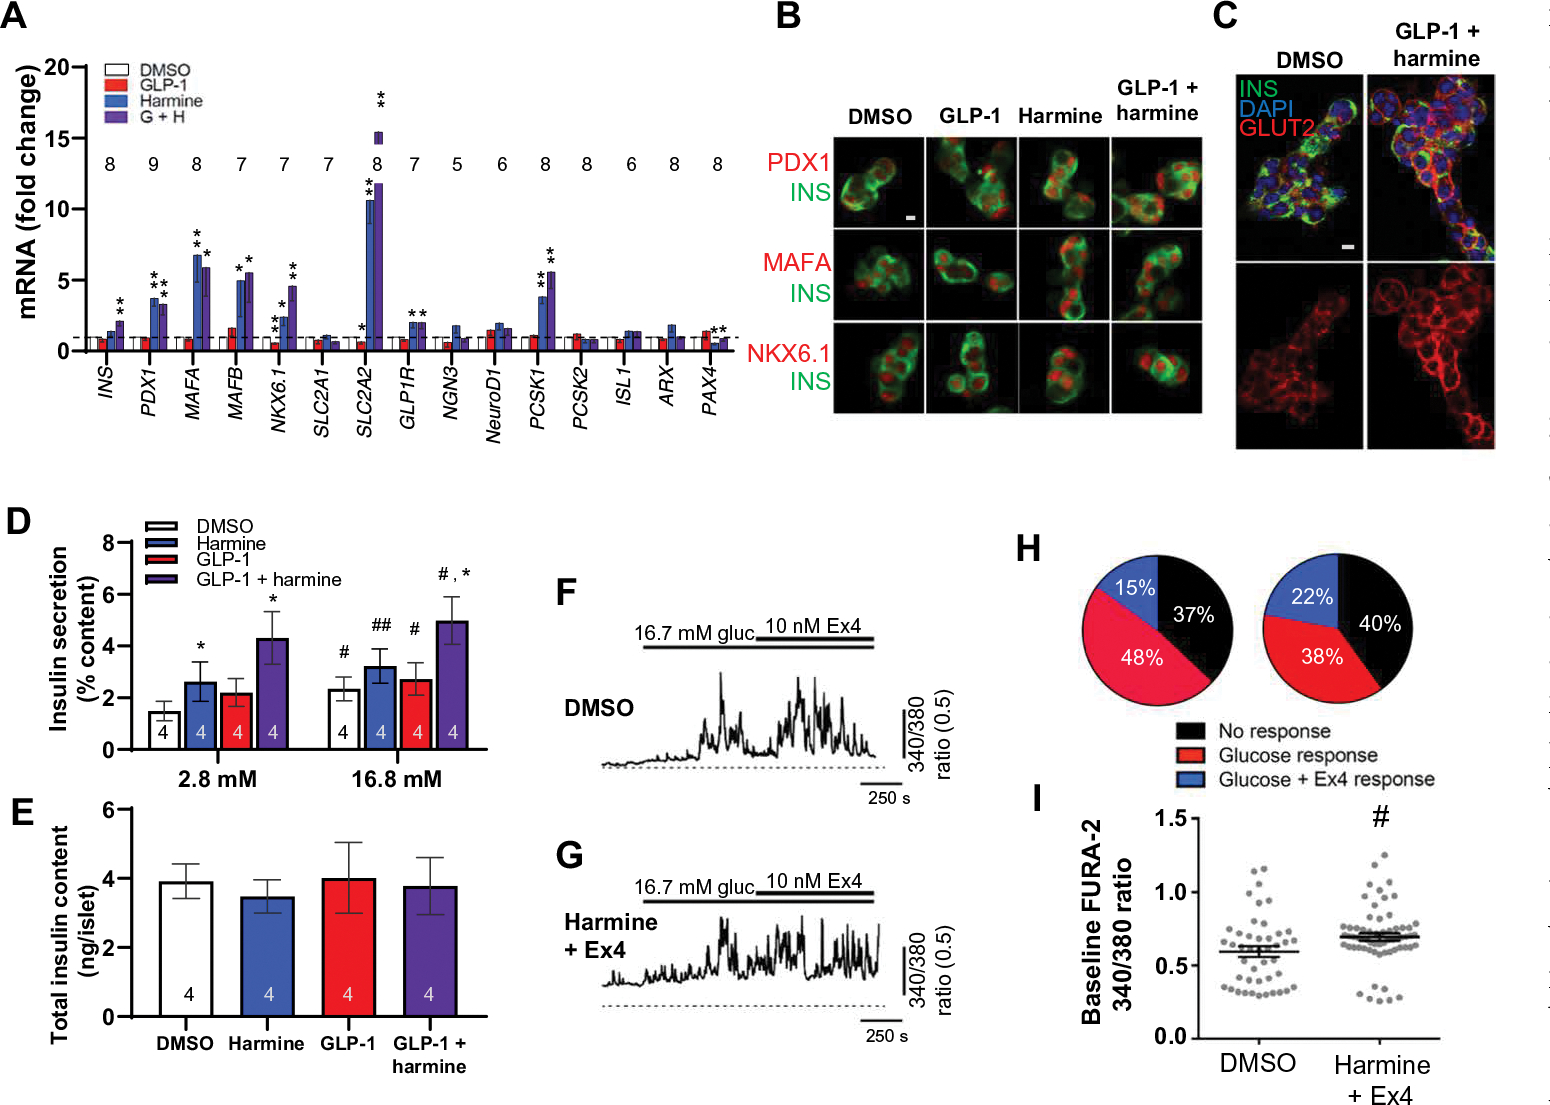
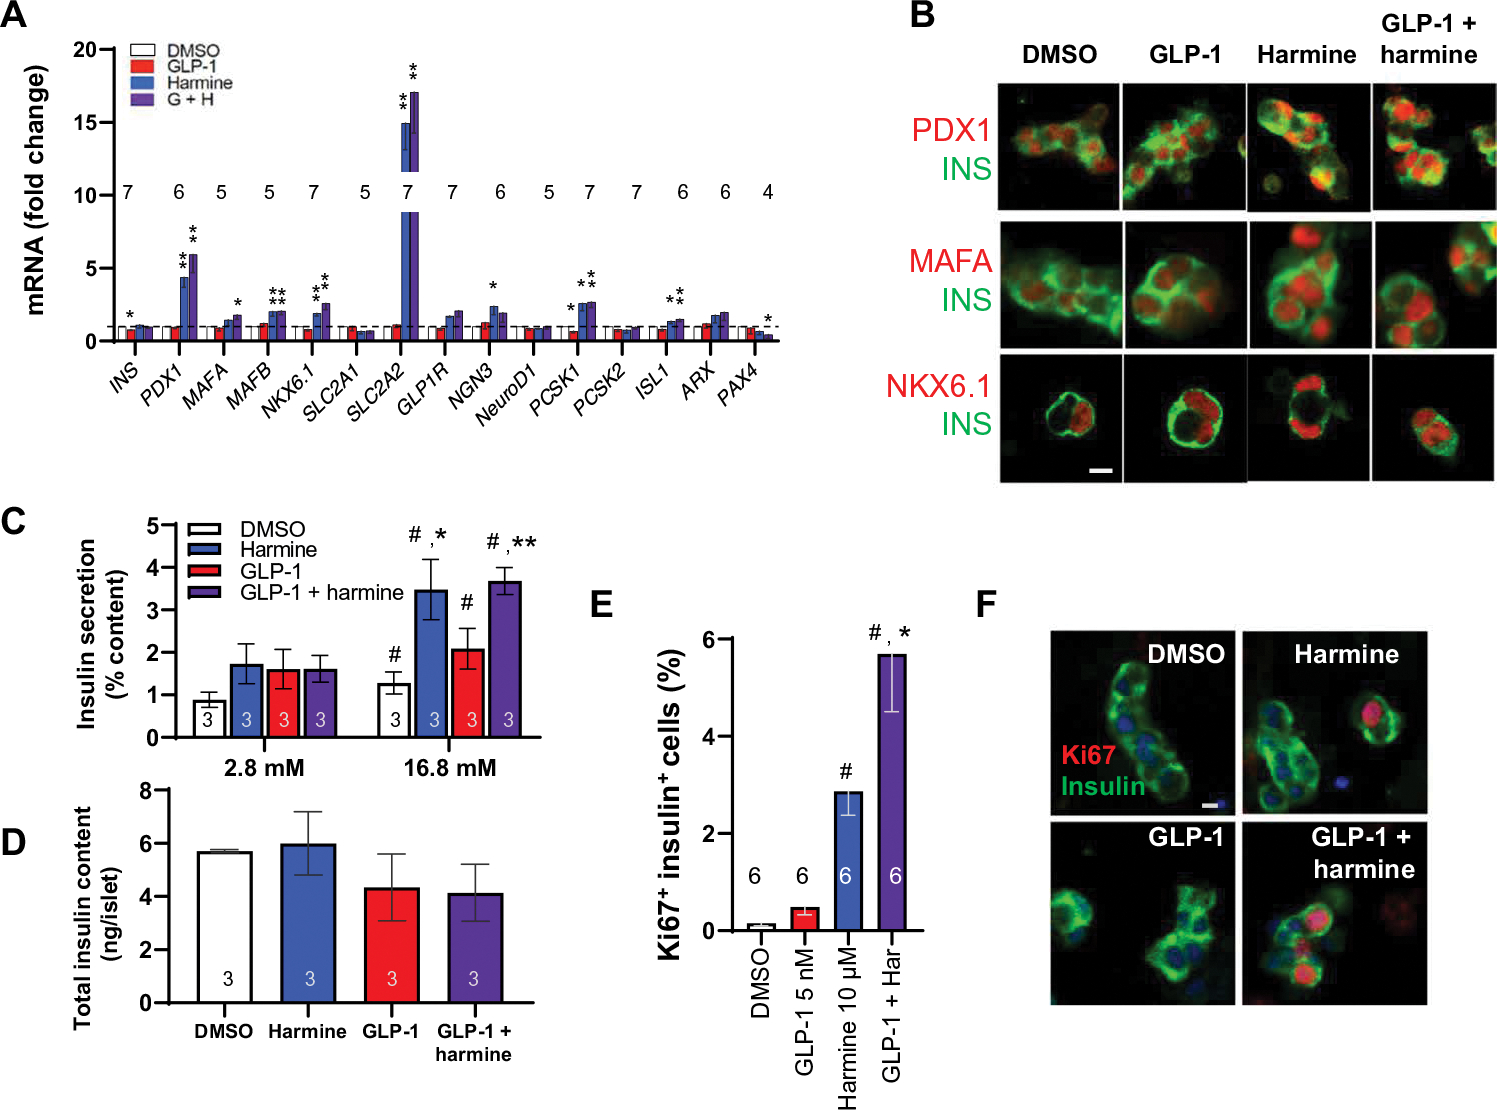
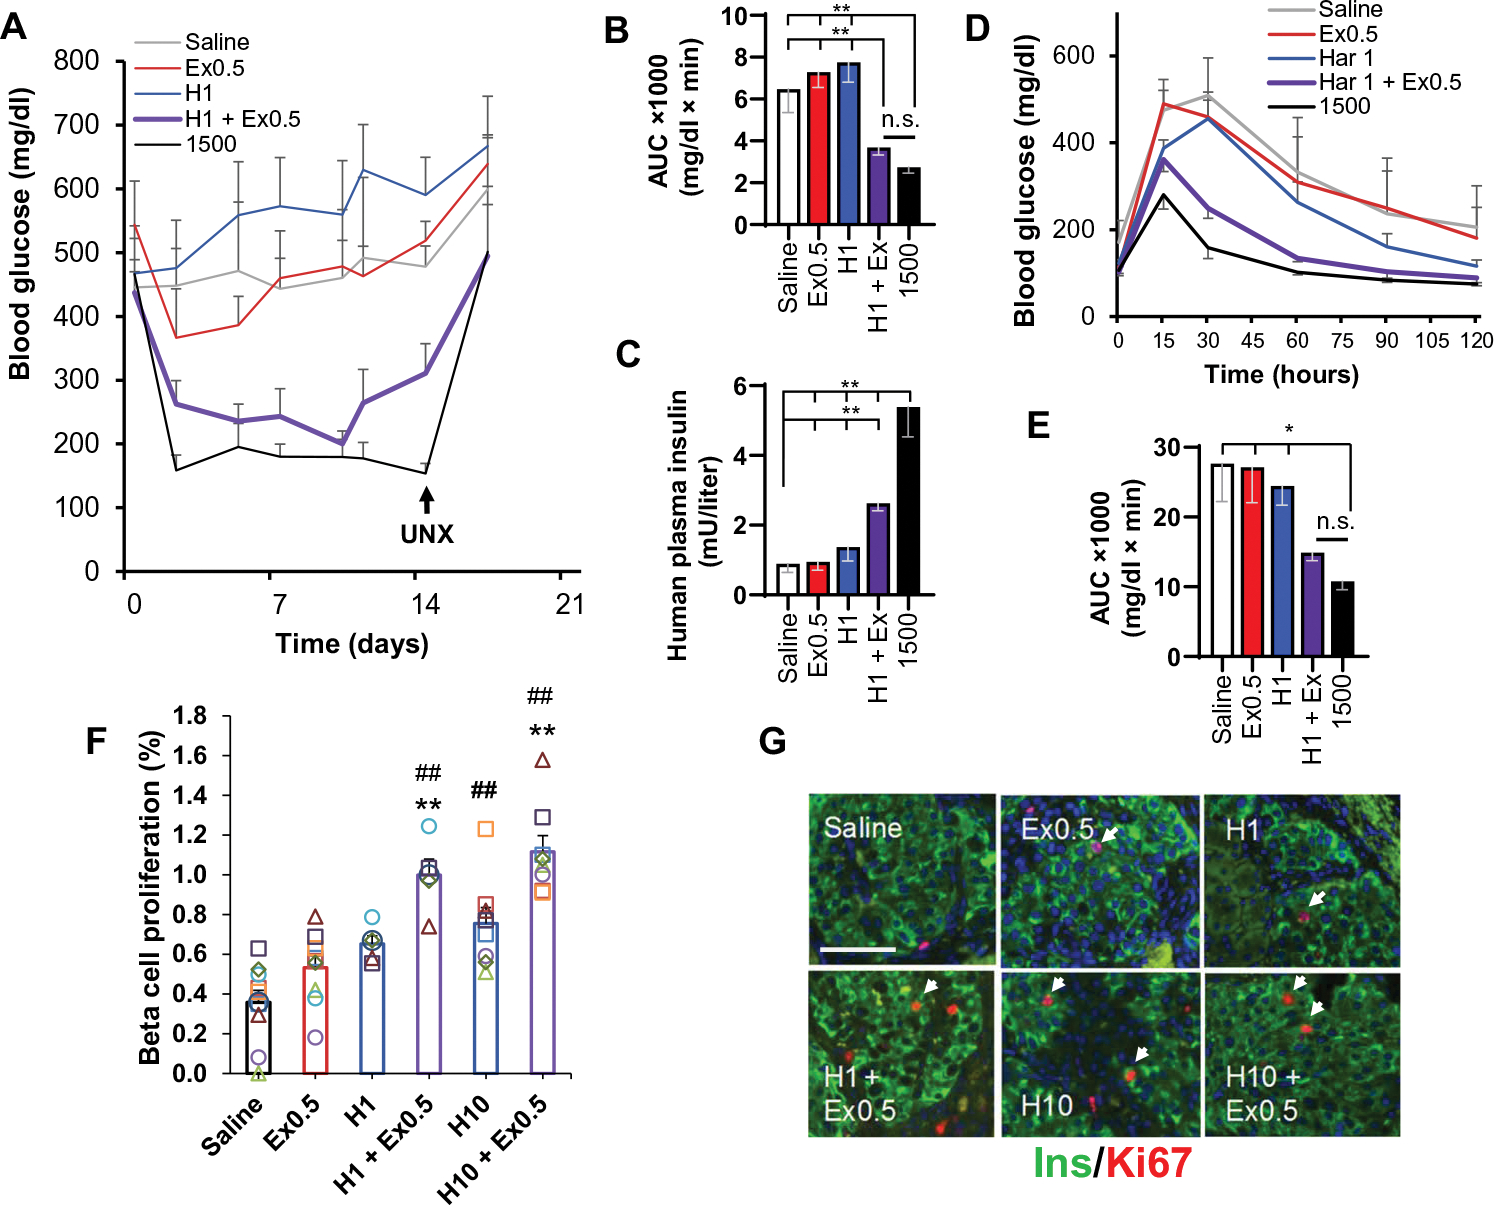
Glucagon-like peptide-1 receptor (GLP1R) agonists and dipeptidyl peptidase 4 inhibitors are widely prescribed diabetes drugs due to their ability to stimulate insulin secretion from remaining β cells and to reduce caloric intake. Unfortunately, they fail to increase human β cell proliferation. Small-molecule inhibitors of dual-specificity tyrosine-regulated kinase 1A (DYRK1A) are able to induce adult human β cell proliferation, but rates are modest (~2%), and their specificity to β cells is limited. Here, we provide evidence that combining any member of the GLP1R agonist class with any member of the DYRK1A inhibitor class induces a synergistic increase in human β cell replication (5 to 6%) accompanied by an actual increase in numbers of human β cells. GLP1R agonist-DYRK1A inhibitor synergy required combined inhibition of DYRK1A and an increase in cAMP and did not lead to β cell dedifferentiation. These beneficial effects on proliferation were seen in both normal human β cells and β cells derived from individuals with type 2 diabetes. The ability of the GLP1R agonist-DYRK1A inhibitor combination to enhance human β cell proliferation, human insulin secretion, and blood glucose control extended in vivo to studies of human islets transplanted into euglycemic and streptozotocin-diabetic immunodeficient mice. No adverse events were observed in the mouse studies during a 1-week period. Because of the relative β cell specificity of GLP1R agonists, the combination provides an improved, although not complete, degree of human β cell specificity.


Conflict of interest statement

Competing interests: The Icahn School of Medicine at Mount Sinai has filed a patent application on this work (WO 2019/136320; Method of increasing proliferation of pancreatic β cells, treatment method, and composition). B.T. is a consultant for SUN Pharma Ltd.

Figures

Fig. 1.
Fig. 1.. Combination of DYRK1A inhibitors with GLP1R agonists yields synergistic increases in human β cell proliferation.
(A) Dispersed human islet cells from pancreas donors (n = 20) were treated for 96 hours with the drugs and doses indicated and immunolabeled for Ki67 and insulin. DMSO (dimethyl sulfoxide), control vehicle at 0.1%. Each colored line represents an islet preparation from one donor. Red solid bars indicate the means for each treatment condition in the 20 donors. Har, harmine. (B) An example of insulin-Ki67 coimmunolabeling on dispersed human islets under the treatment conditions indicated. Arrows illustrate Ki67+ β cells. Scale bar, 10 μm. (C) Bar graph of the 20 single-dose human islet experiments shown in (A), together with a broad range of additional doses of GLP-1 and the maximally effective mitogenic dose of harmine (10 μM). The large error bars reflect the intrinsic variability among human islet preparations shown in (A). (D) The same data (C) shown as fold difference with respect to induction by 10 μM harmine, expressed as “1.0” to adjust for the intrinsic variability in each human islet preparation. The 1.0 value for harmine reflects an actual Ki67 labeling value of 2.5%. (E and F) Comparison of 3 and 1 μM harmine to 10 μM harmine alone or in combination with a range of GLP-1 doses. Bars indicate means ± SEM. Numbers within bars indicate the number of human islet preparations studied at each dose. A minimum of 3000 β cells was counted for each bar. One-way ANOVA, #P < 0.05 versus control; *P < 0.05, **P < 0.01, and ***P < 0.001 versus harmine alone.
Fig. 2.
Fig. 2.. The DYRK1A–GLP-1 increase in human β cell numbers is a class effect for both DYRK1A inhibitors and GLP1R agonists.
(A) The effects on human β cell on Ki67 labeling of harmine, INDY, leucettine-41 (leucettine or Leu), 5-iodotubericidin (5-IT), and GNF4877 (GNF) administered alone (blue bars) or in combination with 5 nM GLP-1 (purple bars). Results are normalized to 10 μM harmine. Ki67 percentage values were as follows: harmine, 2.1%; INDY, 1.7%; leucettine, 2.8%; 5-IT, 2.6%; GNF4877, 2.9%. (B) The same data in (A), but with each of the DYRK1A inhibitors normalized to 1.0. (C) Ki67 labeling in β cells after treatment of human islets with 10 μM harmine and a broad range of commercially available GLP-1 analogs. (D) Induction of BrdU immunolabeling in human β cells treated with harmine and GLP-1. (E) An example of BrdU incorporation in D. Scale bar, 10 μm. (F and G) Negative controls for quantification of human β cell numbers by flow cytometry in progressively lower numbers of human islets from four different donors and in response to cytokines (1000 IU/ml each, TNFα and IL-1β) in six pairs of different human islets. (H) Increases in human β cell numbers in islets from seven of eight human donors in response to 4 days of ex vivo treatment with harmine (10 μM)– GLP-1 (5 nM) or vehicle (0.1% DMSO). (I) Increases in GFP-labeled hESC-derived β-like cells in response to 7 days of combined harmine–GLP-1 treatment. Bars indicate means ± SEM. Numbers within the bars show the number of human islet preparations studied at each dose. A minimum of 3000 β cells was counted for each bar. One-way ANOVA, *P < 0.05, **P < 0.01, and ***P < 0.001 versus harmine alone; #P < 0.001 and ##P < 0.01 versus control. IEQ, islet equivalent.
Fig. 3.
Fig. 3.. The effects of harmine–GLP-1 on proliferation in non–β cells, β cell death, and DNA damage.
(A) The effects of harmine–GLP-1 on cell death as assessed by TUNEL assay. The cytokine cocktail in the second bar is a positive control containing TNFα and IL-1β. The numbers of islet donors are indicated within the bars. Examples of TUNEL responses under the conditions shown in (B). A minimum of 3000 β cells were counted for each bar. (C) DNA damage as assessed by γH2AX immunocytochemistry in response to harmine (10 μM) and GLP-1 (5 nM) or positive control etoposide (Etop) (20 μM). A minimum of 3000 β cells were counted for each bar. (D) An example of γH2AX immunocytochemistry. (E) Proliferation as assessed using BrdU labeling in β (INS+ ), α (GCG+ ), δ (SST+ ), and ductal (CK19+ ) cells in response to the treatments shown in the inset. Numbers of cells counted for each bar ranged from 2820 to 4060 for β cells, 2935 to 3575 for α cells, 1050 to 1220 for δ cells, and 2040 to 2315 for CK19+ cells. (F) Examples of BrdU immunolabeling in human islet cell subtypes in response to the agents shown. (G) Immunolabeling of dispersed human β cells for pHH3 and insulin. (H) An example of pHH3-insulin colabeling in dispersed human β cells. All bars indicate means ± SEM. Numbers above or below the bars indicate the sample size of human islet donors. #P < 0.01 and ##P < 0.001 versus control by two-tailed paired t test. *P < 0.01 versus harmine alone by paired t test. Scale bars, 10 μm (B, D, F, and H)
Fig. 4.
Fig. 4.. Evaluation of the role of DYRK1A and cAMP signaling in harmine–GLP1R agonist synergy.
(A) Quantification of Ki67-insulin coimmunolabeling in human islets in response to adenoviral silencing of DYRK1A or harmine (10 μM) and GLP-1 (5 nM). Silencing DYRK1A can replace the effects of harmine in the presence of GLP-1. (B) Quantification of the effects of Ad.DYRK1A overexpression or a control adenovirus (Ad.Con, overexpressing Cre recombinase) in human islets treated with GLP-1 and harmine at various doses. (C) An example of Ki67 immunolabeling in an insulin-positive cell in response to Ad.shRNA silencing of DYRK1A (left), but not with a control, scrambled shRNA adenovirus (left). Scale bar, 10 μm. (D) An example of Ki67-insulin colabeling in β cells of human islets treated with harmine and GLP-1 at the doses in (A) (left) and the absence of proliferation in the presence of Ad.DYRK1A (right). (E to H) Effects on Ki67-insulin colabeling by control vehicle (DMSO), GLP-1, and the following compounds alone or in the presence of harmine: (E) forskolin, (F) dibutyryl-cAMP (dB-cAMP), (G) phosphodiesterase inhibitors isobutylmethylxanthine (IBMX) or dipyridamole (DPD). (H) Effect of PKA inhibitor H89 on Ki67-insulin colabeling on its own and combined with harmine (Harm) and GLP-1. All bars indicate means ± SEM. Numbers of individual human islet donors studied are shown within or above bars. Paired two-tailed t test, #P < 0.01 versus control; *P < 0.05, **P < 0.01, and ***P < 0.001 versus harmine alone. n.s., not significant (P > 0.05).
Fig. 5.
Fig. 5.. Mechanisms downstream of the GLP1R.
(A) Expression of ATF-CREB-CREM-CREBBP-EP300 family members in β cells and non–β islet cells FACS-sorted from human islets. Red asterisks indicate family members with FPKM values in excess of 15 in β cells, defining them as the most abundant. (B) qPCR of the ATF-CREB-CREM-CREBBP-EP300 family members in (A) marked by an asterisk, plus CREB1, in whole human islets in response to vehicle, GLP-1, harmine, or their combination. ATF, activating transcription factor; CREM, cAMP responsive element modulator; FPKM, fragments per kilobase of transcript per million mapped reads. (C) The effects of naphthol on basal and harmine–GLP1–stimulated human β cell proliferation. (D) Effects on expression of cell cycle activators 72 hours after exposure under the four conditions shown detected by qPCR. (E) An immunoblot of whole human islets for cyclin A protein in response to harmine, GLP-1, and harmine–GLP-1. Representative of experiments from seven islet preparations. GAPDH, glyceraldehyde-3-phosphate dehydrogenase. (F) Densitometric quantitation of seven experiments. (G) Immunocytochemistry of cyclin A protein in human β cells treated with harmine–GLP-1. Scale bar, 10 μm. (H) qPCR of the effects of vehicle (DMSO), GLP-1, harmine, or the combination on cell cycle inhibitors on the same islet samples. Bars indicate means ± SEM. Numbers within or above bars indicate the sample size of human islet donors. *P < 0.05 versus control by one-way ANOVA. Paired two-tailed t-test, *P < 0.05, **P < 0.01, and ***P < 0.001 for harmine versus control.
Fig. 6.
Fig. 6.. Harmine–GLP-1 treatment maintains or enhances human β cell differentiation.
(A) The effects of control vehicle (DMSO, 0.1%), 5 nM GLP-1, 10 μM harmine, or combination harmine–GLP-1 on markers of β cell differentiation as assessed using qPCR on intact islets. *P < 0.05 and **P < 0.01 versus control by paired two-tailed t test. (B) Confocal imaging examples of immunolabeling of β cells for PDX1, MAFA, and NKX6.1 from (A). Representative of experiments in four human islet preparations. (C) Confocal imaging of GLUT2 and insulin immunocytochemistry and 4′,6-diamidino-2-phenylindole (DAPI) nuclear labeling under basal conditions and in response to harmine–GLP-1 in dispersed human islets. Top panels are merged images, and bottom images are expanded and show GLUT2 only. A larger image is shown in fig. S9. (D) Insulin secretion from human islets from four donors in response to low (2.8 mM) and high (16.8 mM) glucose after 72-hour treatment with vehicle, GLP-1 (5 nM), harmine (10 μM), or the combination. Data are shown as percent of residual insulin content. The insulin concentration (means ± SEM) in the 2.8 mM glucose control (DMSO) wells was 19.9 ± 9.1 pmol per islet, and that at 16.7 mM glucose was 33.3 ± 12.6 pmol per islet. (E) Residual insulin content after glucose-stimulated insulin secretion in the islets shown in (D). (F and G) The effect of glucose (gluc) followed by exendin-4 (Ex4) on intracellular calcium as assessed using FURA-2 AM in individual dispersed human β cells pretreated for 48 to 72 hours with 10 μM harmine plus 10 nM exendin-4 (n = 148 cells, 3 donors) or DMSO alone (n = 82 cells, 3 donors). (H) Proportions of single cells either unresponsive to stimuli (black) or responsive to glucose alone (red), or responsive to glucose and exendin-4 together (blue). (I) FURA-2 AM ratio, indicative of basal calcium; harmine plus exendin-4 (n = 63 cells, three donors) had a small but statistically significant (P < 0.05) effect compared with DMSO alone (n = 44 cells, three donors). Bars indicate means ± SEM. Numbers within or above bars indicate the sample size of human islet donors. (D to I) #P < 0.05 and ##P < 0.003 versus control by one-way ANOVA. *P < 0.05 versus harmine alone by one-way ANOVA. Scale bars, 10 μm (B and C).
Fig. 7.
Fig. 7.. Effects of harmine–GLP-1 on β cells from individuals with T2D.
(A) The effects of harmine with or without GLP-1 on β cell differentiation markers. *P < 0.05 and **P < 0.01 versus control by paired two-tailed t test. (B) Confocal imaging examples of PDX1, MAFA, and NKX6.1 immunolabeling of dispersed human T2D islets after the treatments shown. (C) Insulin secretion in response to low (2.8 mM) and high (16.8 mM) glucose in three different T2D islet preparations pretreated with vehicle, GLP-1, harmine, or their combination for 72 hours. (D) Residual insulin content in the islets from (C). The average insulin concentration in the 2.8 mM glucose control (DMSO) wells was 18.1 ± 3.2 pmol per islet, and that at 16.7 mM glucose was 32.2 ± 4.6 pmol per islet. (E) Human T2D β cell proliferation in response to vehicle, GLP-1, harmine, or the combination. (F) Examples of insulin and Ki67 immunolabeling in β cells derived from donors with T2D. Values are means ± SEM. Numbers within or above bars indicate the sample size of human islet donors. (C to E) #P < 0.05 versus control; *P < 0.05 and **P < 0.01 versus harmine alone, both by one-way ANOVA. Scale bars, 10 μm (B and F).
Fig. 8.
Fig. 8.. Effects of the harmine–exendin-4 combination on human β cells in vivo in immunodeficient mice.
(A) Glucose control in response to harmine and GLP-1 in the STZ-diabetic NSG mouse marginal islet mass model. Five groups of n = 7 mice each received human islets from the same seven human islet donors: four groups received 500 IEQs, and the fifth group received 1500 IEQs as a positive control without drug treatment. The 500 IEQ groups were treated daily for 2 weeks with intraperitoneal saline, harmine (H; 1 mg/kg), exendin-4 (Ex; 0.5 μg/kg), or the combination. The 1500 IEQ group received saline. Unilateral nephrectomy (UNX) was performed at day 12. (B) Area under the curve (AUC) for the five groups in (A). (C) Circulating insulin measured using a human insulin-specific assay. (D) Intraperitoneal glucose-tolerance tests on day 12. (E) Area under the curve for (D). (F) Human β cell proliferation assessed by Ki67-insulin coimmunolabeling in human islet renal capsular grafts from euglycemic NSG mice. All animals received 500 IEQs and were treated once daily for 7 days with intraperitoneal saline, exendin-4 (0.5 μg/kg), harmine (1 mg/kg), both exendin-4 (0.5 μg/kg) and harmine (1 mg/kg), harmine (10 mg/kg), or both exendin-4 (0.5 μg/kg) and harmine (10 mg/kg). Each symbol represents a single human islet donor in a single mouse. (G) Examples of insulin and Ki67 immunohistochemistry in islet grafts. Arrowheads show examples of cells considered positive for both insulin and Ki67. Scale bar, 100 μm. Values are means ± SEM. (B to E) *P < 0.05 and **P < 0.01 versus without or harmine-exendin treatment as indicated, by one-way ANOVA. (F) ##P < 0.01 versus control and **P < 0.001 versus harmine alone, both by one-way ANOVA.

Comment in

References

    1. World Health Organization, Global Reports on Diabetes; www.who.int/diabetes/global-report/en/.
    1. Butler AE, Janson J, Bonner-Weir S, Ritzel R, Rizza RA, Butler PC, β-Cell deficit and increased β-cell apoptosis in humans with diabetes. Diabetes 52, 102–110 (2003). - PubMed
    1. Campbell-Thompson M, Fu A, Kaddis JS, Wasserfall C, Schatz DA, Pugliese A, Atkinson MA, Insulitis and β-cell mass in the natural history of type 1 diabetes. Diabetes 65, 719–731 (2016). - PMC - PubMed
    1. Drucker DJ, Mechanisms of action and therapeutic application of glucagon-like peptide-1. Cell Metab. 27, 740–756 (2018). - PubMed
    1. Guo X-H, The value of short- and long-acting glucagon-like peptide agonists in the management of type 2 diabetes mellitus: Experience with exenatide. Curr. Med. Res. Opin. 32, 67–76 (2016). - PubMed

Publication types

Substances