. 2020 Apr;19(4):716-729.
doi: 10.1074/mcp.TIR119.001906. Epub 2020 Feb 12.

A Compact Quadrupole-Orbitrap Mass Spectrometer with FAIMS Interface Improves Proteome Coverage in Short LC Gradients

Affiliations

A Compact Quadrupole-Orbitrap Mass Spectrometer with FAIMS Interface Improves Proteome Coverage in Short LC Gradients

Dorte B Bekker-Jensen et al. Mol Cell Proteomics. 2020 Apr.

Abstract

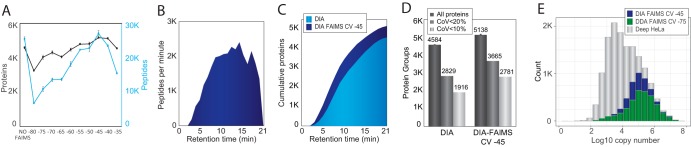
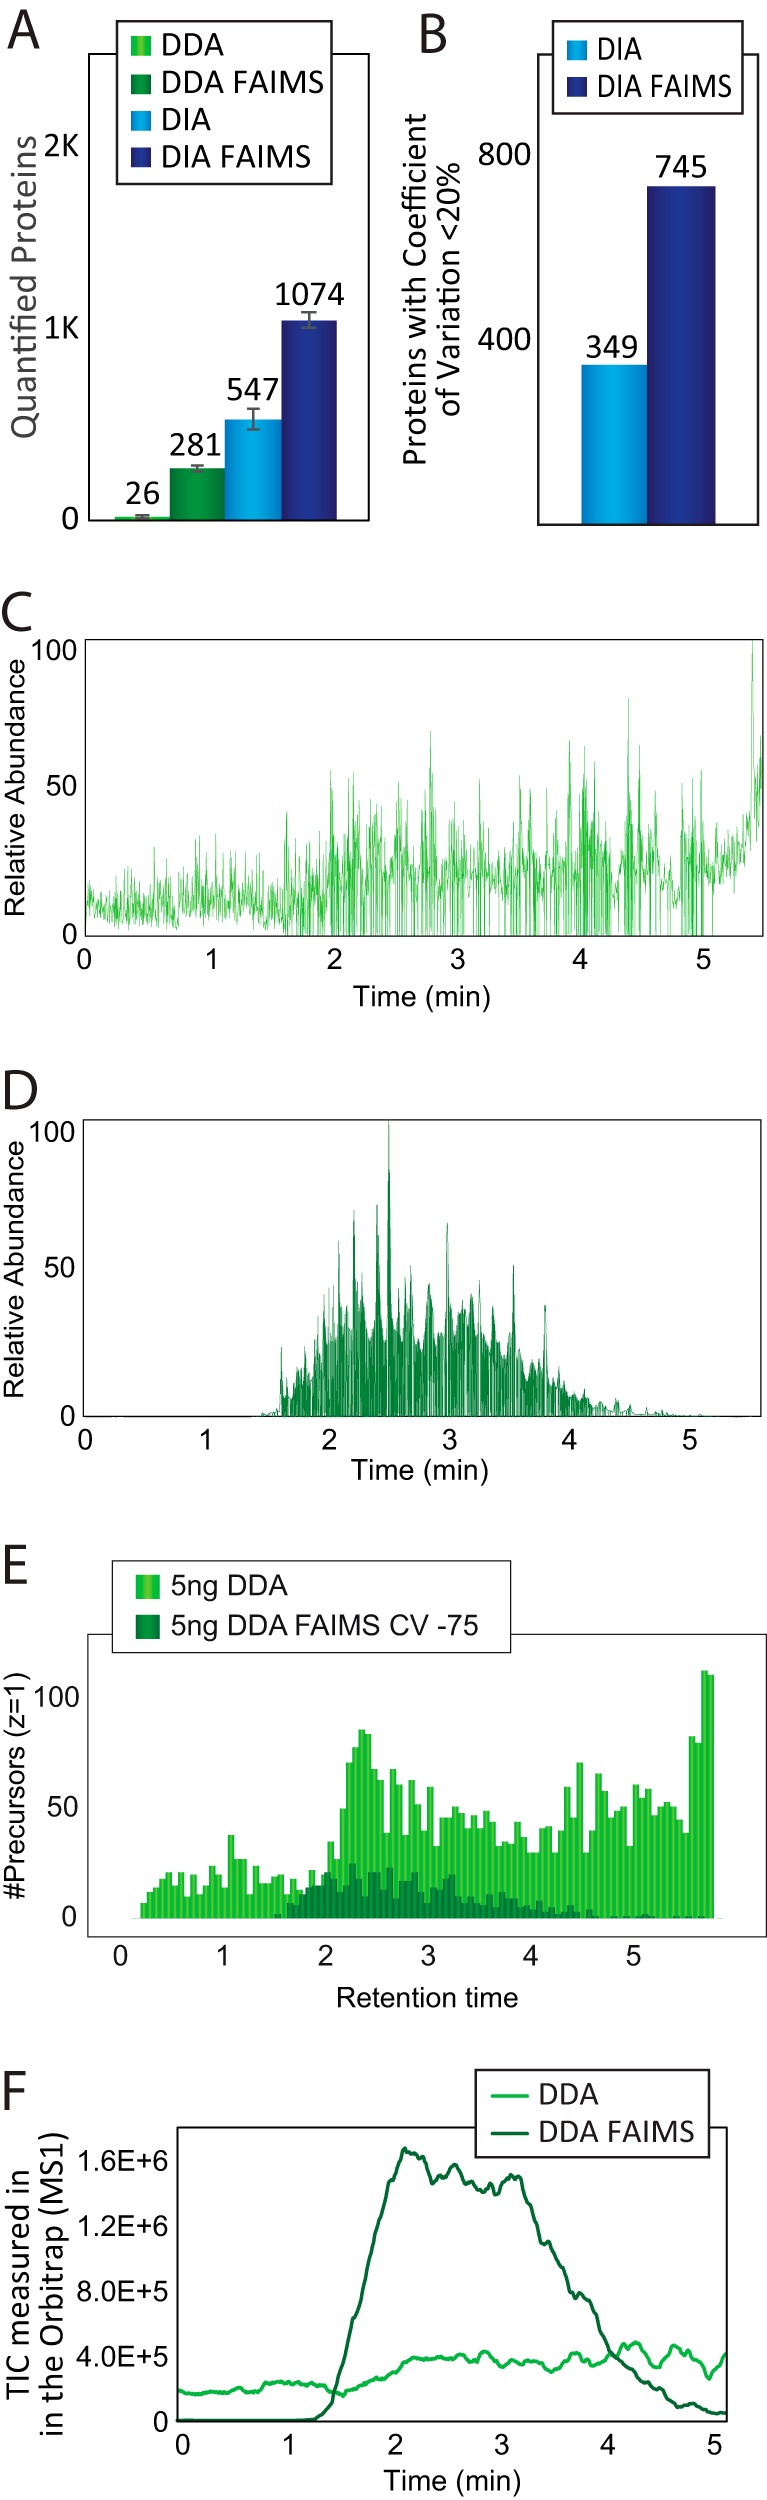
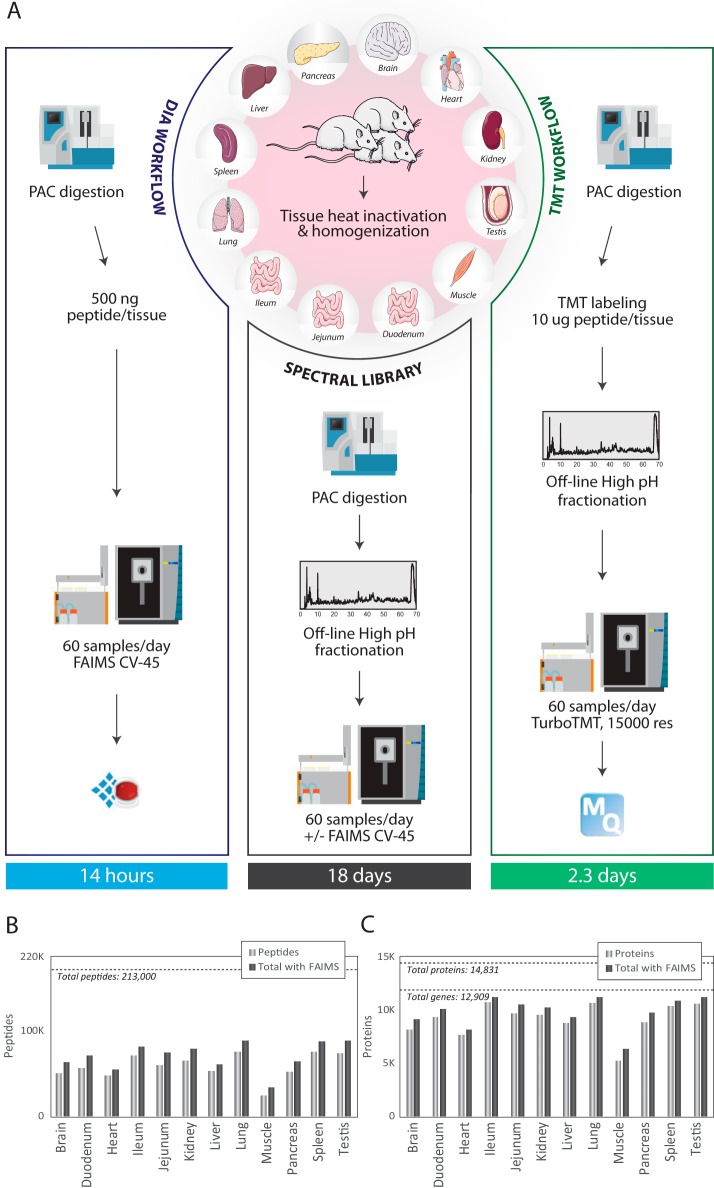
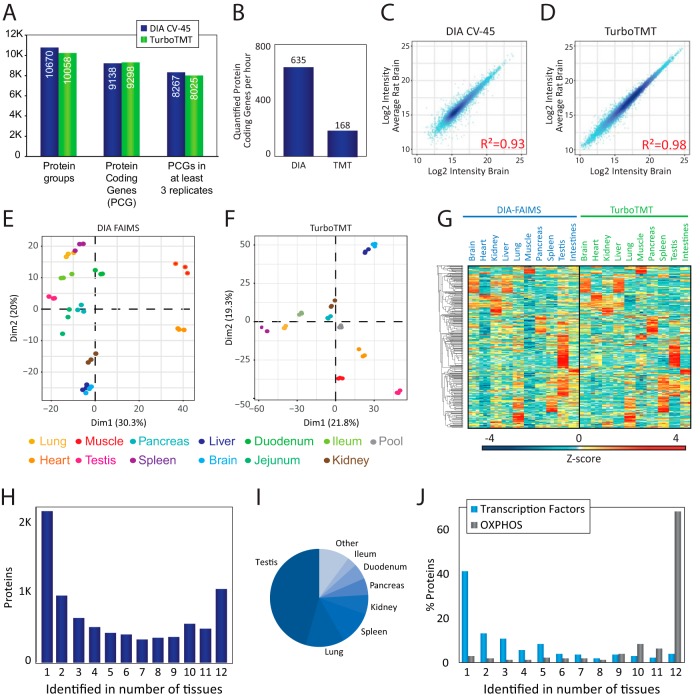
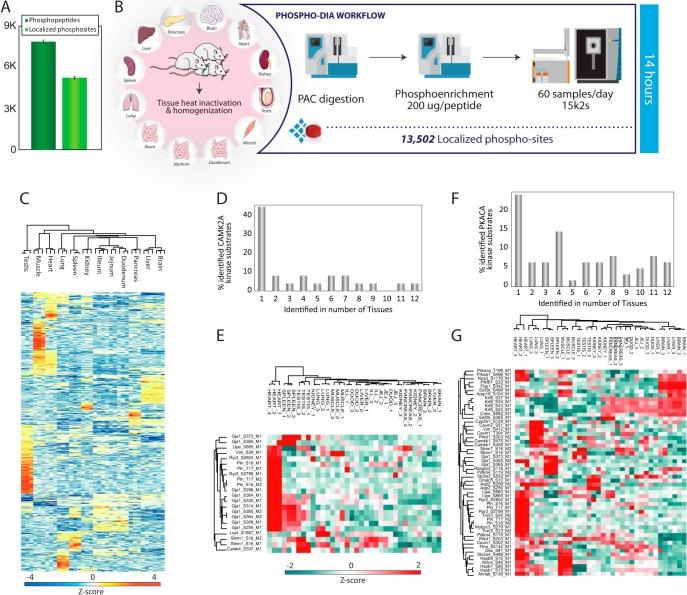
State-of-the-art proteomics-grade mass spectrometers can measure peptide precursors and their fragments with ppm mass accuracy at sequencing speeds of tens of peptides per second with attomolar sensitivity. Here we describe a compact and robust quadrupole-orbitrap mass spectrometer equipped with a front-end High Field Asymmetric Waveform Ion Mobility Spectrometry (FAIMS) Interface. The performance of the Orbitrap Exploris 480 mass spectrometer is evaluated in data-dependent acquisition (DDA) and data-independent acquisition (DIA) modes in combination with FAIMS. We demonstrate that different compensation voltages (CVs) for FAIMS are optimal for DDA and DIA, respectively. Combining DIA with FAIMS using single CVs, the instrument surpasses 2500 peptides identified per minute. This enables quantification of >5000 proteins with short online LC gradients delivered by the Evosep One LC system allowing acquisition of 60 samples per day. The raw sensitivity of the instrument is evaluated by analyzing 5 ng of a HeLa digest from which >1000 proteins were reproducibly identified with 5 min LC gradients using DIA-FAIMS. To demonstrate the versatility of the instrument, we recorded an organ-wide map of proteome expression across 12 rat tissues quantified by tandem mass tags and label-free quantification using DIA with FAIMS to a depth of >10,000 proteins.

Keywords: DDA; DIA; FAIMS; Tandem mass spectrometry; clinical proteomics; orbitrap; pathway analysis; phosphoproteome; protein identification; proteomics; transcription.


Figures

None
Graphical abstract
Fig. 1.
Fig. 1.
A, Hardware overview of the Orbitrap Exploris 480 MS instrument. B, Experimental workflow for HeLa measurements. C, Barplot depicting the number of unique peptides identified using different compensation voltages with FAIMS. The number represented is the average of two replicates. Dashed line represents the average number of peptides identified in a DDA experiment without FAIMS. D, Average number of proteins in black with and without using FAIMS with different compensation voltages. In green, number of peptides identified per protein. The plotted values are the average of at least two technical replicates. E, Histogram of the protein abundance distribution represented as copy number in log10 scale of a deep HeLa proteome (gray) overlaid with 21 min single shot analyzes with FAIMS CV of −75 V (dark green) and without FAIMS (light green). F, Number of proteins identified from 500 ng of peptide using DDA (light green) or DDA with FAIMS and optimal CV of −75 V (dark green) in different gradient lengths: 200 SPD, 100 SPD and 60 SPD.
Fig. 2.
Fig. 2.
A, In black, number of proteins quantified from 500 ng of peptide in 21 min in a DIA experiment without FAIMS and with FAIMS using different compensation voltages. In blue, number of peptides quantified in the same experiments. The plotted values are the average of at least two technical replicates. B, Visualization of peptide identification across the gradient length for DIA run with CV of −45 V with FAIMS and 500 ng load. C, Cumulative protein identifications across the gradient for DIA runs without (light blue) and with CV of −45 V with FAIMS (dark blue). D, Bar chart of all protein identifications (dark gray), proteins with coefficient of variation below 20% (gray) and below 10% (light gray) for DIA with and without CV of −45 V with FAIMS. E, Histogram of the protein abundance distribution represented as copy number in log10 scale of a deep HeLa proteome (gray), and in a single shot analysis of 21 min using DDA and optimal CV of −75 V with FAIMS (dark green) or using DIA and optimal CV of −45 V with FAIMS (blue).
Fig. 3.
Fig. 3.
A, Bar chart showing the number of proteins identified in 5 min gradients (200 samples per day) using 5 ng load. Light green bars correspond to DDA acquisition settings, dark green bars correspond to DDA with optimal CV with FAIMS, light blue bars correspond to DIA acquisition and dark blue bars correspond to DIA using FAIMS. Plotted values are the average between at least three replicates. B, Bar chart showing the number of proteins quantified with a coefficient of variation below 20% in DIA experiments with FAIMS (dark blue) or without FAIMS (light blue). C, Chromatogram of a DDA run from 5 ng using a 5 min gradient showing the relative abundance of the total ion current signal. D, Chromatogram of a DDA run with FAIMS (CV −75) from 5 ng using a 5 min gradient showing the relative abundance of the total ion current signal. E, Histogram showing the abundance distribution of precursors with charge +1 during a 5 min gradient using a sample loading of 5 ng in a DDA run (light green) or a DDA with FAIMS at CV −75 (dark green). F, Plot of the TIC measured in the Orbitrap analyzer in MS1 scans across time in a 5 min gradient using a sample loading of 5 ng in a DDA run (light green) or a DDA with FAIMS at CV-75 (dark green).
Fig. 4.
Fig. 4.
A, Experimental workflow of the rat tissue atlas. B, Bar chart showing the number of peptides quantified in each single tissue library (light gray bar) and the gain in peptides after merging two libraries for the same tissue, one acquired without FAIMS and one acquired with FAIMS at CV-45 (dark gray). Dashed line indicates the total number of peptides identified in the complete library generated from the 12 tissues acquired with and without FAIMS. C, Bar chart showing the number of protein groups quantified in each single tissue library (light gray bar) and the gain in peptides after merging two libraries for the same tissue, one acquired without FAIMS and one acquired with FAIMS at CV-45 (dark gray). Dashed lines indicate the total number of protein groups and protein coding genes quantified in the complete library generated from the 12 tissues acquired with and without FAIMS.
Fig. 5.
Fig. 5.
A, Bar chart showing the number of protein groups, protein coding genes (PCGs) identified and PCGs quantified in three replicates of the same tissue using DIA and FAIMS (dark blue) or turboTMT (green). B, Number of PCGs per hour quantified in the DIA-FAIMS and turboTMT experiments. C, Correlation plot of the log2 intensity of each protein quantified in each rat brain against the average of the other two replicates from the same tissue in DIA-FAIMS. Correlation is measured as R-squared. D, Correlation plot of the log2 intensity of each protein quantified in each rat brain against the average of the other two replicates from the same tissue in turbo-TMT. Correlation is measured as R-squared. E, Principal Component Analysis (PCA) showing the classification of the 12 tissues from the three rats analyzed in the DIA-FAIMS experiment. F, Principal Component Analysis (PCA) showing the classification of the 10 tissues and the pooled sample from the three rats analyzed in the turbo-TMT experiment. G, Hierarchical clustering of the intensity (plotted as z-score) of the proteins identified in DIA-FAIMS and turbo-TMT experiments. H, Bar chart describing the number of specific proteins identified across tissues, where 1 indicates that the protein has only been identified in three replicates of the same tissue and 12 indicates that it has been quantified in all tissues. I, Pie chart showing the tissue-specificity of proteins identified in only one tissue. J, Bar chart depicting the percentage of proteins, either transcription factors (blue) or enzymes from the Oxidative Phosphorylation pathway (gray), expressed in different number of tissues.
Fig. 6.
Fig. 6.
A, Number of phosphopeptides (dark green) and localized phosphosites (light green) from 200 μg of peptides enriched using Ti-IMAC-HP and analyzed with 21 min gradient. B, Phospho-DIA workflow of 12 rat tissues from 3 independent rats C, Heatmap of ANOVA regulated phosphorylation sites of the rat tissues depicted as z-score. D, Bar plot showing the percentage of known CAMK2A substrates regulated in different number of tissues. E, Heatmap showing the differential regulation of phosphorylation in CAMK2A substrates across all rat tissues analyzed. F, Bar plot showing the percentage of known PKACA substrates regulated in different number of tissues. G, Heatmap showing the differential regulation of phosphorylation in PKACA substrates across all rat tissues analyzed.

References

    1. Kim M. S., Pinto S. M., Getnet D., Nirujogi R. S., Manda S. S., Chaerkady R., Madugundu A. K., Kelkar D. S., Isserlin R., Jain S., Thomas J. K., Muthusamy B., Leal-Rojas P., Kumar P., Sahasrabuddhe N. A., Balakrishnan L., Advani J., George B., Renuse S., Selvan L. D., Patil A. H., Nanjappa V., Radhakrishnan A., Prasad S., Subbannayya T., Raju R., Kumar M., Sreenivasamurthy S. K., Marimuthu A., Sathe G. J., Chavan S., Datta K. K., Subbannayya Y., Sahu A., Yelamanchi S. D., Jayaram S., Rajagopalan P., Sharma J., Murthy K. R., Syed N., Goel R., Khan A. A., Ahmad S., Dey G., Mudgal K., Chatterjee A., Huang T. C., Zhong J., Wu X., Shaw P. G., Freed D., Zahari M. S., Mukherjee K. K., Shankar S., Mahadevan A., Lam H., Mitchell C. J., Shankar S. K., Satishchandra P., Schroeder J. T., Sirdeshmukh R., Maitra A., Leach S. D., Drake C. G., Halushka M. K., Prasad T. S., Hruban R. H., Kerr C. L., Bader G. D., Iacobuzio-Donahue C. A., Gowda H., and Pandey A. (2014) A Draft Map of the human proteome. Nature 509, 575–581 - PMC - PubMed
    1. Wilhelm M., Schlegl J., Hahne H., Gholami A. M., Lieberenz M., Savitski M. M., Ziegler E., Butzmann L., Gessulat S., Marx H., Mathieson T., Lemeer S., Schnatbaum K., Reimer U., Wenschuh H., Mollenhauer M., Slotta-Huspenina J., Boese J. H., Bantscheff M., Gerstmair A., Faerber F., and Kuster B. (2014) Mass-spectrometry-based draft of the human proteome. Nature 509, 582–587 - PubMed
    1. Bekker-Jensen D. B., Kelstrup C. D., Batth T. S., Larsen S. C., Haldrup C., Bramsen J. B., Sørensen K. D., Høyer S., Ørntoft T. F.; Andersen C. L., et al. (2017) An optimized shotgun strategy for the rapid generation of comprehensive human proteomes. Cell Syst. 4, 587–599 - PMC - PubMed
    1. Makarov A. (2019) Orbitrap journey: taming the ion rings. Nat. Commun. 10, 3743. - PMC - PubMed
    1. Kelstrup C. D., Young C., Lavallee R., Nielsen M. L., Olsen J. V. (2012) Optimized fast and sensitive acquisition methods for shotgun proteomics on a quadrupole orbitrap mass spectrometer. J. Proteome Res. 11, 3487–3497 - PubMed

Publication types