. 2020 Feb 25;117(8):4158-4168.
doi: 10.1073/pnas.1917938117. Epub 2020 Feb 12.

Statin-induced GGPP depletion blocks macropinocytosis and starves cells with oncogenic defects

Affiliations

Statin-induced GGPP depletion blocks macropinocytosis and starves cells with oncogenic defects

Zhihua Jiao et al. Proc Natl Acad Sci U S A. .

Erratum in

Abstract

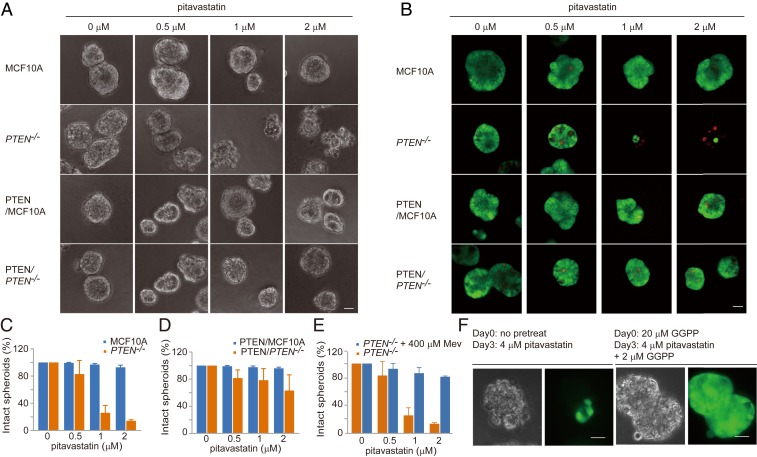
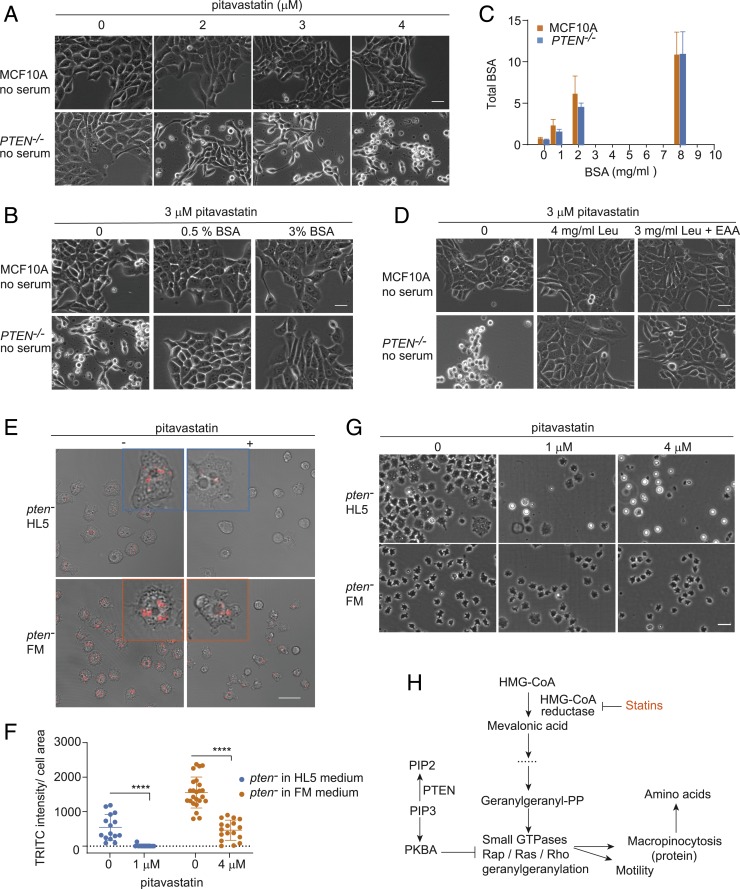
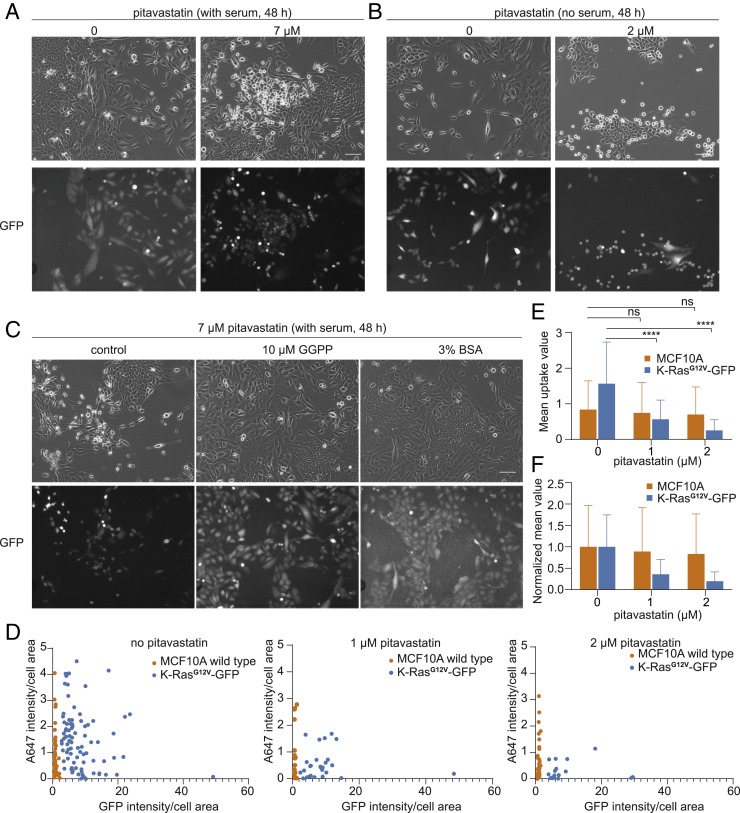
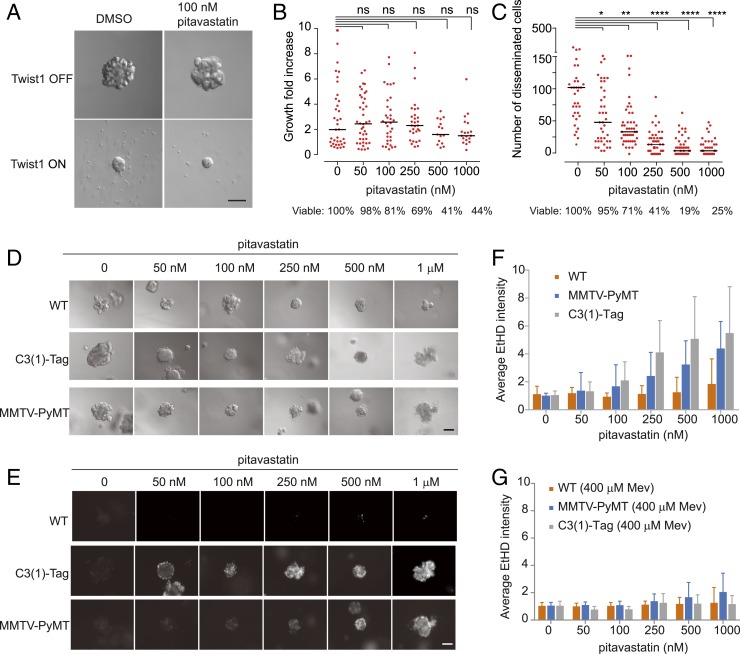
Cancer cells display novel characteristics which can be exploited for therapeutic advantage. Isolated studies have shown that 1) the mevalonate pathway and 2) increased macropinocytosis are important in tumorigenesis, but a connection between these two observations has not been envisioned. A library screen for compounds that selectively killed Dictyostelium pten- cells identified pitavastatin. Pitavastatin also killed human breast epithelial MCF10A cells lacking PTEN or expressing K-RasG12V, as well as mouse tumor organoids. The selective killing of cells with oncogenic defects was traced to GGPP (geranylgeranyl diphosphate) depletion. Disruption of GGPP synthase in Dictyostelium revealed that GGPP is needed for pseudopod extension and macropinocytosis. Fluid-phase uptake through macropinocytosis is lower in PTEN-deleted cells and, as reported previously, higher in cells expressing activated Ras. Nevertheless, uptake was more sensitive to pitavastatin in cells with either of these oncogenic mutations than in wild-type cells. Loading the residual macropinosomes after pitavastatin with high concentrations of protein mitigated the cell death, indicating that defective macropinocytosis leads to amino acid starvation. Our studies suggest that the dependence of cancer cells on the mevalonate pathway is due to the role of GGPP in macropinocytosis and the reliance of these cells on macropinocytosis for nutrient uptake. Thus, inhibition of the networks mediating these processes is likely to be effective in cancer intervention.

Keywords: cancer; chemotaxis; mevalonate pathway; small GTPases; tumor organoids.


Conflict of interest statement

The authors declare no competing interest.

Figures

Fig. 1.
Fig. 1.
Identification of Dictyostelium and mammalian PTEN−/− vulnerability to statins. (A) Schematic representation of the screening strategy. (B) Measurement of the growth of pten cells in response to seven different statins (5 μM, mean ± SD, n = 3). (C) Cytotoxic effects of fluvastatin and pitavastatin on Dictyostelium pten cells compared with WT. (Scale bars, 20 μm.) (D) Measurement of the growth of WT and pten cells in response to increasing concentrations of fluvastatin or pitavastatin (mean ± SD, n = 3). (E) The expression of PTEN-GFP in pten cells renders resistance to fluvastatin and pitavastatin (mean ± SD, n = 3). (F) Measurement of the growth of PTEN−/− cells in response to seven different statins (5 μM, mean ± SD, n = 3). (G) Cytotoxic effects of pitavastatin (5 μM) on mammalian PTEN−/− cells compared with MCF10A and dimethyl sulfoxide (DMSO) control. (Scale bar, 30 μm.) (H) Measurement of the growth of MCF10A and PTEN−/− cells in response to increasing concentrations of pitavastatin (mean ± SD, n = 3). (I) The expression of PTEN in PTEN−/− cells renders resistance to pitavastatin. (Scale bar, 30 μm.)
Fig. 2.
Fig. 2.
PTEN−/− spheroids are vulnerable to perturbation of the mevalonate pathway. (A) Cytotoxic effects of pitavastatin on MCF10A and PTEN−/− spheroids in 3D culture. (Scale bar, 30 μm.) (B) MCF10A and PTEN−/− spheroid staining with fluorescein diacetate and propidium iodide after pitavastatin treatment. (Scale bar, 30 μm.) (C) Measurement of the intact spheroids of MCF10A and PTEN−/− in response to increasing concentrations of pitavastatin (mean ± SD, n = 500 spheroids). (D) Measurement of the intact spheroids of PTEN/MCF10A and PTEN/PTEN−/− in response to increasing concentrations of pitavastatin (mean ± SD, n = 500 spheroids). (E) Measurement of the intact spheroids of PTEN−/− in the absence or presence of Mev and increasing concentrations of pitavastatin (mean ± SD, n = 500 spheroids). (F) The addition of GGPP rescues pitavastatin-induced cell death of PTEN−/− in 3D culture. (Scale bars, 30 μm.)
Fig. 3.
Fig. 3.
Modulation of geranylgeranylation mediates the cytotoxic effects of pitavastatin. (A) Schematic of the mevalonate pathway. Chemical inhibitors of specific steps are in orange. (B) The addition of Mev or geranylgeranyl pyrophosphate (GGPP) rescues pitavastatin-induced cell death in Dictyostelium pten cells. Images were taken 72 h after drug addition. (Scale bar, 20 μm.) (C) The addition of Mev rescues pitavastatin-induced cell death in MCF10A PTEN−/− cells. Images were taken 68 h after drug addition. (Scale bar, 30 μm.) (D) Measurement of MCF10A and PTEN−/− cell growth in the absence or presence of Mev and increasing concentrations of pitavastatin (mean ± SD, n = 3). (E) Inhibition of geranylgeranyl transferase (with GGTI, 48 h), but not squalene synthase (with YM, 68 h) or farnesyl transferase (with FTI, 68 h), is able to recapitulate pitavastatin treatment. (Scale bar, 30 μm.) (F) The addition of GGPP or geranyl pyrophosphate rescues pitavastatin-induced cell death. Images were taken 68 h after drug addition. (Scale bar, 30 μm.) (G) Measurement of MCF10A and PTEN−/− cell growth in the absence or presence of GGPP and increasing concentrations of pitavastatin (mean ± SD, n = 3).
Fig. 4.
Fig. 4.
GGPP is essential for cell migration and macropinocytosis. (A) ggps1 cells could not survive without addition of GGPP. (Scale bar, 20 μm.) (B) The expression of Dictyostelium GGPPS-GFP in ggps1 cells renders their survival independent of GGPP. (Scale bar, 20 μm.) (C) Overexpressing RapA, RasB, RasC, RasD, RacM, and RacL in Dictyostelium pten cells partially suppresses the effects of pitavastatin. (Scale bar, 20 μm.) (D) Color-coded outlines (10 min apart) of several cells (ggps1 cells with 0.1 μM GGPP [Left] or 0.2 μM GGPP [Right] after 48 h) were imposed on top of the phase images, with yellow outlining the last cells. (Scale bar, 20 μm.) (E) Cell migration tracks showing random movement of cells from D. (F) Time-lapse phase-contrast images showing single cells from D and E at 10-min intervals indicating that GGPP is required for Dictyostelium cells to make protrusions. (Scale bar, 10 μm.) (G) The effects of GGPP on fluid-phase uptake in Dictyostelium ggps1 cells. (Scale bar, 20 μm.) (H) Measurement of fluid-phase uptake in ggps1 cells in the presence of increasing concentrations of GGPP (n = 3 experiments, one-way ANOVA with post hoc Tukey HSD (honestly significant difference) test, ****P < 0.0001).
Fig. 5.
Fig. 5.
Macropinocytosis in PTEN-deleted cells shows more defects and higher sensitivity to pitavastatin than wild-type cells. (A) The effects of pitavastatin on fluid-phase uptake in Dictyostelium wild-type and pten cells. (Scale bar, 20 μm.) (B) Measurement of fluid-phase uptake in wild-type and pten cells in the presence of increasing concentrations of pitavastatin (n = 3 experiments, one-way ANOVA with post hoc Tukey HSD test, ****P < 0.0001; ns, not significant). (C) The effects of pitavastatin on fluid-phase uptake in MCF10A and PTEN−/− cells. Groups of cells are outlined with yellow. (Scale bar, 20 μm.) (D) Measurement of fluid-phase uptake in MCF10A and PTEN−/− cells in the presence of increasing concentrations of pitavastatin. For each condition, 4 to 11 images are used for quantification, and each image includes 10 to 20 cells (n = 3 experiments, nonparametric Mann–Whitney–Wilcoxon test, ***P < 0.001). (E) PTEN−/− cells are more starved than MCF10A cells after pitavastatin treatment. MCF10A and PTEN−/− cells were treated with pitavastatin for the indicated period, and cell lysates were subjected to immunoblot analysis with an anti-LC3 antibody. The positions of LC3-I and LC3-II are indicated. The ratio of LC3-II to total LC3 indicates the level of cell starvation.
Fig. 6.
Fig. 6.
Defective macropinocytosis after pitavastatin induces protein and amino acid starvation in PTEN−/− cells. (A) The sensitivity of pitavastatin increases in PTEN−/− cells under serum-free conditions. (Scale bar, 30 μm.) (B) BSA rescues the cytotoxic effects of pitavastatin in mammalian PTEN−/− cells under serum-free conditions. (Scale bar, 30 μm.) (C) Total intracellular BSA in MCF10A and PTEN−/− cells increases with increasing concentrations of BSA in the medium (mean ± SD, n = 3). (D) Leucine (Leu) rescues the cytotoxic effects of pitavastatin on mammalian PTEN−/− cells under serum-free conditions. (Scale bar, 30 μm.) (E) Fluid-phase uptake in Dictyostelium pten cells in HL5 medium and FM medium. pten cells in HL5 medium were added with 1 μM pitavastatin; pten cells in FM medium were added with 4 μM pitavastatin. (Scale bar, 20 μm.) (F) Measurement of fluid-phase uptake in Dictyostelium pten cells in HL5 medium and FM medium (n = 3 experiments, nonparametric Mann–Whitney–Wilcoxon test, ****P < 0.0001). (G) Dictyostelium pten cells show resistance to pitavastatin in FM medium containing abundant amino acids. (Scale bar, 20 μm.) (H) Proposed molecular architecture of the mevalonate pathway and macropinocytosis.
Fig. 7.
Fig. 7.
MCF10A cells expressing K-RasG12V-GFP are vulnerable to perturbation of the mevalonate pathway. (A) Cytotoxic effects of pitavastatin on MCF10A cells expressing K-RasG12V-GFP compared with wild-type cells in complete medium. Both MCF10A wild-type cells and RasG12V-GFP cells are included in the bright-field image. Only K-RasG12V-GFP cells are labeled in GFP images. (Scale bar, 20 μm.) (B) Cytotoxic effects of pitavastatin on MCF10A cells expressing K-RasG12V-GFP compared with wild-type cells in serum-free medium. (Scale bar, 20 μm.) (C) Supplementation of GGPP and BSA rescues pitavastatin-induced cell death in K-RasG12V-GFP cells. (Scale bar, 20 μm.) (D) Measurement of fluid-phase uptake in MCF10A wild-type and K-RasG12V-GFP–expressing cells in the presence of increasing concentrations of pitavastatin. For each condition, a single cell is outlined for quantification; cells with less GFP signal are recognized as wild-type cells. (E) The mean value of fluid-phase uptake in MCF10A wild-type and K-RasG12V-GFP–expressing cells in the presence of increasing concentrations of pitavastatin (mean ± SD, n = 3 experiments, one-way ANOVA with post hoc Tukey HSD test, ****P < 0.0001). (F) The normalized mean value of fluid-phase uptake in MCF10A wild-type and K-RasG12V-GFP–expressing cells in the presence of increasing concentrations of pitavastatin (mean ± SD).
Fig. 8.
Fig. 8.
Twist1 ON and tumor organoids in the mouse model exhibit vulnerability to pitavastatin. (A) Effects of pitavastatin on Twist1 ON organoids. (Scale bar, 100 μm.) (B) Measurement of the growth of Twist1 OFF organoids in response to increasing concentrations of pitavastatin (n = 3 experiments, nonparametric Mann–Whitney–Wilcoxon test). (C) Measurement of the disseminated cells of Twist1 ON organoids in response to increasing concentrations of pitavastatin (n = 3 experiments, nonparametric Mann–Whitney–Wilcoxon test, *P < 0.05, **P < 0.01, ***P < 0.001, ****P < 0.0001). (D) Effects of pitavastatin on viability of WT, C3 (1)-TAg, and MMTV-PyMT organoids. (Scale bar, 100 μm.) (E) Effects of pitavastatin on the viability of WT, C3 (1)-TAg, and MMTV-PyMT organoids. Dead cells are stained with ethidium homodimer (EthD). (Scale bar, 100 μm.) (F) Measurement of the cell death of tumor organoids in response to increasing concentrations of pitavastatin. (G) Measurement of the cell death of tumor organoids in the presence of 400 μM Mev and increasing concentrations of pitavastatin (mean ± SD, n = 3 experiments).

References

    1. Yamada K. M., Araki M., Tumor suppressor PTEN: Modulator of cell signaling, growth, migration and apoptosis. J. Cell Sci. 114, 2375–2382 (2001). - PubMed
    1. Castellano E., et al. , RAS signalling through PI3-kinase controls cell migration via modulation of Reelin expression. Nat. Commun. 7, 11245 (2016). - PMC - PubMed
    1. Li X., et al. , Mutually inhibitory Ras-PI(3,4)P2 feedback loops mediate cell migration. Proc. Natl. Acad. Sci. U.S.A. 115, E9125–E9134 (2018). - PMC - PubMed
    1. Miao Y., et al. , Altering the threshold of an excitable signal transduction network changes cell migratory modes. Nat. Cell Biol. 19, 329–340 (2017). - PMC - PubMed
    1. Gerisch G., et al. , Membrane and actin reorganization in electropulse-induced cell fusion. J. Cell Sci. 126, 2069–2078 (2013). - PubMed

Publication types