. 2020 Feb 13;5(3):e130651.
doi: 10.1172/jci.insight.130651.

Immune cell landscaping reveals a protective role for regulatory T cells during kidney injury and fibrosis

Affiliations

Immune cell landscaping reveals a protective role for regulatory T cells during kidney injury and fibrosis

Fernanda do Valle Duraes et al. JCI Insight. .

Abstract

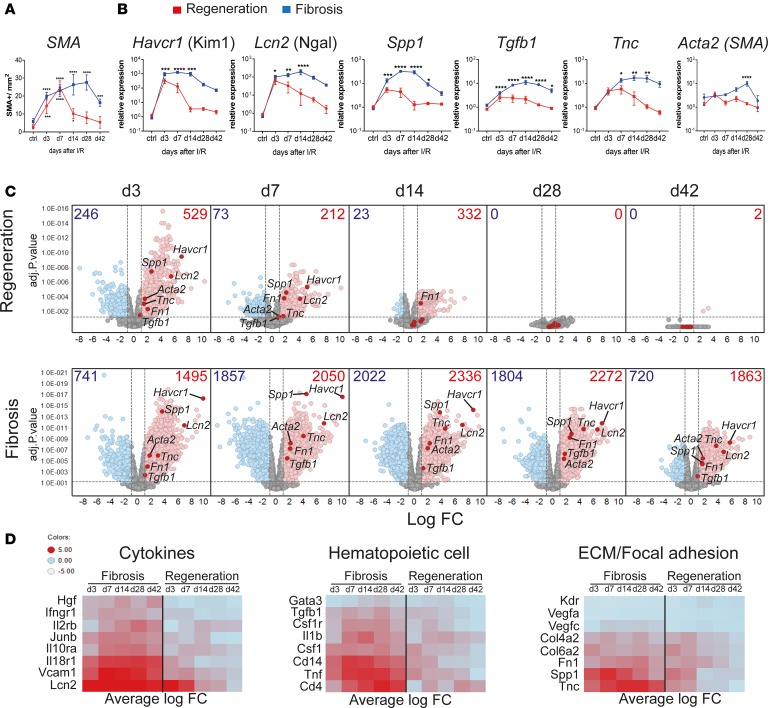
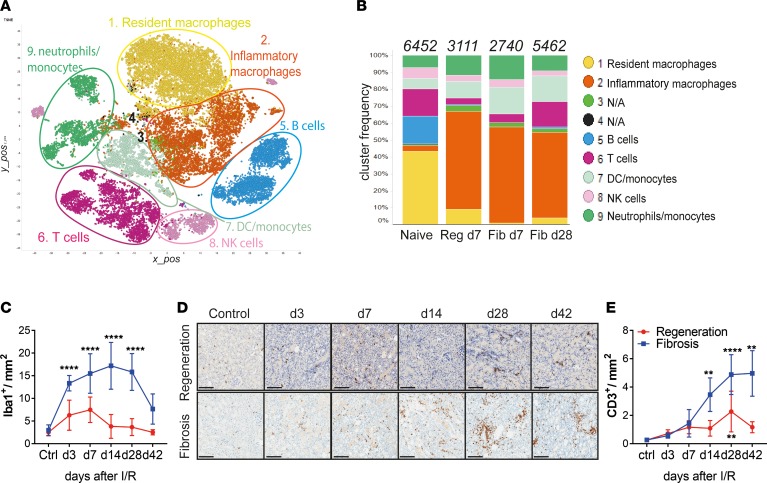
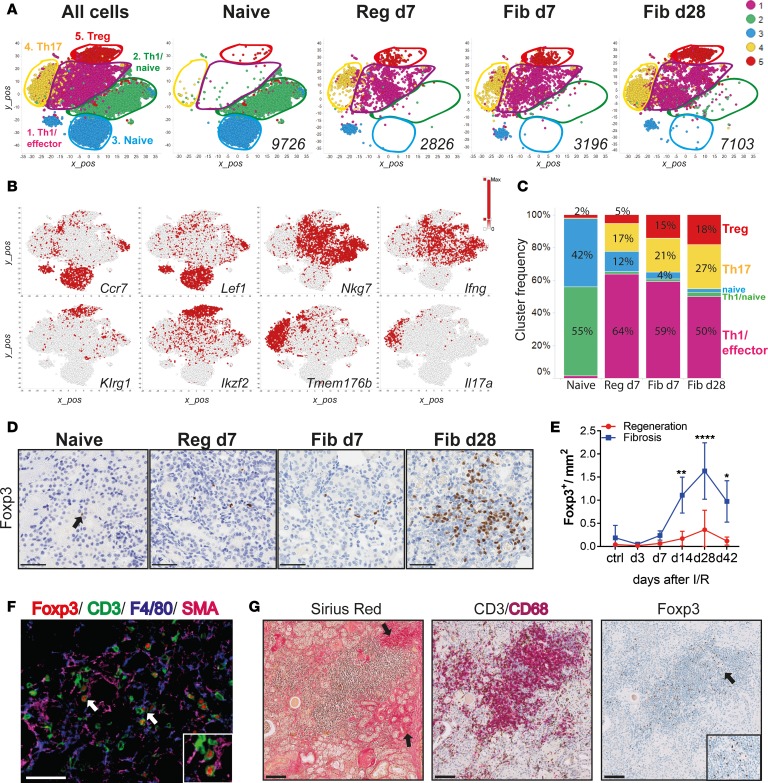
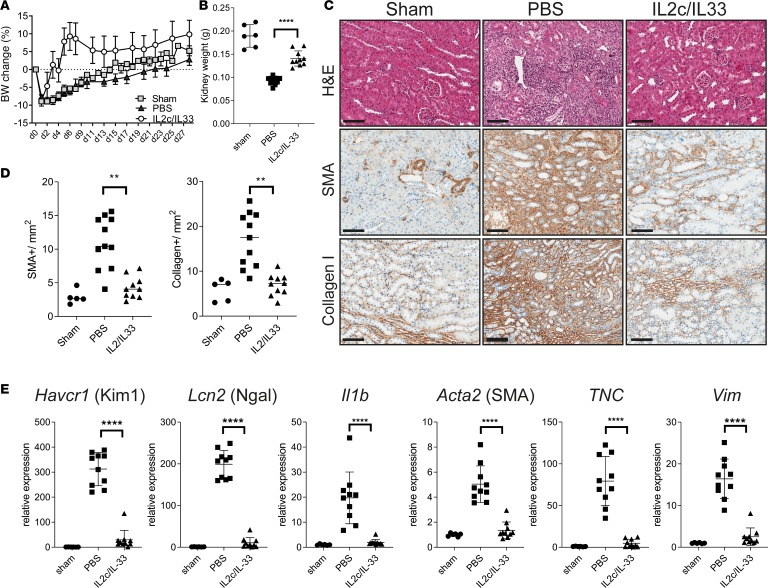
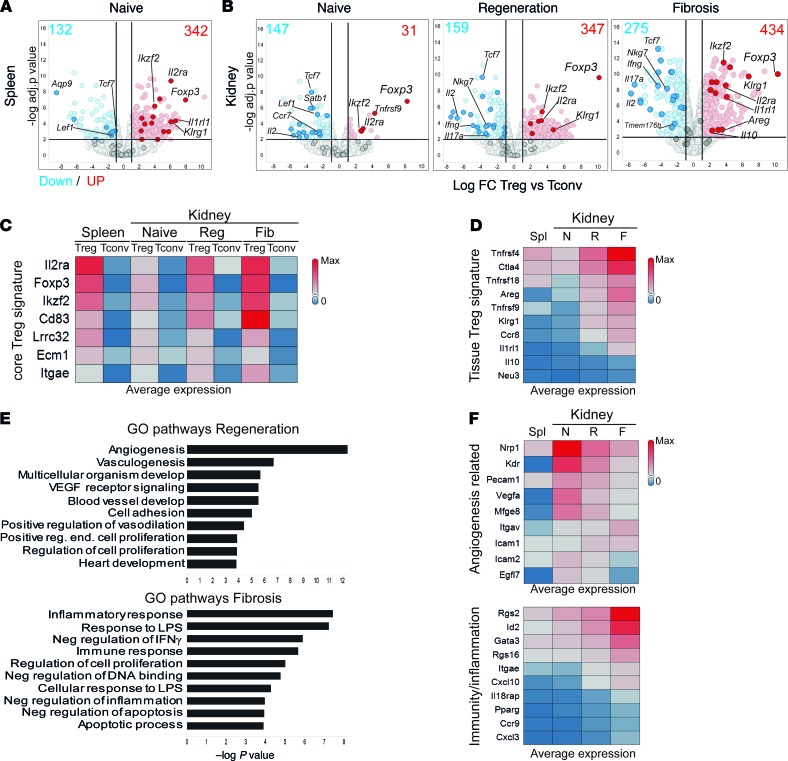
Acute kidney injury (AKI) and chronic kidney diseases are associated with high mortality and morbidity. Although the underlying mechanisms determining the transition from acute to chronic injury are not completely understood, immune-mediated processes are critical in renal injury. We have performed a comparison of 2 mouse models leading to either kidney regeneration or fibrosis. Using global gene expression profiling we could identify immune-related pathways accounting for the majority of the observed transcriptional changes during fibrosis. Unbiased examination of the immune cell composition, using single-cell RNA sequencing, revealed major changes in tissue-resident macrophages and T cells. Following injury, there was a marked increase in tissue-resident IL-33R+ and IL-2Ra+ regulatory T cells (Tregs). Expansion of this population before injury protected the kidney from injury and fibrosis. Transcriptional profiling of Tregs showed a differential upregulation of regenerative and proangiogenic pathways during regeneration, whereas in the fibrotic environment they expressed markers of hyperactivation and fibrosis. Our data point to a hitherto underappreciated plasticity in Treg function within the same tissue, dictated by environmental cues. Overall, we provide a detailed cellular and molecular characterization of the immunological changes during kidney injury, regeneration, and fibrosis.

Keywords: Adaptive immunity; Chronic kidney disease; Fibrosis; Immunology; Nephrology.


Conflict of interest statement

Conflict of interest: All authors except KDM are employees of Novartis Pharma AG.

Figures

Figure 1
Figure 1. Kidney regeneration and fibrosis characterization after ischemia/reperfusion injury (IRI) reveal sustained dysregulation in immune system–related pathways during kidney fibrosis.
Time course after kidney injury in regeneration and fibrosis models. Mice were subjected to 30 minutes of unilateral left renal IRI, with (regeneration) or without contralateral kidney nephrectomy (fibrosis). (A) Morphometric quantification of α-smooth muscle actin (SMA) staining on kidney sections at indicated time points from regeneration (red line) and fibrosis (blue line). (B) qPCR analysis of the indicated genes, on regeneration (red line) and fibrosis (blue line) samples for the indicated time points, as fold change relative to control samples. (C) Volcano plots showing the fold change (FC) versus P value of differentially expressed (DE) genes in regeneration (top) and fibrosis (bottom) for the indicated time points (in days), compared with age- and sex-matched naive and sham control mice. Numbers indicate upregulated (red) FC > 2, or downregulated genes (blue) FC < 2; P < 0.05. Selected kidney injury and fibrosis biomarker genes are highlighted. (D) Heatmaps showing the average FC of selected upregulated genes from key regulated pathways. Results are representative of 1 (regeneration model) or 2 (fibrosis model) independent experiments, with 3 to 5 mice per time point/condition. Mean ± SEM. *P < 0.05; **P < 0.01; ***P < 0.001; ****P < 0.0001 compared with controls by 2-way ANOVA followed by Dunnett’s post hoc test for multiple comparisons (A and B).
Figure 2
Figure 2. Single-cell RNA-Seq reveals major alterations in tissue-resident myeloid and T cells after kidney injury.
(A) Unsupervised clustering showing 9 major clusters in 2-dimensional t-SNE plots. A total of 28,767 combined CD45+ single cells from naive, regeneration day 7, and fibrosis days 7 and 28, derived from 2 independent biological replicates each. (B) Bar graphs showing the relative frequencies of the respective clusters from A, in each disease model from indicated time points. Numbers on top indicate the total number of cells per condition analyzed. (C) Morphometric quantification of Iba-1+ macrophage immunostaining on kidney sections from regeneration and fibrosis. (D) Representative CD3 immunostaining on kidney sections from regeneration (top) and fibrosis (bottom) for the indicated time points and (E) morphometric quantification. Scale bars: 100 μm. Results are representative of 1 (regeneration model) or 2 (fibrosis model) independent experiments, with 3 to 5 mice per time point/condition. Mean ± SEM. **P < 0.01; ****P < 0.0001 compared with controls by 2-way ANOVA followed by Dunnett’s post hoc test for multiple comparisons (E and F). Reg, regeneration; Fib, fibrosis.
Figure 3
Figure 3. Single-cell RNA-Seq of kidney CD4+ T cells identifies a population of regulatory T cells that expands during fibrosis.
(A) Unsupervised cell clustering colored by the 5 major populations from sorted kidney CD4+ T cells in 2-dimensional t-SNE plots. A total of 22,851 combined kidney single cells (left) and separated by indicated conditions and time points (right). Numbers indicate the total number of cells per condition. (B) t-SNE plots showing selected marker genes for each cluster. Colors indicate the gene expression level. (C) Bar graphs showing the frequency of each cluster (as in A) per condition and time point. (D) Representative Foxp3 immunostaining on kidney sections from naive, regeneration day 7, and fibrosis days 7 and 28, and (E) morphometric quantification. (F) Multicolor immunofluorescence of kidney sections from fibrosis day 28. Arrows indicate Tregs interacting with SMA+ (zoomed area in the square insert at the bottom right) and F4/80+ cells. (G) Kidney biopsies from a patient after transplant with fibrosis, stained with Sirius Red and for CD3/CD68 and Foxp3. Arrows on the left picture indicate fibrotic areas and the right picture shows Treg accumulation (zoomed areas in the small square). Scale bars: 50 μm (D and F) and 100 μm (G). Results are representative of 1 (regeneration model) or 2 (fibrosis model) independent experiments, with 3 to 5 mice per time point/condition. Mean ± SEM. *P < 0.05; **P < 0.01; ****P < 0.0001 compared with controls by 2-way ANOVA followed by Dunnett’s post hoc test for multiple comparisons (E). Reg, regeneration; Fib, fibrosis.
Figure 4
Figure 4. In vivo Treg expansion ameliorates kidney fibrosis.
Male mice were subjected to IRI, fibrosis model. Mice were treated with a mixture of IL-2–IL-2 mAb (IL-2c) and IL-33 (IL-2c/IL-33) for 5 consecutive days, starting from day –3. Samples were harvested and analyzed 28 days after injury. (A) Body weight change graph for the indicated groups. (B) Left kidney weight at termination. (C) Representative images showing H&E, α-SMA, and collagen I staining on kidney sections from sham, PBS, or IL-2c/IL-33–treated mice. Scale bars: 100 μm. (D) Morphometric quantification of α-SMA and collagen I positive staining, from C. (E) qPCR analysis of whole kidneys for the indicated markers of kidney injury Kim1 and Ngal, inflammation (IL-1b) and fibrosis (α-SMA; TNC, tenascin; Vim, vimetin), shown as fold change relative to control samples. Results are a pool of 2 independent experiments; n = 5 for sham; n = 11 for PBS; n = 10 for IL-2c/IL-33. Mean ± SEM. **P < 0.01; ****P < 0.0001 compared with PBS-treated group by 2-tailed Student’s t test.
Figure 5
Figure 5. New markers of tissue-resident regulatory T cells during kidney injury and fibrosis.
Bulk RNA-Seq analysis showing detected transcriptional differences. (A and B) Volcano plots with the log fold change (FC) and P value for the comparison between Treg versus Tconv genes for the indicated conditions and tissues. Selected Tconv and core Treg genes are highlighted in blue and red, respectively. Numbers indicate the amount of upregulated (red, FC > 2) and downregulated (blue, FC < –2) genes. (C and D) Heatmap representations showing the average expression (FPKM, fragments per kilobase of exon model per million reads mapped) of core Treg signature genes (C) and tissue Treg genes (D) at the indicated conditions. (E) Gene Ontology (GO) pathway analysis showing the top 10 upregulated pathways in Tregs from regeneration (red, top) and fibrosis (blue, bottom), ranked by P value. (F) Heatmaps showing the expression of selected genes from the pathways in E. N, naive; R, regeneration; F, fibrosis; Spl, spleen.

References

    1. Chawla LS, et al. Acute kidney disease and renal recovery: consensus report of the Acute Disease Quality Initiative (ADQI) 16 Workgroup. Nat Rev Nephrol. 2017;13(4):241–257. doi: 10.1038/nrneph.2017.2. - DOI - PubMed
    1. Hoste EA, Schurgers M. Epidemiology of acute kidney injury: how big is the problem? Crit Care Med. 2008;36(4 suppl):S146–S151. - PubMed
    1. See EJ, et al. Long-term risk of adverse outcomes after acute kidney injury: a systematic review and meta-analysis of cohort studies using consensus definitions of exposure. Kidney Int. 2019;95(1):160–172. doi: 10.1016/j.kint.2018.08.036. - DOI - PubMed
    1. Chawla LS, Eggers PW, Star RA, Kimmel PL. Acute kidney injury and chronic kidney disease as interconnected syndromes. N Engl J Med. 2014;371(1):58–66. doi: 10.1056/NEJMra1214243. - DOI - PMC - PubMed
    1. Zuk A, Bonventre JV. Acute kidney injury. Annu Rev Med. 2016;67:293–307. doi: 10.1146/annurev-med-050214-013407. - DOI - PMC - PubMed

MeSH terms