. 2020 Feb 12;11(1):856.
doi: 10.1038/s41467-020-14666-6.

Deriving disease modules from the compressed transcriptional space embedded in a deep autoencoder

Affiliations

Deriving disease modules from the compressed transcriptional space embedded in a deep autoencoder

Sanjiv K Dwivedi et al. Nat Commun. .

Abstract

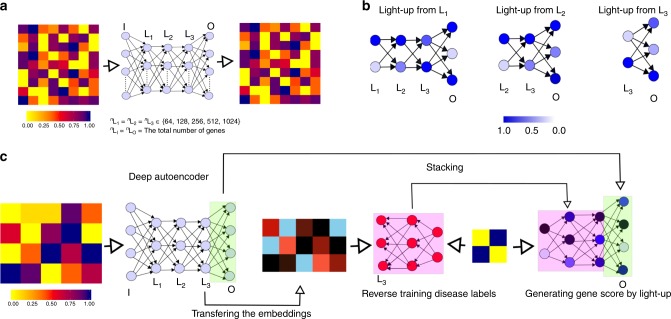
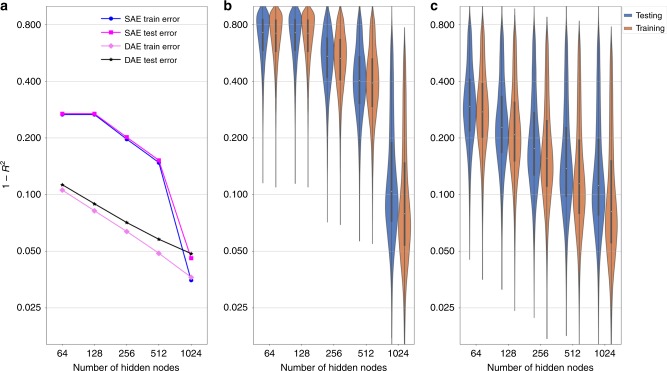
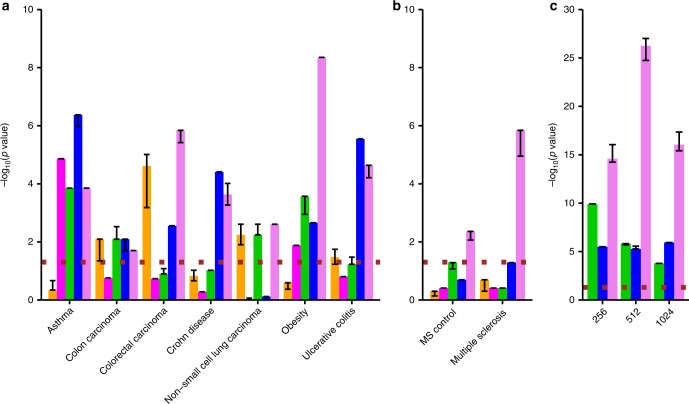
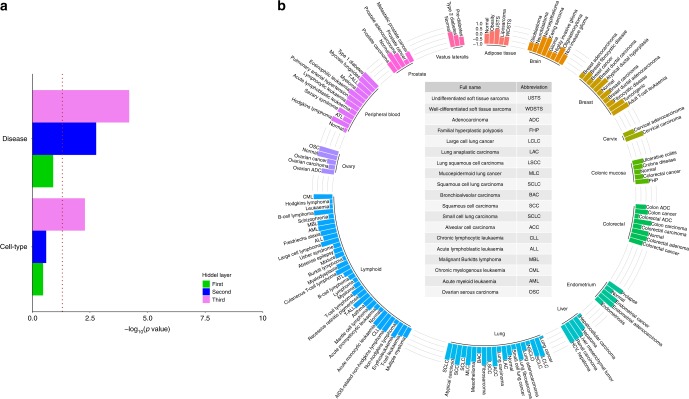
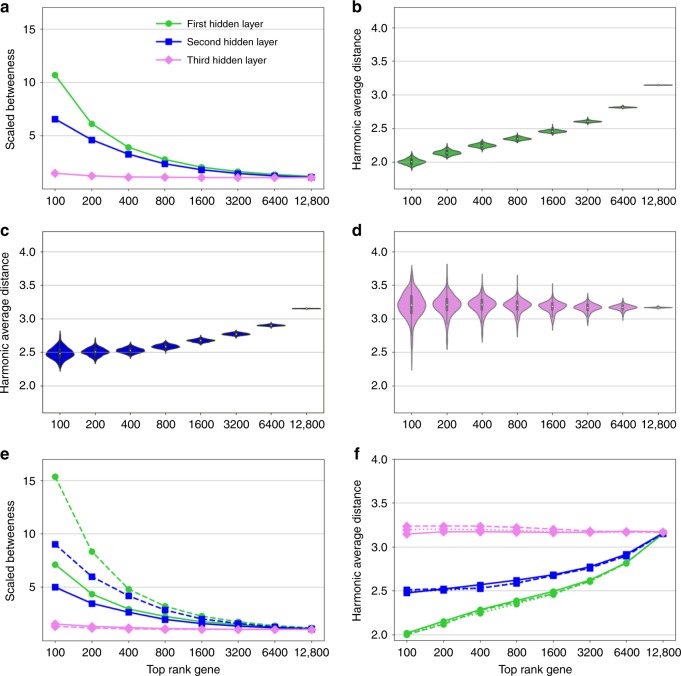
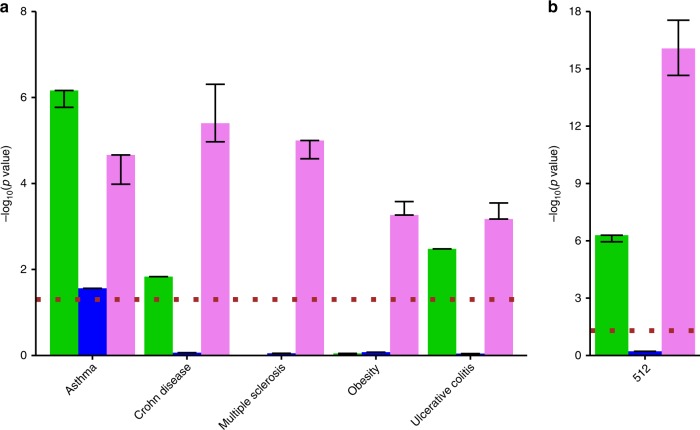
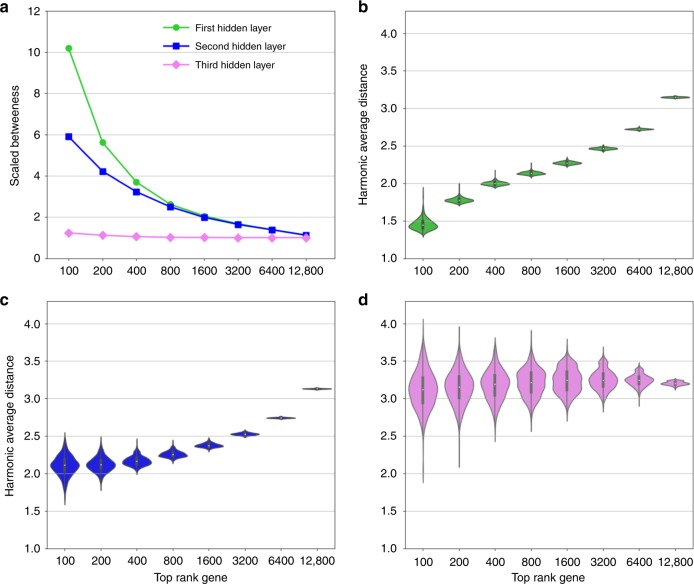
Disease modules in molecular interaction maps have been useful for characterizing diseases. Yet biological networks, that commonly define such modules are incomplete and biased toward some well-studied disease genes. Here we ask whether disease-relevant modules of genes can be discovered without prior knowledge of a biological network, instead training a deep autoencoder from large transcriptional data. We hypothesize that modules could be discovered within the autoencoder representations. We find a statistically significant enrichment of genome-wide association studies (GWAS) relevant genes in the last layer, and to a successively lesser degree in the middle and first layers respectively. In contrast, we find an opposite gradient where a modular protein-protein interaction signal is strongest in the first layer, but then vanishing smoothly deeper in the network. We conclude that a data-driven discovery approach is sufficient to discover groups of disease-related genes.


Conflict of interest statement

The authors declare no competing interests.

Figures

Fig. 1
Fig. 1. Schematic diagram of interpreting an autoencoder and defining the disease modules.
a Training an autoencoder. b The steps of light-up method used for interpreting the hidden layer nodes in terms of PPI and pathways. c Depicts the steps of predicting the disease gene using transcriptomics signals and autoencoder.
Fig. 2
Fig. 2. Deep autoencoder (deepAE) outperformed shallow autoencoder (shallowAE) up to 512 hidden nodes in terms of accuracy.
1 − coefficient of determination (R2), in training and validation set using the full data set variance (a) and the gene-wise variances (b, c). The left panel shows the mean behavior of R2 values on the full data set. The distribution of R2 values across each gene is shown for both models, shallowAE (b), and three-layer deepAE (c), with increase in the number of hidden nodes in each layer from 64 to 1024.
Fig. 3
Fig. 3. Disease association enrichment of autoencoder (AE)-derived gene sets.
a, b Enrichment score (−log10(P)) resulting from the hyper-geometric test between disease gene overlap of the predicted genes by the deep neural network derived by first (green), second (blue), and third (violet) hidden layers of the deep autoencoder (deepAE). As references, we show with a method based on a vanilla supervised neural network (orange) and also the hidden layer of the shallow autoencoder 512 nodes (shallowAE; magenta). MS. c The Fisher’s combined p value across all eight diseases predicted by a three-layer deep autoencoder. The dotted (brown) line corresponds to the p value, cut-off 0.05.
Fig. 4
Fig. 4. Deep autoencoder (deepAE) representation clustering samples into cell types and diseases.
a Significance score (−log10(p)) for first (green), second (blue), and third (violet) deepAE layers are more coherent (measured by a high Silhouette index (SI)) with respect to cell types (lower) and diseases (upper) than the standard principal component (PC) analysis-based approach. b SI defined by the two PCs for diseases and control samples on compressed signals at the third hidden of deepAE with each of the three hidden layers having 512 nodes.
Fig. 5
Fig. 5. Genes that co-localised in the first and seccond hidden layers also co-localised in the interactome.
a The betweenness centrality behavior of the top ranked genes on the basis of the first (green), second (blue), and third (violet) hidden layers of the deep autoencoder. bd The distribution of harmonic average distances of the top rank genes based on each hidden node of the first, second, and third hidden layers of the deep autoencoder, respectively. Also, these results are robust across 256 and 1024 hidden nodes of the deep autoencoder (e, f).
Fig. 6
Fig. 6. Generalization of disease association enrichment results in the deep autoencoder (deepAE) of derived gene sets using RNA-seq data.
a Enrichment score (−log10(P)) resulting from the hyper-geometric test between disease gene overlap of the predicted genes by the deep neural network derived by the first (green), second (blue), and third (violet) hidden layers, of the deepAE. b Fisher’s combined p value across all five complex diseases predicted by the three-layer deep autoencoder. The dotted (brown) line corresponds to the p value, cut-off 0.05.
Fig. 7
Fig. 7. RNA-seq replicated gene co-localisation pattern from micro-array data.
a Betweenness centrality behavior of the top ranked genes on the basis of the first (green), second (blue), and third (violet) hidden layers of the deep autoencoder trained on the RNA-seq data. bd Distribution of harmonic average distances of the top rank genes based on each hidden node of the first, second, and third hidden layers of the deep autoencoder respectively.

References

    1. Gustafsson M, et al. Modules, networks and systems medicine for understanding disease and aiding diagnosis. Genome Med. 2014;6:82. doi: 10.1186/s13073-014-0082-6. - DOI - PMC - PubMed
    1. Menche J, et al. Uncovering disease-disease relationships through the incomplete interactome. Science. 2015;347:1257601. doi: 10.1126/science.1257601. - DOI - PMC - PubMed
    1. Subramanian A, et al. Gene set enrichment analysis: a knowledge-based approach for interpreting genome-wide expression profiles. Proc. Natl Acad. Sci. USA. 2005;102:15545–15550. doi: 10.1073/pnas.0506580102. - DOI - PMC - PubMed
    1. Gawel DR, et al. A validated single-cell-based strategy to identify diagnostic and therapeutic targets in complex diseases. Genome Med. 2019;11:47. doi: 10.1186/s13073-019-0657-3. - DOI - PMC - PubMed
    1. Barabási AL, Gulbahce N, Loscalzo J. Network medicine: a network-based approach to human disease. Nat. Rev. Genet. 2011;12:56–68. doi: 10.1038/nrg2918. - DOI - PMC - PubMed

Publication types

LinkOut - more resources