. 2020 Feb 12;11(1):844.
doi: 10.1038/s41467-020-14575-8.

Variant antigen diversity in Trypanosoma vivax is not driven by recombination

Affiliations

Variant antigen diversity in Trypanosoma vivax is not driven by recombination

Sara Silva Pereira et al. Nat Commun. .

Abstract

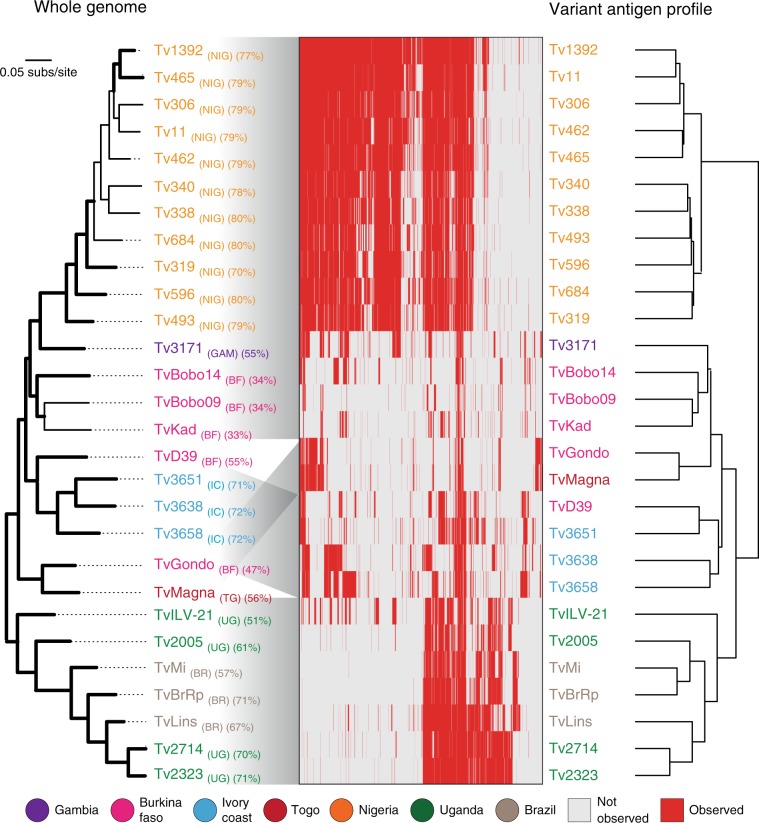
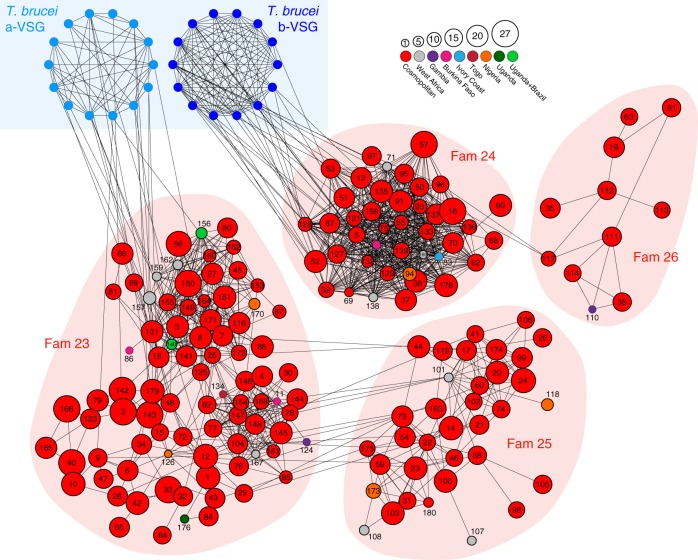
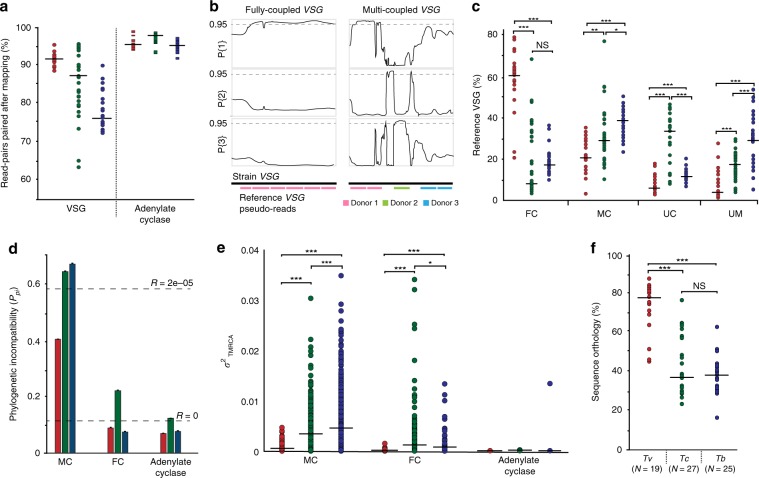
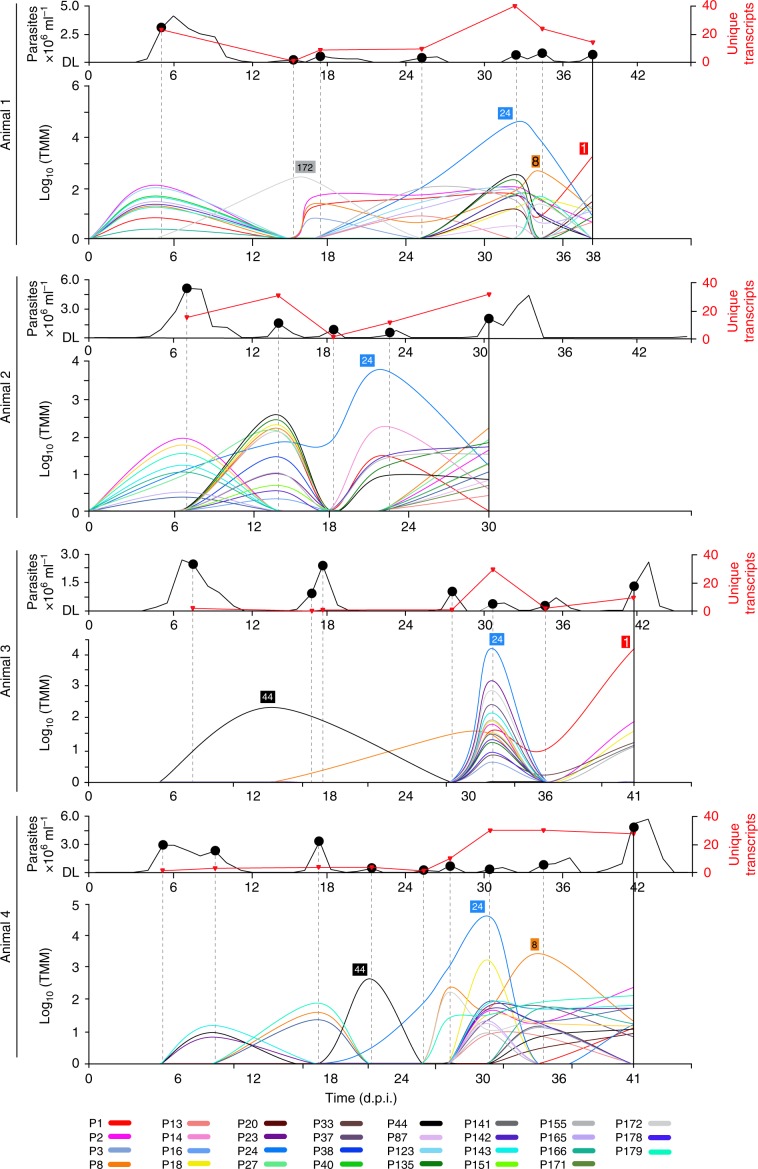
African trypanosomes (Trypanosoma) are vector-borne haemoparasites that survive in the vertebrate bloodstream through antigenic variation of their Variant Surface Glycoprotein (VSG). Recombination, or rather segmented gene conversion, is fundamental in Trypanosoma brucei for both VSG gene switching and for generating antigenic diversity during infections. Trypanosoma vivax is a related, livestock pathogen whose VSG lack structures that facilitate gene conversion in T. brucei and mechanisms underlying its antigenic diversity are poorly understood. Here we show that species-wide VSG repertoire is broadly conserved across diverse T. vivax clinical strains and has limited antigenic repertoire. We use variant antigen profiling, coalescent approaches and experimental infections to show that recombination plays little role in diversifying T. vivax VSG sequences. These results have immediate consequences for both the current mechanistic model of antigenic variation in African trypanosomes and species differences in virulence and transmission, requiring reconsideration of the wider epidemiology of animal African trypanosomiasis.


Conflict of interest statement

The authors declare no competing interests.

Figures

Fig. 1
Fig. 1. Variant antigen profiles of T. vivax clinical isolates based on presence and absence of VSG gene clusters are concordant with population history (i.e. genetic relatedness).
On the left, a Maximum Likelihood phylogenetic tree estimated from a panel of 21,906 whole-genome SNPs using a GTR + Γ + I model. Branch support is provided by 100 bootstrap replicates and branches with bootstrap support >70 are shown in bold. Percentage genome coverage is shown for each strain in brackets following its label. Genome sequence reads for 28 T. vivax clinical strains were mapped to 2038 VSG type sequences, representing conserved clusters of orthologous genes (COGs) or strain-specific sequences, to determine the distribution of each VSG. Presence (red) or absence (white) of each VSG in each strain is indicated in the central panel. Each profile is labelled with the strain name, coloured by its geographical origin, and linked to the SNP tree by the grey shade. On the right, a dendrogram relating all strains according to their observed VSG repertoire was estimated from Euclidean distances between VAPs. Source data are provided as a Source Data file.
Fig. 2
Fig. 2. The T. vivax VSG repertoire is described by 174 phylotypes.
A sequence homology network in which nodes represent phylotypes. Four conserved VSG sub-families (Fam23–26) are indicated by pale red back-shading. Nodes are labelled by phylotype number; node size indicates the number of COGs in each phylotype, while node colour indicates the geographical distribution of the phylotype across 28 clinical isolates. Edges represent PSI-BLAST similarity scores greater than a threshold necessary to connect all phylotypes within sub-families. Structural homology of Fam23 and Fam24 with A-type and B-type T. brucei VSG respectively is indicated at top left. The figure shows that most phylotypes are cosmopolitan in nature, found in multiple strains and in more than two regions. A minority are strain- or location-specific phylotypes, e.g. there are ten phylotypes specific to West Africa (i.e. Ivory Coast, Togo and Burkina Faso) and another 15 phylotypes that are unique to a single location, for instance five in Nigeria (P94, P118, P126, P170, P173), three in Burkina Faso (P11, P86, P120) and two in The Gambia (P110, P124). Source data are provided as a Source Data file.
Fig. 3
Fig. 3. The frequency of VSG recombination differs between African trypanosome species.
a The proportion of read-pairs from strain VSG remaining paired after being mapped to the reference sequence for each trypanosome genome, shaded by species. Adenylate cyclase genes (AC) were included as a negative control. b The definition of fully coupled (FC) and multi-coupled (MC) VSG sequences. Reference VSG sequences were segmented and mapped to strain VSGs. Where ≥85% of pseudo-reads map to the same locus (e.g. ‘Donor 1’), the gene is fully coupled. Where a strain VSG has multiple segments mapping to multiple locations (e.g. ‘Donor 1–3’), the gene is multi-coupled. Example T. brucei VSG sequence quartets are shown after TOPALi HMM analysis (see Methods). The three line graphs represent the Bayesian probabilities of three possible topologies for a quartet phylogeny. An FC VSG displays the same topology along its whole length. An MC VSG displays different phylogenetic signals along its length, dependent on the identity of the sequence donor. c A comparison of the proportions of FC, MC, uncoupled (UC) and unmapped (UM) VSG in each trypanosome species. The median value is shown as a black bar. Statistical significance of differences in the mean are indicated by asterisks (independent t test, *p< 0.05; **p< 0.01; ***p< 0.001). d Phylogenetic incompatibility among VSG genes using Phi. The proportion of FC and MC VSG quartet alignments showing significant phylogenetic incompatibility (Ppi) in MC and FC VSGs is shown, shaded by species (mean ± s.e.m.). Observed Ppi values for simulated sequences generated by NetRecodon, either with recombination (R = 2e−05) or without (R = 0), are indicated by dashed lines. e Variation in the ‘time to most recent common ancestor’ (TMCRA) along MC and FC VSG quartet alignments, estimated from ancestral recombination graphs constructed by ACG. The median value is shown as a black bar. f Total sequence orthology among VSG repertoires in each species. Orthology was calculated as the proportion of VSG base-pairs fully coupled between each strain genome sequence and the reference. Number of strain genomes is shown in brackets. Source data are provided as a Source Data file.
Fig. 4
Fig. 4. VSG phylotype expression during experimental T. vivax Lins infections in a goat model (N = 4).
Parasitaemia (black line) is shown in the upper graph (detection limit (DL)) was 4.1 × 103 trypanosome per millilitre of blood). Parasite RNA was isolated at peaks in parasitaemia, indicated as black dots. The number of unique VSG transcripts (red line) observed in each transcriptome is plotted on the same axis. The lower line graph shows the combined transcript abundance for each VSG phylotype (shaded according to key) through the experiment (days post infection) for four replicates animals (A1–A4 from top to bottom). Note that phylotypes can comprise several, distinct transcripts of variable abundance. Across all peaks in all animals, a phylotype was represented by a single transcript in 105/196 observations, (mean = 1.88 ± 1.26 s.d.). However, across the 31 expressed phylotypes, only eight (P3, P13, P14, P16, P38, P141, P151 and P178) occur as single transcripts on every occasion when they were observed. Thus, while a slight majority of phylotypes are represented by only one transcript at a given peak, most phylotypes are present as multiple transcripts at some point. Phylotypes that were dominant (i.e. superabundant) are labelled adjacent to the pertinent lines. A superabundant VSG was defined as having an expression level at least ten times that of the next most abundant VSG, and this was observed at 15/28 peaks. For example, P24 is 128 times more abundant than P44 at peak 5 in A1, and P1 is 32 times more abundant than P155 at peak 7. The classical expectation of VSG expression is that a peak will include a single superabundant VSG like this; often, however, several co-dominant VSG phylotypes occurred with comparable expression levels, for example at peak 1 in A1 and A2. Source data are provided as a Source Data file.
Fig. 5
Fig. 5. Expression of VSG phylotypes in the context of sequence similarity.
Combined transcript abundance for expressed phylotypes are plotted on to the phylotype sequence similarity network at a early (Peak 1), b middle (peaks 4–7), and c late (last peak) infection stages respectively. Data from four replicate animals are shown (A1–A4 from top to bottom). Nodes represent phylotypes and are labelled by phylotype number. Node size indicates the number of unique expressed transcripts, while node shade indicates the combined transcript abundance (log2 CPM). The classical expectation of VSG expression is that a dominant VSG should subside in abundance and disappear as the host acquires antibody-mediated immunity. However, phylotypes were seen to persist across peaks and/or re-emerge later in the experiment; for instance, P40, P24 and P33 are present at all three time-points in A1, A2 and A3 respectively. Similarly, P2 was expressed strongly at the beginning and re-emerges at the end of infections in A1 and A2. Likewise, P44 was expressed at both the beginning and end of infection in A4. Since only three time-points are shown, it should be noted that these phylotypes were not present at all peaks, so this could represent re-emergence rather than persistence. In cases where sufficient nodes were expressed, the clustering coefficient (C) for their sub-network was calculated. This observed value was compared to mean average C for 100 randomised sub-networks of the same size. The ratio of the observed and expected (by chance) clustering coefficients for expressed sub-networks is shown where a calculation was possible. This value typically exceeds one showing that expressed nodes cluster more than random selections. When considered over all peaks, the clustering coefficient of expressed nodes is significantly higher than coefficients of randomised sub-networks of the same size (see Supplementary Fig. 10 for further details). Source data are provided as a Source Data file.

Similar articles

Cited by

References

    1. Giordani F, Morrison LJ, Rowan TG, De Koning HP, Barrett MP. The animal trypanosomiases and their chemotherapy: a review. Parasitology. 2016;143:1862–1889. doi: 10.1017/S0031182016001268. - DOI - PMC - PubMed
    1. Shaw APM, Cecchi G, Wint GRW, Mattioli RC, Robinson TP. Mapping the economic benefits to livestock keepers from intervening against bovine trypanosomosis in Eastern Africa. Prev. Vet. Med. 2014;113:197–210. doi: 10.1016/j.prevetmed.2013.10.024. - DOI - PubMed
    1. Gardiner PR. Recent studies of the biology of Trypanosoma vivax. Adv. Parasitol. 1989;28:229–317. doi: 10.1016/S0065-308X(08)60334-6. - DOI - PubMed
    1. Osório ALAR, et al. Trypanosoma (Duttonella) vivax: its biology, epidemiology, pathogenesis, and introduction in the New World—a review. Mem. Inst. Oswaldo Cruz. 2008;103:1–13. doi: 10.1590/S0074-02762008000100001. - DOI - PubMed
    1. Morrison LJ, Vezza L, Rowan T, Hope JC. Animal African Trypanosomiasis: time to increase focus on clinically relevant parasite and host species. Trends Parasitol. 2016;32:599–607. doi: 10.1016/j.pt.2016.04.012. - DOI - PubMed

Publication types

MeSH terms

Substances