. 2020 Feb 12;11(1):857.
doi: 10.1038/s41467-020-14654-w.

ATM and PRDM9 regulate SPO11-bound recombination intermediates during meiosis

Affiliations

ATM and PRDM9 regulate SPO11-bound recombination intermediates during meiosis

Jacob Paiano et al. Nat Commun. .

Abstract

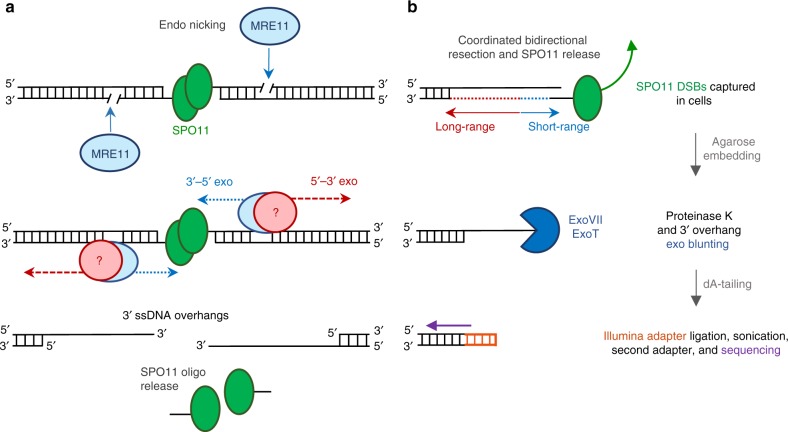
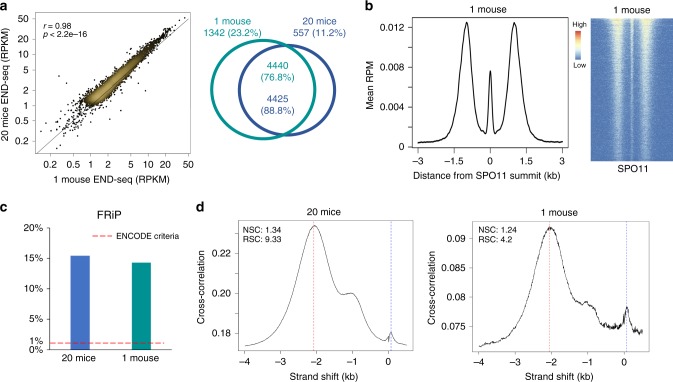
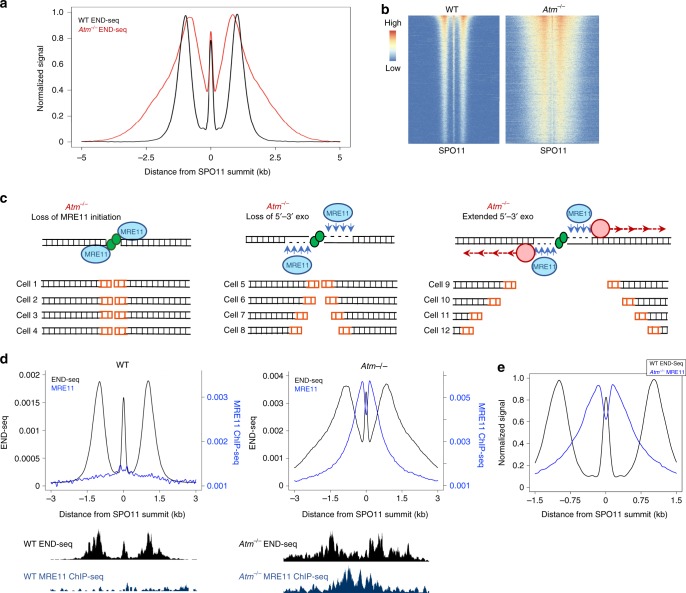
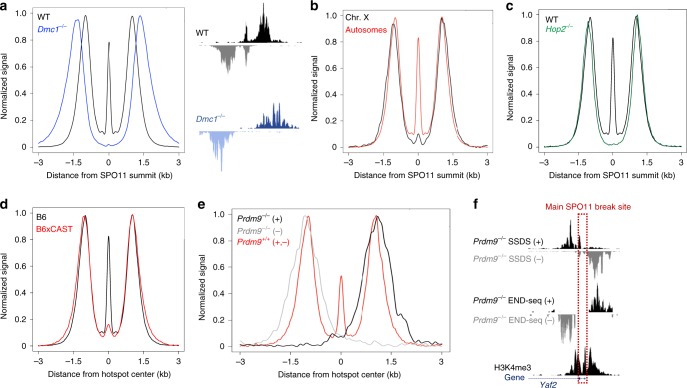
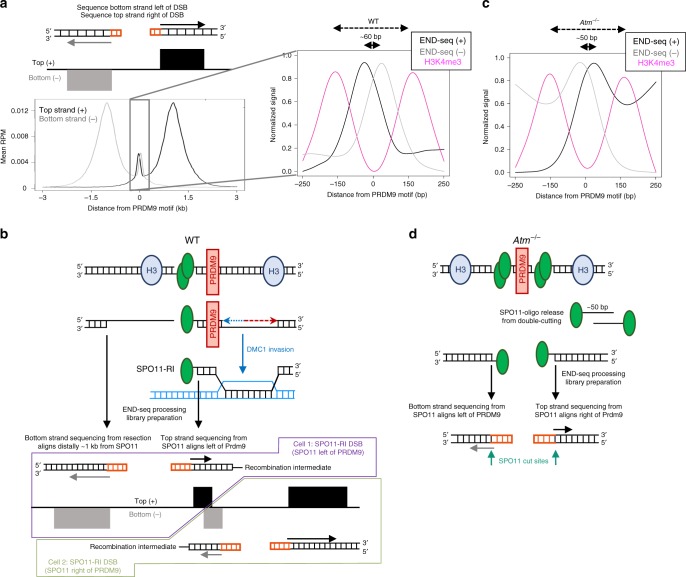
Meiotic recombination is initiated by SPO11-induced double-strand breaks (DSBs). In most mammals, the methyltransferase PRDM9 guides SPO11 targeting, and the ATM kinase controls meiotic DSB numbers. Following MRE11 nuclease removal of SPO11, the DSB is resected and loaded with DMC1 filaments for homolog invasion. Here, we demonstrate the direct detection of meiotic DSBs and resection using END-seq on mouse spermatocytes with low sample input. We find that DMC1 limits both minimum and maximum resection lengths, whereas 53BP1, BRCA1 and EXO1 play surprisingly minimal roles. Through enzymatic modifications to END-seq, we identify a SPO11-bound meiotic recombination intermediate (SPO11-RI) present at all hotspots. We propose that SPO11-RI forms because chromatin-bound PRDM9 asymmetrically blocks MRE11 from releasing SPO11. In Atm-/- spermatocytes, trapped SPO11 cleavage complexes accumulate due to defective MRE11 initiation of resection. Thus, in addition to governing SPO11 breakage, ATM and PRDM9 are critical local regulators of mammalian SPO11 processing.


Conflict of interest statement

The authors declare no competing interests.

Figures

Fig. 1
Fig. 1. SPO11 generates meiotic DSBs that are detectable by END-seq.
a Illustration of meiotic break generation and processing. SPO11 induces a double-strand break (DSB) and remains covalently bound to both DNA ends. MRE11 recognizes the DSB and induces a nick on the SPO11-bound strand. Tightly coordinated short-range 3′−5′ resection by MRE11 and long-range 5′−3′ resection by an unknown nuclease generates 3′ overhangs for homology search. MRE11 activity releases SPO11 bound to short oligonucleotides (SPO11 oligos). b Brief schematic of END-seq detection of SPO11 DSBs (only one side of the DSB is shown for simplicity). In vivo processing of SPO11 by coordinated bidirectional resection removes covalently bound SPO11 and produces a 3′ overhang present at the time of END-seq preparation and agarose cell embedding. Initial END-seq processing degrades all proteins by proteinase K and blunts ssDNA overhangs by in vitro nuclease digestion (dark blue). Once fully blunted and dA-tailed, the DNA end is ligated to a biotinylated Illumina sequencing adapter (orange), sheared, and streptavidin captured. A second Illumina adapter is ligated at the other end of the sonicated fragment after end repair and sequenced.
Fig. 2
Fig. 2. END-seq correlates with previous hotspot mapping techniques and uncovers a uniform pattern of SPO11 processing at all hotspots.
a Representative genome browser profiles of meiotic hotspots for SPO11-oligo sequencing, DMC1 SSDS, and END-seq. Browser axis scales are adjusted between techniques to show both hot and cold hotspots simultaneously. b Heatmaps of END-seq, SPO11-oligo, and SSDS ± 2.5 kb around hotspot centers (determined by SPO11-oligo summits), ordered by total read count of END-seq, for top 5000 END-seq breaks. WT END-seq peaks are provided in Supplementary Data 1. c Schematic of END-seq break pattern, consisting of (1) a central peak at the SPO11 break site (2) a read-less gap produced by MRE11-mediated short-range resection and minimum distance of long-range resection, and (3) distal reads at the terminal ends of long-range resection. This pattern is evident at individual hotspots (middle, chr1:68488000–68491500) and when signal from all hotspots is aggregated (bottom). Minimum resection lengths are calculated by the absence of sequencing reads (blue highlighted region); mean and maximum long-range resection are calculated by the average and most distal reads from the DSB, respectively (red highlighted region). d END-seq central peak and SPO11-oligo reads are coincident as evidenced by aggregated signal around SPO11-oligo summits (normalized to the same height). Both the primary SPO11 peak and adjacent secondary peaks are apparent. e Aggregate signal comparison of murine meiotic END-seq around SPO11-oligo summits and yeast meiotic S1-seq around yeast hotspot centers. f Aggregated END-seq and H3K4me3 ChIP-seq signal (normalized to the same height).
Fig. 3
Fig. 3. END-seq detects meiotic DSBs in a single mouse.
a Left panel: correlation (Pearson’s r) between END-seq RPKM from 20 mice versus RPKM from one 12 dpp mouse ± 3 kb around SPO11 summits. Right panel: Venn diagram overlap of called peaks between 20 mice and one mouse. P value < 2.2e-16, Fisher’s exact test. b Left panel: Full END-seq break pattern in aggregated signal from one mouse, centered around SPO11 oligos. Right panel: heatmap of END-seq signal from one mouse in a ± 3 kb window around SPO11 oligos, ordered by total read count. c FRiP values for 20 mice versus one mouse. Recommended ENCODE value denoted by dotted red line. d Cross-correlation plot profiles for 20 mice and one mouse. The plot shows Pearson cross-correlations (CCs, y axis) of read intensities between the plus strand and the minus strand, after shifting minus strand (x axis). One peak corresponds to read length (CCread, blue dash line) and the other one corresponds to the fragment length (CCfrag, red dash line). Normalized strand coefficient (NSC) is CCfrag divided by minimal CC value (CCmin) and relative strand coefficient (RSC) is the ratio of CCfrag-CCmin divided by CCread-CCmin. Higher NSC and RSC values mean more enrichment. ENCODE’s recommendation for ChIP-seq: NSC ≥ 1.05 and RSC ≥ 0.8.
Fig. 4
Fig. 4. END-seq accurately measures hotspot resection lengths and elucidates resection regulation.
a Top (+) and bottom (–) strand distributions of END-seq and SSDS show increased resection detection by END-seq (left, signal normalized to the same height) that is evident at individual hotspots (right). b Boxplot of END-seq vs SSDS maximum resection per hotspot. ****p < 1e-10; t test. c Correlation (Pearson’s r) of maximum resection endpoints detected by END-seq and SSDS. d Aggregate plot of END-seq signal in WT and Exo1–/– spermatocytes (signal normalized to the same height) around SPO11 oligos. e Boxplots of mean resection (as defined in Fig. 2c) between WT, Exo1–/–, 53bp1–/–Brca1Δ1153bp1–/–Brca1Δ1153bp1S25A and Brca1Δ11p53+/– at top 250 hotspots. *p < 0.01; ****p < 1e-10; t test with mu = 10 (mu is estimated as standard deviation of WT replicates). f Boxplots of maximum resection endpoints between WT, Dmc1–/–, and Hop2–/– at top 5000 hotspots. *p < 0.01; ****p < 1e-10; t test with mu = 43 (mu is estimated as standard deviation of WT replicates). g, h Histogram distributions comparing either WT and Dmc1–/– g or WT and Atm–/– h END-seq minimum and maximum resection endpoints at top 5000 hotspots. Mean values (bp) are listed.
Fig. 5
Fig. 5. ATM coordinates multiple levels of resection machinery.
a Aggregate plots of END-seq signal in WT vs Atm–/– at top 5000 WT breaks around SPO11-oligo summits. Signals are normalized to the same height for DSB pattern clarity. b Heatmaps of WT and Atm–/– END-seq ± 5 kb around SPO11-oligo summits for top 5000 WT hotspots. Signals are normalized to spike-in control to show increased Atm–/– break intensity per hotspot. c Illustrations of ATM’s multiple roles in coordinating resection that gives overall heterogeneous END-seq pattern in a. Left: MRE11 is recruited yet not activated in a subset of cells, resulting in reads directly at SPO11 DSB within the population. Middle: MRE11 is activated in another subset of cells, yet long-range resection is not sufficiently initiated, resulting in reads from only MRE11 nicking, and perhaps 3′−5′ exonuclease activity, flanking the DSB in regions that are read-less in WT. Right: resection is properly initiated in another subset of cells, yet long-range resection travels significantly farther than in WT. d Aggregated END-seq signal and MRE11 ChIP-seq RPM in WT (left) and Atm–/– (right). To fairly compare ChIP-seq signal between WT and Atm–/–, MRE11 scale is proportional to spike-in normalized END-seq RPM for each genotype. Individual hotspot examples (chr12:34,592,264-34,598,265) are shown below. Note that decreased MRE11 coverage is observed within NDR of Atm–/–. e Aggregate plot overlapping WT END-seq and Atm–/– MRE11 ChIP-seq, normalized to the same height. MRE11 shows prominent localization to the WT END-seq read-less gap.
Fig. 6
Fig. 6. WT and Atm–/– hotspots contain distinct species of DNA-bound SPO11.
a END-seq processing with ExoT blunting alone shows total absence of SPO11 central peak when signal is aggregated around SPO11-oligo summits (left). Heatmap of ExoT only signal ± 3 kb around hotspot centers, ordered by total read count of END-seq (right). b Pretreatment with purified human MRN + CtIP reduces ExoVII + ExoT central peak detection (red) over no pretreatment (NT, black) and depends on the presence of CtIP (blue). Both MRN and MRN + CtIP reactions were carried out in the presence of manganese. One 12 dpp mouse used per condition. c END-seq with ExoT blunting alone also shows no central peak in Atm–/– cells (black line). Pretreatment with purified human TDP2 before ExoT incubation recovers SPO11 signal, indicating abundance of unresected, bona fide SPO11 cleavage complexes (red line). Aggregate plot (left, normalized to same resection height) and heatmap (right) ±  3 kb around SPO11-oligo summits. d END-seq aggregate plot of WT ExoT blunting with (red line) and without (black line) TDP2 pretreatment shows only minor recovery of central peak signal.
Fig. 7
Fig. 7. WT central peak relies on homolog engagement and PRDM9.
a Aggregated END-seq signal around SPO11 oligos, with hotspot example, showing absence of SPO11 central peak in Dmc1–/–. b Reduction in central signal at non-PAR X chromosome hotspots; aggregated signal on ChrX compared with all autosomes. c Aggregated END-seq signal around SPO11 oligos showing absence of SPO11 central peak in Hop2–/–. d Aggregated END-seq signal of B6 (centered on B6 SPO11 oligos) versus B6xCAST hybrid (centered on hybrid SSDS hotspot centers). e Prdm9–/– END-seq signal aggregated around default SSDS hotspot centers at ~ 200 sites with least overlap in SSDS top and bottom strands. WT END-seq is centered around WT SPO11 oligos at PRDM9-dependent hotspots. f Prdm9–/– SSDS and END-seq tracks at a single default hotspot (Yaf2 gene) with minimal SSDS top and bottom strand overlap. Main SPO11 break site (red dotted line) is inferred from SSDS pattern. Aggregate plots in all panels are normalized to the same height for visual comparison.
Fig. 8
Fig. 8. Polarity of END-seq reads reflects distinct natures of SPO11 cutting and processing in WT and ATM-null cells.
a At fully processed and resected SPO11 DSBs, END-seq top and bottom strand reads exhibit a “correct” polarity to the right and left of the DSB, respectively (left). WT reads at the center of hotspots show a strand polarity that is reversed from what is expected (right, zoomed in at NDR). b PRDM9 as a barrier to SPO11 processing that results in a SPO11-bound recombination intermediate (SPO11-RI) structure. In WT, SPO11 cutting to one side of chromatin-bound PRDM9 within the NDR may block MRE11 activity on one side of the break, leaving SPO11 covalently bound to a short stretch of dsDNA, capping the DMC1-loaded ssDNA that extends ~ 1 kb from the NDR. SPO11-RI is sequenced starting from the first SPO11-bound nucleotide where an adapter is ligated. SPO11 that cut left of PRDM9 would result in top strand reads aligning to the left of the PRDM9 motif and bottom strand reads from fully resected ssDNA aligning at a distance away from the break site. c Atm–/– END-seq central reads have correct separated strand polarity within the NDR. d Unresected SPO11 double-cutting within the same hotspot in Atm–/– cells would show the correct polarity of top and bottom strands after adapter ligation to SPO11-bound DSBs and ~ 50 bp separation, as observed in c. Decreased MRE11 activity at these breaks would result in the direct sequencing of SPO11 cleavage complexes within the NDR rather than SPO11-RI in WT.

References

    1. Keeney S, Giroux CN, Kleckner N, Meiosis-specific DNA. double-strand breaks are catalyzed by Spo11, a member of a widely conserved protein family. Cell. 1997;88:375–384. doi: 10.1016/S0092-8674(00)81876-0. - DOI - PubMed
    1. Garcia V, Phelps SE, Gray S, Neale MJ. Bidirectional resection of DNA double-strand breaks by Mre11 and Exo1. Nature. 2011;479:241–244. doi: 10.1038/nature10515. - DOI - PMC - PubMed
    1. Zakharyevich K, et al. Temporally and biochemically distinct activities of Exo1 during meiosis: double-strand break resection and resolution of double Holliday junctions. Mol. Cell. 2010;40:1001–1015. doi: 10.1016/j.molcel.2010.11.032. - DOI - PMC - PubMed
    1. Bishop DK, Park D, Xu L, Kleckner N. DMC1: a meiosis-specific yeast homolog of E. coli recA required for recombination, synaptonemal complex formation, and cell cycle progression. Cell. 1992;69:439–456. doi: 10.1016/0092-8674(92)90446-J. - DOI - PubMed
    1. Joshi N, Brown MS, Bishop DK, Borner GV. Gradual implementation of the meiotic recombination program via checkpoint pathways controlled by global DSB levels. Mol. Cell. 2015;57:797–811. doi: 10.1016/j.molcel.2014.12.027. - DOI - PMC - PubMed

Publication types

MeSH terms