. 2020 Feb 12;10(1):2491.
doi: 10.1038/s41598-020-59268-w.

In vitro modeling of dendritic atrophy in Rett syndrome: determinants for phenotypic drug screening in neurodevelopmental disorders

Affiliations

In vitro modeling of dendritic atrophy in Rett syndrome: determinants for phenotypic drug screening in neurodevelopmental disorders

Elisa Nerli et al. Sci Rep. .

Abstract

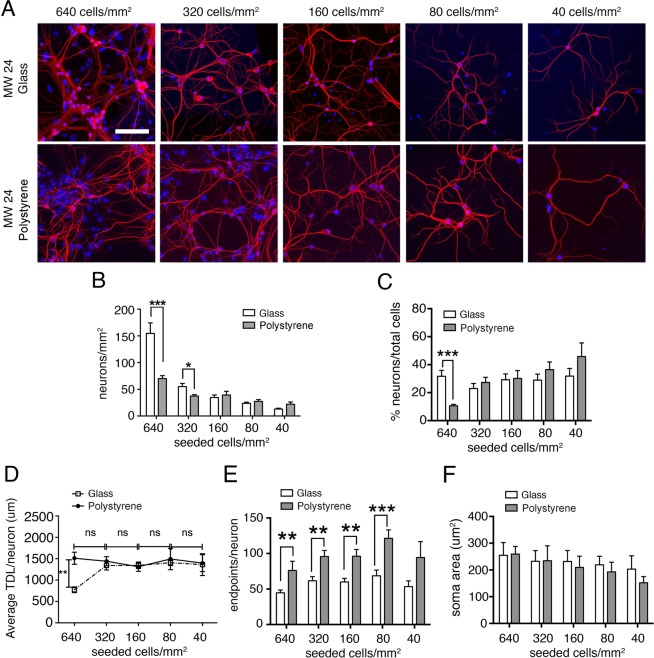
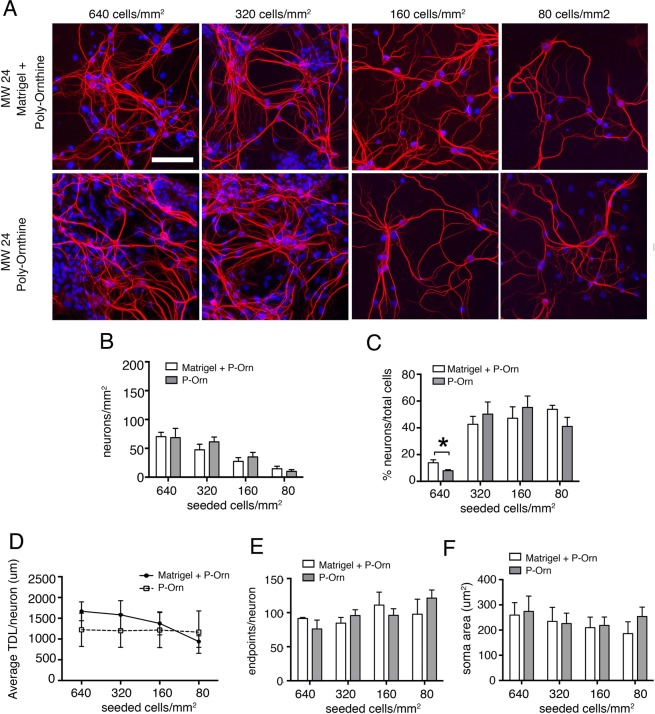
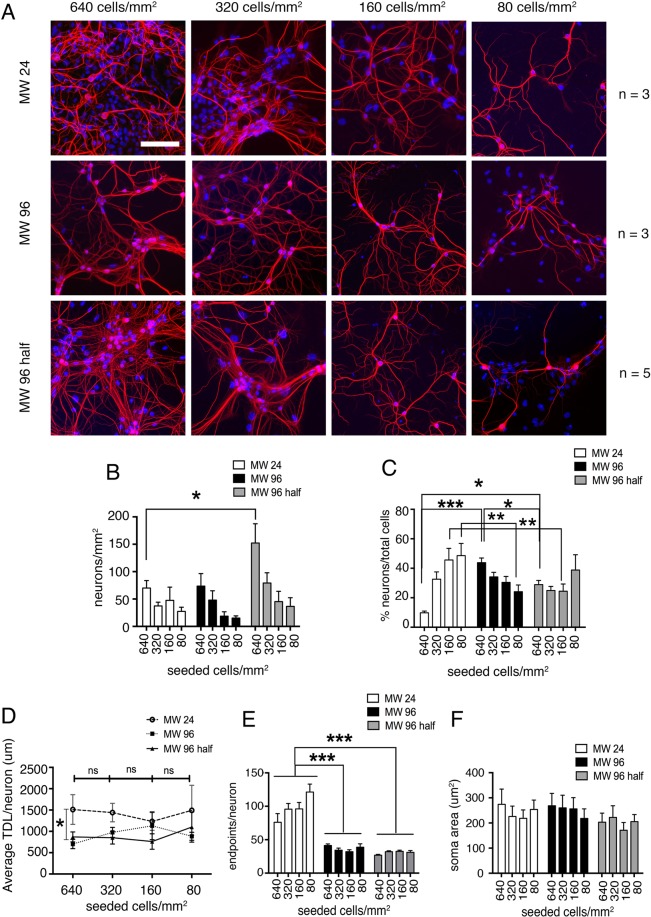
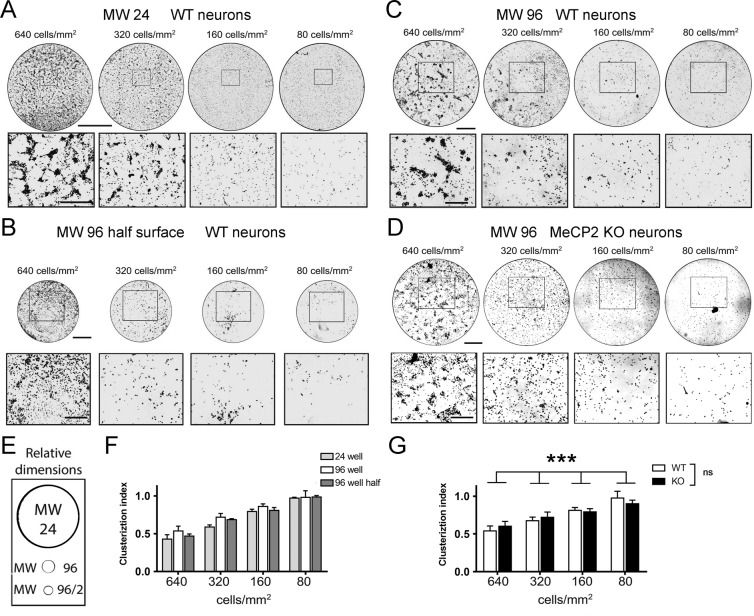
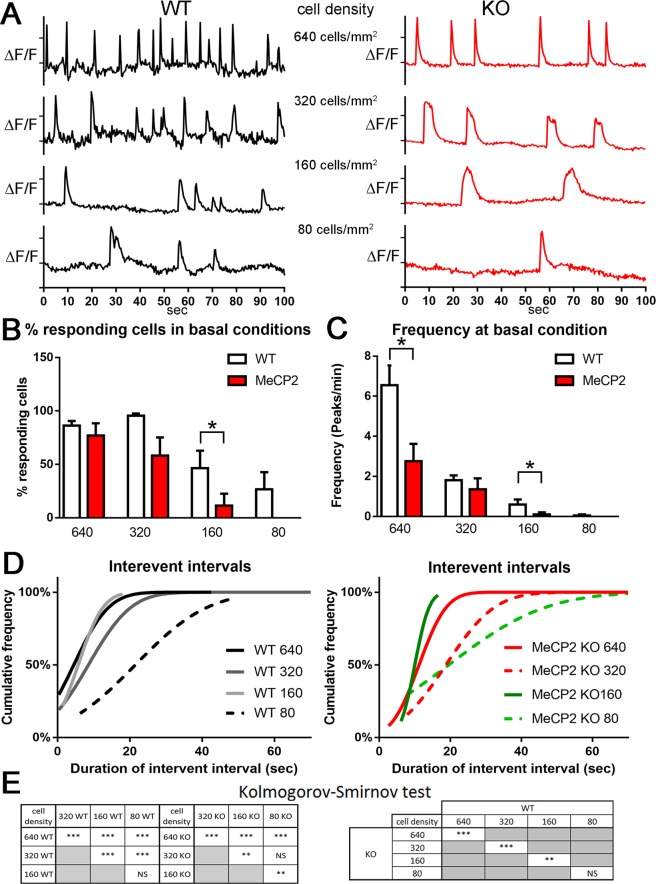
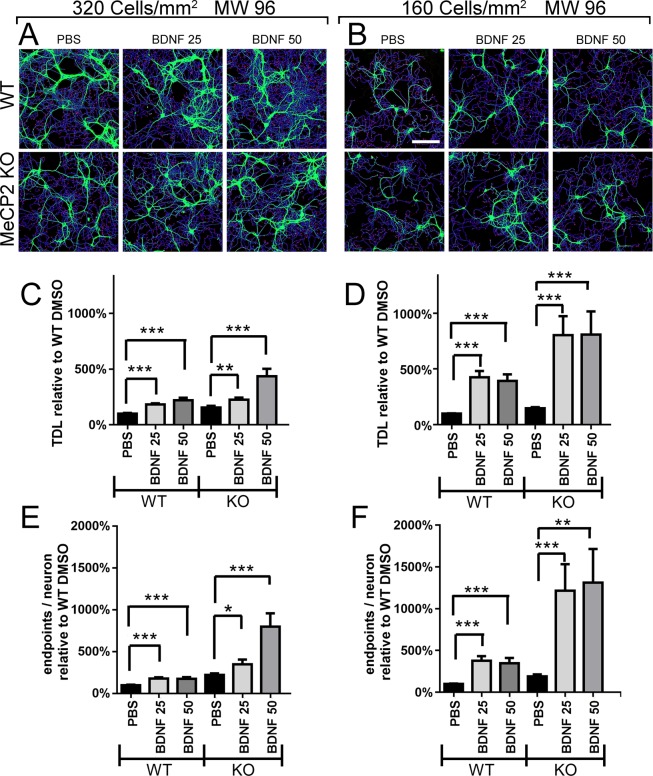
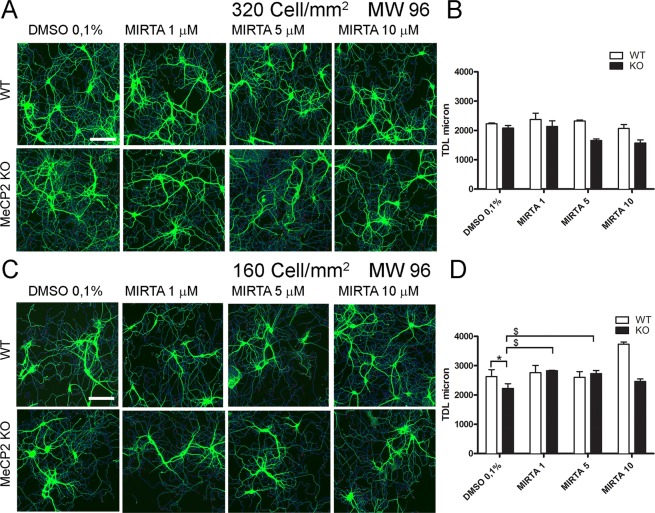
Dendritic atrophy, defined as the reduction in complexity of the neuronal arborization, is a hallmark of several neurodevelopmental disorders, including Rett Syndrome (RTT). RTT, affecting 1:10,000 girls worldwide, is mainly caused by mutations in the MECP2 gene and has no cure. We describe here an in vitro model of dendritic atrophy in Mecp2-/y mouse hippocampal primary cultures, suitable for phenotypic drug-screening. Using High-Content Imaging techniques, we systematically investigated the impact of culturing determinants on several parameters such as neuronal survival, total dendritic length, dendritic endpoints, soma size, cell clusterization, spontaneous activity. Determinants included cell-seeding density, glass or polystyrene substrates, coating with poly-Ornithine with/without Matrigel and miniaturization from 24 to 96-half surface multiwell plates. We show that in all plate-sizes at densities below 320 cells/mm2, morphological parameters remained constant while spontaneous network activity decreased according to the cell-density. Mecp2-/y neurons cultured at 160 cells/mm2 density in 96 multiwell plates, displayed significant dendritic atrophy and showed a marked increase in dendritic length following treatment with Brain-derived neurotrophic factor (BDNF) or Mirtazapine. In conclusion, we have established a phenotypic assay suitable for fast screening of hundreds of compounds, which may be extended to other neurodevelopmental diseases with dendritic atrophy.


Conflict of interest statement

The authors declare no competing interests.

Figures

Figure 1
Figure 1
Effect of glass or polystyrene substrates and cell-seeding density on dendrites of wild-type mouse hippocampal neurons. (A) DIV 12 mouse hippocampal neurons immunostained for dendrites cytoskeleton (MAP2, red) and nuclei (Hoechst, blue) plated at different seeding cell densities on glass coverslips (top lane) or polystyrene plates (bottom lane) (Scale bar = 100 µm). (B) Number of neurons per mm2 counted at DIV 12 for the different seeding cell densities. Data are expressed as mean ± SEM, n = 4 cultures per condition on glass, n = 3 cultures per condition on polystyrene. (C) Percentage of neurons (%) normalized on the number of counted viable nuclei (total cells), (D) average Total Dendritic Length (TDL) per neuron (µm), (E) average number of dendrites endpoints per neuron and (F) average neuronal soma area (µm2). Number of neurons measured ranged from 1000 for the highest seeded cell density, to 200 neurons for the lowest seeded cell density. Unpaired t-test to compare the different substrates at same cell density, *P ≤ 0.05, **P ≤ 0.01, ***P ≤ 0.001. One-way ANOVA was used to compare TDL, endpoints and soma area at different dilutions (D,E), ns = not significant difference.
Figure 2
Figure 2
Effect of different coating substrates on dendrites of wild-type mouse hippocampal neurons. (A) DIV 12 mouse hippocampal neurons immunostained for dendrites cytoskeleton (MAP2 red) and nuclei (Hoechst blue) at different seeding cell densities with different coatings, such as Matrigel and poly-L-Ornithine (top lane) or only poly-L-Ornithine (bottom lane) (Scale bar = 100 µm). (B) Quantitative data on the number of neurons per mm2 counted at the different seeding cell densities. Data are expressed as mean ± SEM, n = 3 cultures for each condition. (C) Number of neurons (%) normalized on the number of counted viable nuclei (total cells), (D) average TDL per neuron (µm), (E) average number of dendrites endpoints per neuron and (F) average neuronal soma area (µm2). Number of neurons measured ranged from 1000 for the highest concentration seeded to 200 neurons for the lowest concentration seeded. Unpaired t-test to compare the different coating substrates at same concentration, *P ≤ 0.05; One-way ANOVA to compare TDL, endpoints and soma area at different dilutions (D–F).
Figure 3
Figure 3
Effect of different well-size on dendrites of wild-type mouse hippocampal neuron. (A) DIV 12 mouse hippocampal neurons immunostained for dendrite cytoskeleton (MAP2 red) and nuclei (Hoechst blue) plated at different seeding cell densities in different polystyrene plates: MW 24 (top line), MW 96 (middle line) and MW 96 half-surface (bottom line). (Scale bar = 100 µm) (B) Quantitative data on the number of neurons per mm2 counted at the different seeding cell densities. Data are expressed as mean ± SEM, n = 3 cultures per condition on MW 24, n = 3 cultures per condition on MW 96 and n = 5 cultures per condition on MW 96 half. (C) Number of neurons (%) normalized on the number of counted viable nuclei (total cells), (D) Average TDL per neuron (µm), (E) average number of dendrite endpoints per neuron and (F) average neuronal soma area (µm2). Kruskal-Wallis test corrected for multiple comparisons (Dunn’s correction) on panel C. Two-way ANOVA corrected for multiple comparisons (Dunn’s correction) to compare the different plates and cellular densities (B–F). For both, P > 0.05, *P ≤ 0.05, **P ≤ 0.01, ***P ≤ 0.001.
Figure 4
Figure 4
Distribution of seeded cells within wells in 24 MW, 96 MW and 96MW-half surface plates. (A–D) Qualitative representation of the distribution of nuclei (Hoechst) in the entire well at the different cell densities of WT and Mecp2−/y (MeCP2 KO) hippocampal neuronal cultures at DIV 12. The upper panels show representative images of the wells (pictures show 90% of well surface), the bottom lanes show a close-up magnification in each condition. (A) Distribution of WT hippocampal neurons in 24 MW polystyrene plates. Scale bar = 5 mm for the well, 1 mm for the close-up. (B) Distribution of WT hippocampal neurons in 96 MW polystyrene plates. Scale bar = 1 mm for the well, 500 µm for the close-up. (C) Distribution of WT hippocampal neurons in polystyrene 96 MW half-surface plates. Scale bar = 1 mm for the well, 500 µm for the close-up. (D) Distribution of Mecp2−/y (MeCP2 KO) hippocampal neurons in 96 MW polystyrene plates. Scale bar = 1 mm for the well, 500 µm for the close-up. (E) Actual well dimensions. Relative proportions between panel B and C are retained, while panel A dimensions were reduced. (F) Cell Cluster Index for WT hippocampal cultures at the different seeding cell densities in the different plates. (G) Comparison of the Cell Cluster Index between WT and Mecp2−/y (KO) hippocampal cultures at the different seeding cell densities in 96 well plates. The statistical evaluation was performed using two-way ANOVA to compare the variables genotype and cellular density. n = 3 independent experiments for each cell density and multiwell type, ***P ≤ 0.001.
Figure 5
Figure 5
Effect of cell density on network activity measured by Ca2+ imaging analysis in WT and Mecp2−/y neurons. (A) Example of Calcium transients in WT (black traces on the left) and in Mecp2−/y (KO, red traces on the right) single neurons at each cell density, from the top: 640 cells/mm2, 320 cells/mm2, 160 cells/mm2, 80 cells/mm2. Fluorescence values of each pixel was normalized to the background fluorescence (ΔF/F). (B) Quantification of the % of responding WT (white columns) and Mecp2−/y (red columns) hippocampal neurons at basal condition at the different cell seeding densities. (C) Representation of number of peak per minute in WT (white columns) and Mecp2−/y neurons (red columns) at the different cell seeding densities. (D) Time during which Ca2+ channels remain close between two consequent peaks. Panels show the cumulative frequency of WT (left panel) and Mecp2−/y (MeCP2 KO, right panel) neurons plated at 640 cells/mm2, 320 cells/mm2 and 160 cells/mm2, 80 cells/mm2 (on the right) over the duration of inter-event interval (in seconds). (E) Summary of the statistical significance of the data shown in D using Kolmogorov-Smirnov non-parametric test. The left table summarize the differences between different cell densities for the indicated genotype (WO or KO), while the right panel reports the differences between WT and KO (Mecp2−/y) cultures at the same cell density. ***P < 0.001, **P < 0.01, *P < 0.05.
Figure 6
Figure 6
BDNF effects on TDL and endpoints. (A) NeuriteQuant morphological analysis of TDL (blue lines) and endpoints (red spots) of WT and MeCP2 KO DIV 12 mouse hippocampal neurons at 320 cells/mm2 (n = 3), and (B) 160 cells mm2 (n = 4) immunostained for dendrite cytoskeleton (MAP2 green). Both WT and MeCP2 KO neurons were treated (from left to right) with PBS, BDNF 25 ng/ml, BDNF 50 ng/ml for 3 days from DIV 9 to DIV 12. (C,E) Quantitative data of average TDL per neuron (µm) and average number of endpoints per neuron at 320 cells/mm2 and (D,F) 160 cells/mm2, respectively. N = 3 cultures, each in duplicate wells. Grubbs test for outlier detection and removal with significance level α = 0.05 (two-sided). One-way ANOVA with Dunnett’s multiple comparisons test vs PBS conditions. ***P < 0.001, **P < 0.01, *P < 0.05.
Figure 7
Figure 7
Mirtazapine treatment of Mecp2−/y hippocampal neurons. DIV 12 mouse hippocampal neurons immunostained for dendrite cytoskeleton (MAP2 green) plated at (A) 320 cells/mm2, and (C) 160 cells mm2 (n = 3). (B) Quantification of the effect of Mirtazapine on the average TDL of Mecp2−/y neurons seeded at 320 (n = 3) and (D) 160 (n = 3) cells/mm2. N = 3 separate experiments, each in duplicate wells. Grubb’s test for outlier detection and removal with significance level α = 0.05 (two-sided). ANOVA and Student’s t-test were used to compare the effect of the drug with vehicle (DMSO 0.1%): P ≤ 0.05 and **P ≤ 0.01.

References

    1. Kaufmann WE, Moser HW. Dendritic anomalies in disorders associated with mental retardation. Cerebral cortex. 2000;10:981–991. doi: 10.1093/cercor/10.10.981. - DOI - PubMed
    1. Kulkarni VA, Firestein BL. The dendritic tree and brain disorders. Molecular and cellular neurosciences. 2012;50:10–20. doi: 10.1016/j.mcn.2012.03.005. - DOI - PubMed
    1. Martinez-Cerdeno V. Dendrite and spine modifications in autism and related neurodevelopmental disorders in patients and animal models. Developmental neurobiology. 2017;77:393–404. doi: 10.1002/dneu.22417. - DOI - PMC - PubMed
    1. Copf T. Impairments in dendrite morphogenesis as etiology for neurodevelopmental disorders and implications for therapeutic treatments. Neuroscience and biobehavioral reviews. 2016;68:946–978. doi: 10.1016/j.neubiorev.2016.04.008. - DOI - PubMed
    1. Williamson SL, Christodoulou J. Rett syndrome: new clinical and molecular insights. European journal of human genetics: EJHG. 2006;14:896–903. doi: 10.1038/sj.ejhg.5201580. - DOI - PubMed

Publication types