. 2021 Apr;26(4):1194-1207.
doi: 10.1038/s41380-020-0676-x. Epub 2020 Feb 12.

Glial cell diversity and methamphetamine-induced neuroinflammation in human cerebral organoids

Affiliations

Glial cell diversity and methamphetamine-induced neuroinflammation in human cerebral organoids

Jason Dang et al. Mol Psychiatry. 2021 Apr.

Abstract

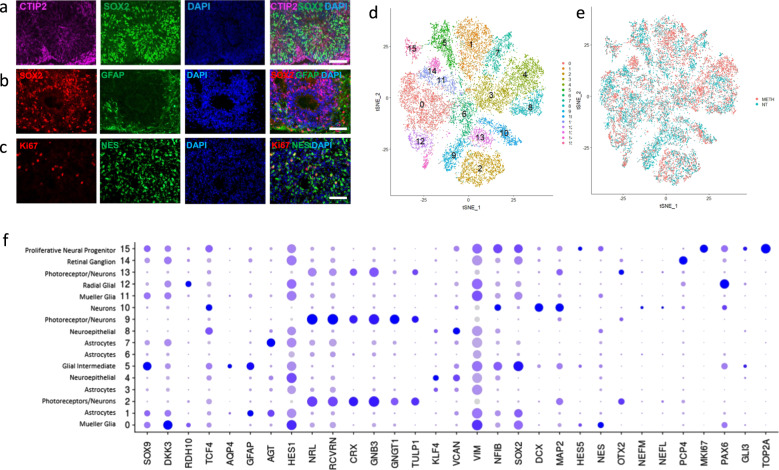
Methamphetamine (METH) is a potent stimulant that induces a euphoric state but also causes cognitive impairment, neurotoxicity and neurodevelopmental deficits. Yet, the molecular mechanisms by which METH causes neurodevelopmental defects have remained elusive. Here we utilized human cerebral organoids and single-cell RNA sequencing (scRNA-seq) to study the effects of prenatal METH exposure on fetal brain development. We analyzed 20,758 cells from eight untreated and six METH-treated cerebral organoids and found that the organoids developed from embryonic stem cells contained a diverse array of glial and neuronal cell types. We further identified transcriptionally distinct populations of astrocytes and oligodendrocytes within cerebral organoids. Treatment of organoids with METH-induced marked changes in transcription in multiple cell types, including astrocytes and neural progenitor cells. METH also elicited novel astrocyte-specific gene expression networks regulating responses to cytokines, and inflammasome. Moreover, upregulation of immediate early genes, complement factors, apoptosis, and immune response genes suggests a neuroinflammatory program induced by METH regulating neural stem cell proliferation, differentiation, and cell death. Finally, we observed marked METH-induced changes in neuroinflammatory and cytokine gene expression at the RNA and protein levels. Our data suggest that human cerebral organoids represent a model system to study drug-induced neuroinflammation at single-cell resolution.


Conflict of interest statement

TMR is a founder of ViRx Pharmaceuticals and has an equity interest in the company. The terms of this arrangement have been reviewed and approved by the University of California, San Diego in accordance with its conflict of interest policies.

Figures

Fig. 1
Fig. 1. Characterization of human cerebral organoids with single-cell resolution.
a Cerebral organoids immunostained for cortical neuronal marker CTIP2, neural stem cell marker Nestin, and DAPI show radial cortical layer organization around ventricle-like structures at 20×. Scale bar represents 100 μm. b Cerebral organoids immunostained for neural stem cell marker SOX2, astrocyte marker GFAP, and DAPI show glial and neural stem cell populations at 20×. Scale bar represents 100 μm. c Cerebral organoids immunostained for proliferation marker Ki67, neural stem cell marker Nestin, and DAPI show the presence of proliferating neural stem cells at 20×. Scale bar represents 100 μm. d t-distributed stochastic neighbor embedding (tSNE) plot of scRNA-seq data from eight untreated and six METH-treated cerebral organoids (10,135 cells from control organoids and 10,623 METH-treated cells after quality control filtering) generated by Seurat identified 16 distinct clusters. Cerebral organoids were treated with 5 μM methamphetamine for a week and analyzed by scRNA-seq. e t-distributed stochastic neighbor embedding (tSNE) plot of the same data as Fig. 1d, split by treatment, with red representing cells from METH treatment and blue presenting cells from the control. f Dot plot of canonical genes to classify tSNE clusters 0–15 (from Fig. 1d). Cluster identities are labeled on the left and canonical marker genes are located on the bottom. Darker shades of blue and size of dots represent greater expression of genes and percentage of cells expressing the gene.
Fig. 2
Fig. 2. Top genes up and downregulated by METH treatment.
a A heatmap with 48 downregulated genes as a response to METH treatment. The genes were found using Seurat to identify the markers that differed between the two treatment groups. The METH subset consists of all METH cells from all clusters together, represented as one group. b A heatmap with the top 50 upregulated genes identified as a response to METH treatment. The genes were found using Seurat to identify the markers that differed between the two treatment groups. The METH subset consists of all METH cells from all clusters together, represented as one group. c A dot plot of the 48 genes downregulated by meth treatment. Each cluster is divided by treatment, where blue dots represent cells from control organoid and red dots represent cells from METH-treated organoids. Darker shades of blue and red and size of dots represent greater expression of genes and percentage of cells expressing the gene. d A dot plot of the top 50 genes upregulated by meth treatment. Each cluster is divided by treatment, where blue dots represent cells from control organoid and red dots represent cells from METH-treated organoids. Darker shades of blue and red and size of dots represent greater expression of genes and percentage of cells expressing the gene.
Fig. 3
Fig. 3. METH treatment upregulates the genes related to inflammation, apoptosis and stress.
a A dot plot of the genes from the set of genes upregulated by METH (Fig. 2b) treatment identified by PANTHER to be related to apoptosis and cell death. Each cluster is divided by treatment, where blue dots represent cells from control organoid and red dots represent cells from METH-treated organoids. Darker shades of blue and red and size of dots represent greater expression of genes and percentage of cells expressing the gene. b A heatmap of the same genes from Fig. 3a separated by treatment, for a holistic view of the data. c A dot plot of the genes from the set of genes upregulated by METH (Fig. 2b) treatment identified by PANTHER to be related to stress. Each cluster is divided by treatment, where blue dots represent cells from control organoid and red dots represent cells from METH-treated organoids. Darker shades of blue and red and size of dots represent greater expression of genes and percentage of cells expressing the gene. d A heatmap of the same genes from Fig. 3c separated by treatment, for a holistic view of the data.
Fig. 4
Fig. 4. METH treatment induces neuroinflammation within cerebral organoids.
a Violin plots showing scRNA-seq expression of immune response genes (IFITM3, NFKBIA), immediate early response genes (JUNB), inflammatory genes (NLRP1), complement factor (C1S), and factors regulating immune system (B2M and A2M) genes in all clusters in control (NT) and METH-treated (METH) organoids. b Untreated (top row) and METH-treated (bottom row) cerebral organoids immunostained for astrocyte marker GFAP (green) and DAPI (blue). Scale bar represents and 100 µm. c Relative expression of IL-6 as measured by ELISA. Supernatant from control and METH-treated organoids was collected at 4, 8, and 24 h post treatment and analyzed by ELISA. IL-6 expression levels were normalized to early 4 h expression levels to account for differences in organoid volume and heterogeneity. **p value < 0.01. d Immunoblot of control (NT) and METH-treated whole organoid lysates (top) and monolayer neural stem cell-derived astrocytes (bottom) for NLRP1 and GAPDH after 1 week of treatment. e Untreated (top row) and METH-treated (bottom row) cerebral organoids immunostained for astrocyte marker GFAP (green), inflammasome component NLRP1 (red), and DAPI (blue). Scale bar represents 100 µm.
Fig. 5
Fig. 5. METH treatment attenuates neural stem cell proliferation and differentiation.
a Violin plots showing scRNA-seq expression of FOS, IGFBP3, HP, and PHLDA3 in all clusters in control (NT) and METH-treated (ME) organoids following 1 week of treatment. b Untreated (top row) and METH-treated (bottom row) cerebral organoids immunostained for neural stem cell marker Nestin (green), proliferation marker Ki67 (red) and DAPI (blue) after 1 week of treatment. Scale bar represents and 100 µm. c Untreated (top row) and METH-treated (bottom row) monolayer neural stem cells immunostained for BrdU (green), proliferation marker Ki67 (red) and DAPI (blue) after 1 week of treatment with 5 µM METH. Scale bar represents and 100 µm. d Quantification of BrdU+ Ki67+ neural stem cells in five fields at 20×. e Untreated (top row) and METH-treated (bottom row) monolayer neural stem cells immunostained for neuronal marker b-tubulin (green) and DAPI (blue) after 2 weeks of treatment with 5 µM METH during neural induction and neuronal differentiation. Scale bar represents 100 µm.

References

    1. Prakash MD, Tangalakis K, Antonipillai J, Stojanovska L, Nurgali K, Apostolopoulos V. Methamphetamine: effects on the brain, gut and immune system. Pharmacol Res. 2017;120:60–7. - PubMed
    1. Hsieh JH, Stein DJ, Howells FM. The neurobiology of methamphetamine induced psychosis. Front Hum Neurosci. 2014;8:537. - PMC - PubMed
    1. Gonzales R, Mooney L, Rawson RA. The methamphetamine problem in the United States. Annu Rev Public Health. 2010;31:385–98. - PMC - PubMed
    1. Chang L, Alicata D, Ernst T, Volkow N. Structural and metabolic brain changes in the striatum associated with methamphetamine abuse. Addiction. 2007;102(Suppl 1):16–32. - PubMed
    1. Du J, Quan M, Zhuang W, Zhong N, Jiang H, Kennedy DN, et al. Hippocampal volume reduction in female but not male recent abstinent methamphetamine users. Behav Brain Res. 2015;289:78–83. - PMC - PubMed

Publication types

Substances