. 2020 Feb;578(7796):605-609.
doi: 10.1038/s41586-020-1992-7. Epub 2020 Feb 12.

TLR9 and beclin 1 crosstalk regulates muscle AMPK activation in exercise

Affiliations

TLR9 and beclin 1 crosstalk regulates muscle AMPK activation in exercise

Yang Liu et al. Nature. 2020 Feb.

Abstract

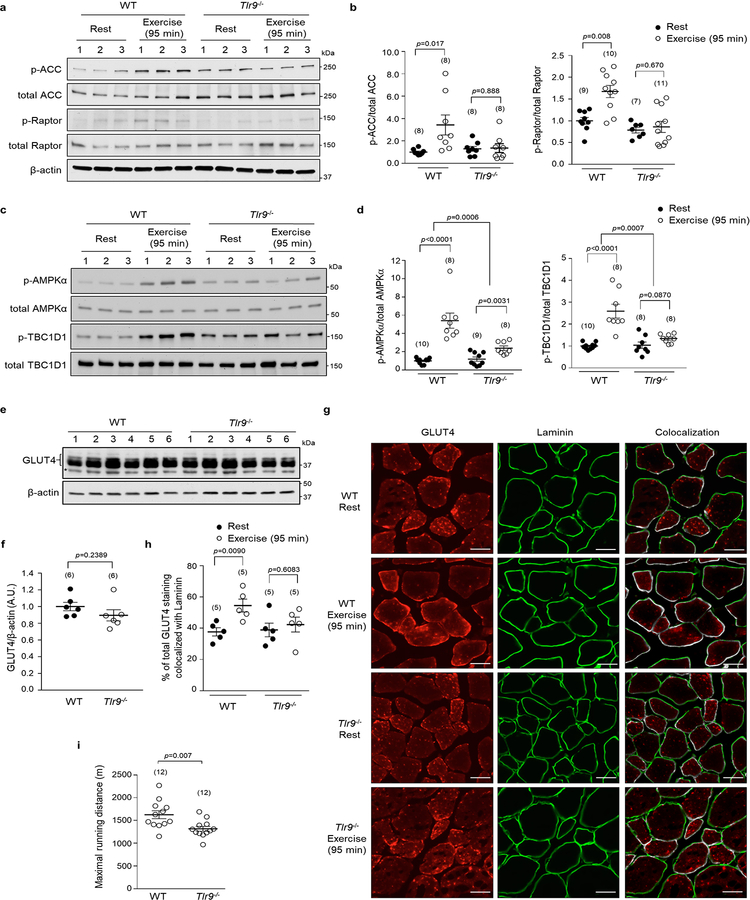
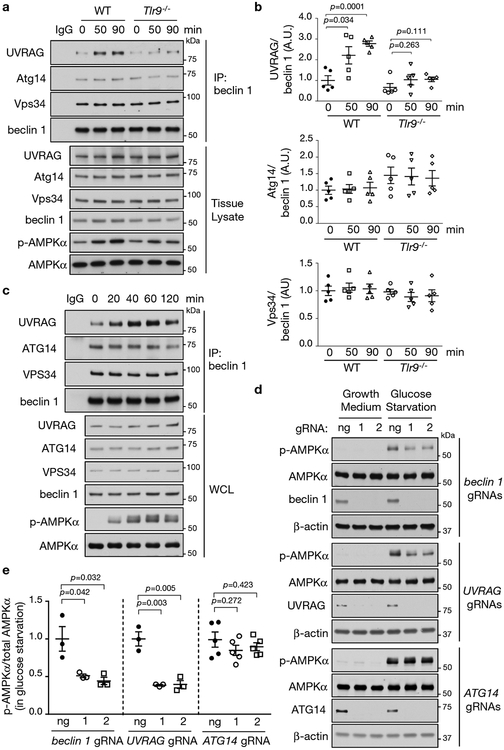
The activation of adenosine monophosphate-activated protein kinase (AMPK) in skeletal muscle coordinates systemic metabolic responses to exercise1. Autophagy-a lysosomal degradation pathway that maintains cellular homeostasis2-is upregulated during exercise, and a core autophagy protein, beclin 1, is required for AMPK activation in skeletal muscle3. Here we describe a role for the innate immune-sensing molecule Toll-like receptor 9 (TLR9)4, and its interaction with beclin 1, in exercise-induced activation of AMPK in skeletal muscle. Mice that lack TLR9 are deficient in both exercise-induced activation of AMPK and plasma membrane localization of the GLUT4 glucose transporter in skeletal muscle, but are not deficient in autophagy. TLR9 binds beclin 1, and this interaction is increased by energy stress (glucose starvation and endurance exercise) and decreased by a BCL2 mutation3,5 that blocks the disruption of BCL2-beclin 1 binding. TLR9 regulates the assembly of the endolysosomal phosphatidylinositol 3-kinase complex (PI3KC3-C2)-which contains beclin 1 and UVRAG-in skeletal muscle during exercise, and knockout of beclin 1 or UVRAG inhibits the cellular AMPK activation induced by glucose starvation. Moreover, TLR9 functions in a muscle-autonomous fashion in ex vivo contraction-induced AMPK activation, glucose uptake and beclin 1-UVRAG complex assembly. These findings reveal a heretofore undescribed role for a Toll-like receptor in skeletal-muscle AMPK activation and glucose metabolism during exercise, as well as unexpected crosstalk between this innate immune sensor and autophagy proteins.


Conflict of interest statement

Competing interests. B.L. is a Scientific Founder of Casma Therapeutics, Inc.

Figures

Extended Data Figure 1.
Extended Data Figure 1.. TLR7 and TLR9 interaction with beclin 1 and generation of Tlr9-HA knock-in (KI) mice.
(a, b) Co-immunoprecipitation of Flag-beclin 1 with TLR7-HA (a) or TLR9-HA (b) in transfected HeLa cells. (c) Co-immunoprecipitation of TLR9-HA with Flag-beclin 1 full-length (FL) or deletion mutant proteins in transfected U2OS cells. Flag-Beclin 1 Δaa244–266 is a control deletion mutant. (d) Co-immunoprecipitation of TLR9-HA FL protein or truncation mutant lacking the Toll/Interleukin-1 receptor (TIR) domain with Flag-beclin 1 in transfected U2OS cells. (e) MBP-pull-down of recombinant beclin 1 with an MBP-TLR9 TIR domain fusion protein. (f) Co-immunoprecipitation of indicated TLR9-HA constructs with indicated Flag-beclin 1 constructs in transfected U2OS cells cultured in normal media or subjected to 1 h glucose (-Glu) or amino acid (-AA) starvation. (g) Co-immunoprecipitation of TLR9-HA with Flag-Beclin 1 in transfected U2OS cells cultured in normal media, subjected to glucose starvation (-Glu, 1 h) or treatment for 1 h with mitochondrial damaging agents, oligomycin (2.5 μM) + antimycin A (250 nM) (OA) or carbonyl cyanide 3-chlorophenylhydrazone (CCCP) (5 μM), or direct AMPK activator, PF-739 (5 μM). For a-g, results representative of three independent experiments. (h) Tlr9 mRNA levels in different tissues. Value in lung is considered as 1. (i) Tlr9 mRNA levels in myoblasts and myotubes (i.e. before and after myocyte differentiation, respectively) normalized to β-actin levels. Value in myotubes is considered as 1. In h and i, data are mean ± s.e.m. of triplicate samples. (j) Schematic diagram of the Tlr9 locus and CRISPR-based gene knock-in strategy (see Methods section). (k) Representative genotyping of WT (+/+), heterozygous KI (+/KI) and homozygous KI (KI/KI) mice. (l) Western blots of Tlr9-HA expression in indicated tissues from mice (loading amount for spleen and lung = 20 μg and for heart and muscle = 50 μg). Full-length (FL) (~130 kd) and cleaved (~80 kd) Tlr9 detected in spleen. In muscles and heart, only predominant cleaved form of Tlr9 detected due to lower Tlr9 expression levels. Asterix denotes non-specific band. (m) Western blot indicating that FL and cleaved Tlr9 are detected in muscle lysates after enriching by immunoprecipitation with anti-HA antibody. For k-m, similar results observed in three independent experiments. For uncropped gels, see Supplementary Fig. 1.
Extended Data Fig. 2.
Extended Data Fig. 2.. Tlr9/beclin 1 interaction and AMPK phosphorylation increases in skeletal muscle but not in spleen during exercise.
(a) Representative western blots of endogenous beclin 1 co-immunoprecipitated with endogenous Tlr9-HA in vastus lateralis (VL) muscles from Tlr9-HA KI mice and WT mice (negative control) at indicated duration of exercise. Asterix, non-specific band also observed in WT mice. Similar results were observed in three independent experiments. (b) Quantitation of p-AMPKα (Thr172)/total AMPKα (representative blots are shown in Fig. 1b) in VL muscles from Tlr9-HA KI mice at indicated duration of exercise. Results are combined data from three independent experiments with similar results in each experiment. (c, d) Representative blots (c) and quantitation (d) of p-AMPKα (Thr172)/total AMPKα in the spleen of Tlr9-HA KI mice at indicated duration of exercise. Results are combined data from two independent experiments with similar results in each experiment. (e, f) Representative western blots (e) and quantitation (f) of beclin 1 co-immunoprecipitated with Tlr9-HA in spleens from Tlr9-HA KI mice at indicated duration of exercise. Results are combined data from two independent experiments with similar results in each experiment. In b, d and f, data points, individual mice (sample size indicated in parentheses). Data are mean ± s.e.m. Values at 0 min are considered as 1. In b, d, and f, unpaired two-tailed t-test with Hommel method. For uncropped gels, see Supplementary Fig. 1.
Extended Data Fig. 3.
Extended Data Fig. 3.. Levels of genomic DNA associated with Tlr9 in skeletal muscle; levels of plasma mitochondria DNA; and effects of exogenous Tlr9 ligand treatment on skeletal muscle AMPK phosphorylation.
(a) Real time PCR quantitation of genomic DNA bound to Tlr9. Shown are the cycle threshold (Ct) for genomic DNA that co-immunoprecipitates with Tlr9-HA from gastrocnemius muscles of WT or Tlr9−/−HA KI mice at rest or after 20 min exercise. Two sets of genomic DNA primers (see Methods section) were used. (b) Quantitation of mitochondrial DNA (mtDNA) in plasma at serial time points after exercise. The amount of mtDNA was quantified by qPCR using 6 sets of mtDNA primers (see Methods section). For each primer set, the value at the 0 min time point is considered as 1. In a and b, data are mean ± s.e.m., data points, individual mice, n=4. (c, d) Representative blots (c) and quantitation (d) of p-AMPK Thr172/total AMPK in extensor digitorum longus (EDL) muscles incubated ex vivo with 1 μM control ODN or ODN2395 (a TLR9 ligand) for 1 h. Data are mean ± s.e.m. Data points, individual muscles, n=3. Unpaired two-tailed t-test. Western blots from one representative experiment and quantitation data combined from three independent experiments. Similar results observed in each experiment. (e) Western blot of AMPK Thr172 phosphorylation in EDL muscles incubated with or without 1 μM PF-739 (a direct AMPK activator) for 1 h. PF-739 is a positive control for experiments in c and d with respect to AMPK activation in EDL muscles ex vivo. Similar results observed in three independent experiments. For uncropped gels, see Supplementary Fig. 1.
Extended Data Fig. 4.
Extended Data Fig. 4.. Wild-type and Tlr9−/− mice display similar muscle characteristics and cardiac function.
(a, b) Representative H&E staining (a) and fiber type staining (b) of tibialis anterior (TA) muscles. In b, green, plasma membrane marker (Laminin); pink, type I fibers (MHC I positive); red, type IIa fibers (MHC IIa positive); blue, type IIb fibers (MHC IIb positive); black, type IIx fibers. (c) Relative quantitation of fiber type composition in TA muscles shown in b. Data are mean ± s.e.m. At least 1400 muscle fibers per mouse. (d, e) Representative images (d) and quantitation (e) of staining for cytochrome C oxidase (COX) enzymatic activity (a measure of mitochondrial respiratory capacity) in TA muscles. Data are mean ± s.e.m. At least 480 muscle fibers per mouse. (f, g) Representative images (f) and quantitation (g) of capillary density in TA muscles. Data are mean ± s.e.m. At least 240 muscle fibers per mouse. (h) Cardiac function determined by echocardiographic measurement of ejection fraction. For a, b, d and f, images are representative from one of two independent experiments. Similar results observed in each experiment. Data are mean ± s.e.m. For c, g and h, data points, individual mice. N=5 mice per group for c, e and h, and n=4 mice per group for g. Unpaired two-tailed t-test. Scale bars, 50 μm.
Extended Data Fig. 5.
Extended Data Fig. 5.. Measurement of exercise-induced muscle AMPK activation, exercise-induce muscle GLUT4 plasma membrane localization, and maximal running distance in wild-type and Tlr9−/− mice.
(a, b) Representative western blots (a) and quantitation (b) of phosphorylation of AMPK substrates (ACC Ser79 and Raptor Ser792) in VL muscles. The samples in (a) and (b) are the same as those used in Fig. 2a and 2b of the main text. (c, d) Representative western blots (c) and quantitation (d) of p-AMPK and p-TBC1D1 in EDL muscles. (e, f) Western blots (e) and quantitation (f) of GLUT4 levels in EDL muscles. Asterix denotes a non-specific band. (g) Representative images of GLUT4 (red) and Laminin (green) immunofluorescent staining (used for quantitation in h and Fig. 2d of main text) in EDL muscles. White denotes colocalization between GLUT4 and Laminin determined by ImageJ software. Scale bars, 20 μm. (h) Percentage of total GLUT4 staining colocalized with Laminin calculated by ImageJ software. At least 100 muscle fibers per mouse. (i) Maximal running distance. Data are combined from three independent experiments. Similar results observed in each experiment. For b, d, f, h, and i, data are mean ± s.e.m., data points, individual mice, sample size indicated in parentheses. In a, b, c d, g and h, western blots and images are one representative experiment and quantitation are combined data from three independent experiments. Similar results were observed in each experiment. In b, d and h, two-tailed t-test to compare different conditions for each genotype and two-way ANOVA to compare magnitude of changes between different conditions in mice of different genotypes. In f and i, unpaired two-tailed t-test. For uncropped gels, see Supplementary Fig. 1.
Extended Data Fig. 6.
Extended Data Fig. 6.. Similar levels of adenine nucleotides, glycogen, total LKB1 and LKB1 Ser428 phosphorylation and similar response to AMPK allosteric activator in WT and Tlr9−/− muscles.
(a-e) Measurements of ATP (a), ADP (b), AMP (c), ADP/ATP ratio (d) and AMP/ATP ratio (e) in EDL muscles. (f) Glycogen content in TA muscles. (g, h) Representative western blots (g) and quantitation (h) of p-LKB1 Ser428 and total LKB1 in VL muscles. Representative blots are from one experiment and quantitation data are combined from three independent experiments. Similar results were observed in each experiment. (i, j) Representative western blots (i) and quantitation (j) of AMPK activation markers (p-AMPK, p-TBC1D1) in TA muscles of mice 90 min after subcutaneous administration of PF-739 (100mg/5ml/kg body weight). (k) Blood glucose levels 90 min after PF-739 treatment. In i, j and k, western blots are from one representative experiment and quantitation results are combined data from two independent experiments. Similar results were observed in each experiment. Data points, individual mice, sample size indicated in parentheses. Data are mean ± s.e.m. Unpaired two-tailed t-test. For uncropped gels, see Supplementary Fig. 1.
Extended Data Fig. 7.
Extended Data Fig. 7.. Hematopoietic cells are not responsible for the defect in exercise-induced AMPK activation in Tlr9−/− muscles and Tlr9 is required for ex vivo electrical stimulation-induced AMPK activation.
(a, b) Percentage of WT Tlr9 genome (a) or Tlr9−/− genome (b) in blood cells from mice with indicated donor or recipient genotypes at 8 weeks after bone marrow transplantation as determined by real-time q-PCR. Copy number of Tlr7 genome is internal control. Data are mean ± s.e.m. for five randomly selected mice per group. Data points, individual mice. The mean of WT/WT (a) or Tlr9−/−/Tlr9−/− (b) donor/recipient combinations was considered as 100%. (c, d) Representative western blots (c) and quantitation (d) of TBC1D1 Ser237 phosphorylation in VL muscles of indicated recipient mice transplanted with indicated bone marrow cells at rest and after 90 min exercise. (e, f) Representative western blots (e) and quantitation (f) of TBC1D1 Ser237 phosphorylation in EDL muscles of mice +/− 20 min electrical stimulation. In c-f, western blots are from one representative experiment and quantitation results are combined data from three independent experiments. Similar results were observed for each experiment. Data points, individual mice (d) or muscles (f), sample size indicated in parentheses. Data are mean ± s.e.m. In d, unpaired two-tailed t-test to compare differences between donor genotypes; two-way ANOVA for differences between recipient genotypes. In f, unpaired two-tailed t-test to compare +/−electrical stimulation conditions for each genotype. Two-way ANOVA to compare the magnitude of changes between +/− electrical stimulation conditions in muscles of different genotypes. For uncropped gels, see Supplementary Fig. 1.
Extended Data Fig. 8.
Extended Data Fig. 8.. Tlr9−/− mice have normal exercise-induced autophagy and BCL2 binding to beclin 1 inhibits exercise- and glucose starvation-induced beclin 1/Tlr9 interaction.
(a, b) Representative images (a) and quantitation (b) of GFP-LC3 puncta in VL muscles of WT;GFP-LC3 and Tlr9−/−;GFP-LC3 mice at rest or after exercise +/− chloroquine pretreatment. Scale bars, 20 μm. Arrows, representative puncta counted in b. More than 15 randomly chosen fields were used per mouse and an average value was determined for each mouse. Images are from one representative experiment and quantitative data are combined results of two independent experiments. Similar results observed in each experiment. Data points, individual mice (sample size in parentheses). (c, d) Representative western blots (c) and quantitation (d) of beclin 1 co-immunoprecipitated with Tlr9-HA at serial time points after exercise in VL muscles of Tlr9-HA KI mice crossed to either BCL2 AAA mice or WT BCL2 littermates. Western blots are from one representative experiment and quantitation data are combined results from three independent experiments. Similar results observed in each experiment. Data points, individual mice (sample size in parentheses). (e) Co-immunoprecipitation of transiently expressed Flag-beclin 1 with Myc-BCL2 in HeLa/BCL2 or HeLa/BCL2AAA cells grown in normal media or subjected to 2 h glucose starvation. Similar results were observed in three independent experiments. (f, g) Representative western blots (f) and quantitation (g) of Flag-beclin 1 co-immunoprecipitated with Tlr9-HA in HeLa/BCL2 or HeLa/BCL2AAA cells grown in normal media or subjected to 2 h glucose starvation. Data are mean ± s.e.m. from three experiments; sample size indicated in parentheses. In b, unpaired two-tailed t-test to compare different conditions for each genotype. Two-way ANOVA to compare magnitude of changes between different conditions in mice of different genotypes. In d, one-way ANOVA to compare 0 min and 20 min exercise conditions for each genotype. Two-way ANOVA to compare the magnitude of changes between 0 min and 20 min exercise conditions in mice of different genotypes. In g, unpaired two-tailed t-test. For uncropped gels, see Supplementary Fig. 1.
Extended Data Fig. 9.
Extended Data Fig. 9.. Beclin 1 and UVRAG interaction increases during exercise and electrical stimulation-induced muscle contraction.
(a, b) Representative blots (a) and quantitation (b) of UVRAG co-immunoprecipitated with beclin 1 in TA muscles of mice at indicated duration of exercise. Western blots are from one representative experiment and quantitation data are combined results from five independent experiments. Similar results observed in each experiment (c, d) Representative blots (c) and quantitation (d) of beclin 1 co-immunoprecipitated with UVRAG in EDL muscles of mice +/− 20 min electrical stimulation. Western blots are from one representative experiment and quantitation data are combined results from two independent experiments. Similar results observed in each experiment. In b and d, data points, individual mice (b) or muscle (d), sample size indicated in parentheses. Data are mean ± s.e.m. In b, unpaired two-tailed t-test. In d, two-tailed t-test to compare +/− electrical stimulation conditions for each genotype. Two-way ANOVA to compare the magnitude of changes +/− electrical stimulation conditions in muscles of different genotypes. Asterix, non-specific band observed in IgG control condition. For uncropped gels, see Supplementary Fig. 1.
Extended Data Fig. 10.
Extended Data Fig. 10.. Beclin 1, UVRAG, or ATG14 knockout does not affect LKB1 protein levels or glucose starvation-induced LKB1 Ser428 phosphorylation.
Effects of beclin 1 (a), UVRAG (b), or ATG14 (c) knockout in U2OS cells on LKB1 protein levels and LKB1 Ser428 phosphorylation 1 h after glucose starvation. Left panels, representative western blots of p-LKB1, total LKB1 and total AMPKβ in cells with indicated gene knockout (two independent gRNAs per target gene). Right panels, quantitation of total LKB1/total AMPKβ (from 4 independent experiments) and p-LKB1/total LKB1 (from 3 independent experiments). Similar results observed in each experiment. Data are mean ± s.e.m. Sample size indicated in parentheses. Unpaired two-tailed t-test. ng, no gRNA. For uncropped gels, see Supplementary Fig. 1.
Figure 1.
Figure 1.. TLR9 interacts with beclin 1 during glucose starvation and exercise.
(a) Co-immunoprecipitation of transfected TLR9-HA with endogenous beclin 1 in U2OS cells cultured in normal or glucose starvation media (1 h). Results representative of three independent experiments. (b, c) Representative western blots (b) and quantitation (c) of beclin 1 co-immunoprecipitated with Tlr9-HA in vastus lateralis (VL) muscles from Tlr9-HA knock-in (KI) mice at indicated duration of exercise. See Extended Data Fig. 2b for p-AMPKα (Thr172)/total AMPKα quantitation. Data are mean ± s.e.m. Unpaired two-tailed t-test with Hommel method. Values at 0 min considered as 1, results expressed as relative arbitrary units (A.U.) and are combined data from three independent experiments. Similar results observed in each experiment. (d) Quantitation of mitochondrial DNA (mtDNA) co-immunoprecipitated with Tlr9-HA from gastrocnemius muscles (Methods). For each mtDNA primer set, value of WT resting considered as 1. Data are mean ± s.e.m. Two-tailed Mann-Whitney test. For c and d, data points, individual mice (sample size indicated in parentheses). WCL, whole cell lysate. For uncropped gels, see Supplementary Fig. 1.
Figure 2.
Figure 2.. Tlr9 is required for exercise-induced muscle AMPK activation.
(a, b) Representative western blots (a) and quantitation (b) of p-AMPK(Thr172) and p-TBC1D1(Ser237) in VL muscles. (c, d) Representative images of GLUT4 staining in VL muscles (c) and quantitation (d) of GLUT4/Laminin colocalization in extensor digitorum longus (EDL) muscles (see Extended Data Fig. 5g for EDL representative images). At least 100 muscle fibers per mouse. Arrow, Glut4 localization at plasma membrane. Scale bars, 20 μm. (e) Blood glucose levels. (f, g) Representative western blots (f) and quantitation (g) of AMPK phosphorylation in VL muscles from indicated recipient mice transplanted with indicated donor bone marrow. (h, i) Representative western blots (h) and quantitation (i) of AMPK phosphorylation in EDL muscles. (j) Glucose uptake in EDL muscles. Western blots and images from one representative experiment and quantitation data combined from three independent experiments. Similar results observed for each experiment. In b, d, e, g, i and j, data points, individual mice (b, d, e, g) or muscles (i, j), sample size indicated in parentheses. Data are mean ± s.e.m. In b, d, e, i and j, unpaired two-tailed t-test to compare different conditions per genotype. Two-way ANOVA for magnitude of changes between different conditions in mice of different genotypes. In g, unpaired two-tailed t-test for differences between donor genotypes for each recipient genotype and two-way ANOVA for differences between recipient genotypes. For uncropped gels, see Supplementary Fig. 1.
Figure 3.
Figure 3.. TLR9 is required for beclin 1/UVRAG interaction during exercise.
(a) Co-immunoprecipitation of UVRAG, Atg14 or Vps34 with beclin 1 in tibialis anterior muscles (TA) at indicated duration of exercise. Tissue lysate from WT 0 min sample used for control IgG precipitation. (b) Quantitation of co-immunoprecipitation of UVRAG, Atg14 and Vps34 with beclin 1 in three independent experiments using design shown in (a). Data points, individual mice (n=5). Data are mean ± s.e.m. Unpaired two-tailed t-test comparing 50 min or 90 min exercise versus 0 min condition for each genotype. (c) Co-immunoprecipitation of UVRAG, ATG14 or VPS34 with beclin 1 in U2OS cells at indicated time points after glucose starvation. Similar results observed in three independent experiments. (d, e) Representative blots (d) and quantitation (e) of effects of indicated gene knockout on AMPK activation in U2OS cells cultured in normal or glucose starvation media (1 h). Two independent gRNAs per gene target. Quantitation data from 3 (beclin 1 gRNAs, UVRAG gRNAs) or 5 (ATG14 gRNAs) independent experiments. Data are mean ± s.e.m. Unpaired two-tailed t-test. ng, no gRNA. For uncropped gels, see Supplementary Fig. 1.

Comment in

References

    1. Kjobsted R et al. AMPK in skeletal muscle function and metabolism. FASEB J 32, 1741–1777 (2018). - PMC - PubMed
    1. Levine B & Kroemer G Biological functions of autophagy genes: A disease perspective. Cell 176, 11–42 (2019). - PMC - PubMed
    1. He C et al. Exercise-induced BCL2-regulated autophagy is required for muscle glucose homeostasis. Nature 481, 511–515 (2012). - PMC - PubMed
    1. Pandey S, Kawai T & Akira S Microbial sensing by Toll-like receptors and intracellular nucleic acid sensors. Cold Spring Harb Perspect Biol 7, a016246 (2014). - PMC - PubMed
    1. Wei Y, Pattingre S, Sinha S, Bassik M & Levine B JNK1-mediated phosphorylation of Bcl-2 regulates starvation-induced autophagy. Mol Cell 30, 678–688 (2008). - PMC - PubMed