. 2020 Feb;578(7796):621-626.
doi: 10.1038/s41586-020-1998-1. Epub 2020 Feb 12.

Mechanical regulation of glycolysis via cytoskeleton architecture

Affiliations

Mechanical regulation of glycolysis via cytoskeleton architecture

Jin Suk Park et al. Nature. 2020 Feb.

Abstract

The mechanics of the cellular microenvironment continuously modulates cell functions such as growth, survival, apoptosis, differentiation and morphogenesis via cytoskeletal remodelling and actomyosin contractility1-3. Although all of these processes consume energy4,5, it is unknown whether and how cells adapt their metabolic activity to variable mechanical cues. Here we report that the transfer of human bronchial epithelial cells from stiff to soft substrates causes a downregulation of glycolysis via proteasomal degradation of the rate-limiting metabolic enzyme phosphofructokinase (PFK). PFK degradation is triggered by the disassembly of stress fibres, which releases the PFK-targeting E3 ubiquitin ligase tripartite motif (TRIM)-containing protein 21 (TRIM21). Transformed non-small-cell lung cancer cells, which maintain high glycolytic rates regardless of changing environmental mechanics, retain PFK expression by downregulating TRIM21, and by sequestering residual TRIM21 on a stress-fibre subset that is insensitive to substrate stiffness. Our data reveal a mechanism by which glycolysis responds to architectural features of the actomyosin cytoskeleton, thus coupling cell metabolism to the mechanical properties of the surrounding tissue. These processes enable normal cells to tune energy production in variable microenvironments, whereas the resistance of the cytoskeleton in response to mechanical cues enables the persistence of high glycolytic rates in cancer cells despite constant alterations of the tumour tissue.


Figures

Extended Data Figure 1.
Extended Data Figure 1.. Mechanical modulation of cell metabolism.
a, Shear moduli of soft substrates during liquid-to-solid gelation over the course of 60 min, shown as storage modulus (G’) and loss modulus (G’’). Time = 0 min indicates the start of the time sweep. The experiment was repeated 7 times over two separate days (distinct color for each experiment). b, Shear moduli of pre-formed soft substrates over the course of an additional 60 min, shown as storage modulus (G’) and loss modulus (G’’). Time = 0 min indicates the completion of 60 min of incubation at 37°C for gelation and the start of a second 60 min time sweep. The experiment was repeated twice (distinct color for each repeat). The shear modulus increased rapidly and reached a plateau within 5 min, with a 6-fold difference between storage modulus (G’) and loss modulus (G’’). Although the substrates are soft, this ratio indicates the formation of stable elastic hydrogels . c, Left, representative images of calcein AM (green) and ethidium homodimer (red) staining of HBEC76 on stiff and soft substrates. Scale bar, 50 μm. Right, fraction of calcein AM-positive cells relative to the combined count of calcein AM-positive and ethidium homodimer-positive cells on stiff (n = 50 images) and soft (n = 50) substrates from a single imaging experiment. Individual data points indicate fractions per image. d, Metabolomic profiling of HEBC76 on stiff and soft substrates (n = 3 independent cultures per substrate stiffness). Metabolic profiling was performed once. e, Volcano plot of metabolic shifts between substrates derived from Extended Data Fig. 1d. Each dot shows the average ratio in metabolite concentration between stiff and soft substrates vs. P values, based on three independent cultures. Vertical dotted line, log2 -fold change = ±0.5; horizontal dotted line, P value = 0.05). f, Glycolytic rates, normalized to cell number, of HBEC30 and 34 on stiff and soft substrates. g, Fraction enrichment of 13C-labeled lactate synthesized from uniformly labeled D-13C-glucose. M, no 13C-labeling; M+1, one 13C-labeling; M+2, two 13C-labeling; M+3, three 13C-labeling. Data are shown as mean ± s.e.m. of three independent experiments. h, Glycolytic pathway illustrating enzymes tested in Fig. 1d. PFKP, PFKL, and PFKM are highlighted in red. i, Verification of the specificity of PFK isoform-targeting (P, platelet; L, liver; M, muscle) antibodies. GFP-tagged PFK was expressed in HEK cells for each isoform and immunoblotting was performed. The experiment was performed once. j, PFK activity normalized by protein abundance on stiff and soft substrates. Data are shown as mean ± s.e.m. The experiment was performed once with three technical repeats per substrate stiffness. k, Abundance of PFKFB2 and PFKFB3 in HBEC76 per substrate stiffness. Representative data from three independent experiments. l, Normalized expression of PFKP, PFKL, and PFKM in human bronchial epithelium. Data of two replicates shown as the mean obtained from BioGPS: PFKP (#201037), PFKL (#201102), PFKM (#201102). m, Abundance of PFKP on stiff and soft substrates in head/neck epithelial cell line, HHN2. The experiment was performed once. n, Normalized expression of glycolytic genes ranked according to oncogenic enrichment. PFKP is highlighted in red; GLUT1, PFKL, and PFKM shown in black. o, Effect of oncogenic transformation of HBEC3 on oxidative phosphorylation (OXPHOS) rates on stiff and soft substrates. Data are normalized to cell number. p, Glycolytic rates, normalized to cell number, of NSCLCs (H2009, H1819, and HCC827) on stiff and soft substrates. q, Abundance of PFKP in H2009, H1819, and HCC827 on stiff and soft substrates. The experiment was performed once. Data in f, o, p are from three independent experiments, shown as mean ± s.e.m. Statistical significance was assessed using two-tailed Mann-Whitney test (c), unpaired multiple t-test (e) or two-tailed Student’s t-test (f, g, j, o, p). Protein abundance was normalized to the abundance of GAPDH (k, m, q).
Extended Data Figure 2.
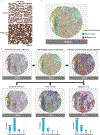
Extended Data Figure 2.. Analytic workflow of immunohistochemistry (IHC) staining of PFKP.
a, HBEC76 cell pellets (control vs. PFKP-GFP overexpression) stained with PFKP antibody used for subsequent IHC analysis. The experiment was performed once. b, Microphotograph showing annotated areas of malignant cells (red), tumor stroma (green), and normal bronchial epithelium (yellow) using HALO v2.3 software in a tissue microarray (TMA) core of lung cancer tumor tissue. c, Microphotographs showing the workflow for image analysis using HALO v2.3 software. From left to right, top to bottom: PFKP staining in a TMA core with lung adenocarcinoma and bronchial epithelium; Halo mark-up image showing the compartments analyzed, bronchial epithelium in yellow, tumor stroma in green and malignant cells in red; Halo mark-up images showing the image analysis using the Halo algorithm to detect cells with PFKP cytoplasmic IHC expression per bronchial epithelium, tumor stroma, and malignant cells. Column charts show frequencies of different levels of expression (0, 1+, 2+, 3+) of PFKP per tissue type.
Extended Data Figure 3.
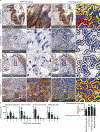
Extended Data Figure 3.. IHC staining of PFKP in tissue microarray cores of lung cancer.
a, Microphotographs showing PFKP IHC immunohistochemistry and their respective image analysis performed in bronchial epithelium (8 cases; 9 cores), tumor stroma (5 cases; 11 cores), non-tumor stroma (5 cases; 7 cores), and malignant cells (6 cases; 14 cores). In non-tumor stroma, red arrows indicate smooth muscle and a black arrow indicates bronchial epithelium. Areas shown as an enlarged image are indicated by black squares. Single cell color outlines indicate Halo-analyzed PFKP expression (0, white; 1+, yellow, 2+, orange, 3+, red). Scale bar, 100 μm. The experiment was performed once. b, Frequency of cells for each PFKP staining classification (0, low to 3, high) analyzed from bronchial epithelium (8 cases; 9 cores), tumor stroma (5 cases; 11 cores), non-tumor stroma (5 cases; 7 cores), and malignant cells (6 cases; 14 cores). Individual dots represent data from a single core. Data are shown as mean ± s.d. c, Distribution score of PFKP staining analyzed from the panel b. The score was calculated for each core by subtracting the lowest frequency value from the highest frequency value. Values close to 100 (blue arrow) suggest a homogeneous (Dirac) distribution of PFKP staining while values close to 0 (red arrow) indicate a completely heterogeneous (uniform) distribution. Data are shown as mean ± s.d.
Extended Data Figure 4.
Extended Data Figure 4.. Quantification of F-actin organization and relations to PFKP expression.
a, Image analysis pipeline to detect F-actin bundles. The core of the pipeline is a steerable filter that enhances the contrast of curvilinear image features. Zoom-in areas are shown in white and red squares. Scale bar, 20 μm or 5 μm (zoom-in). b-d, F-actin organization of HBEC76 and bundle detection after plating cells on normal adhesive and low adhesive substrates (b), on stiff and soft substrates (c) or after latrunculin A (LatA, 200 nM) treatment (d). Positions of zoom-ins are indicated by red boxes. Scale bar, 10 μm. Representative images from a single imaging experiment. e, F-actin organization of untransformed (normal) HBECs versus NSCLCs. Right panels show filament detection. Scale bar, 10 μm. Representative images from a single imaging experiment. Quantification of F-actin bundle length (f) or intensity (g) in HBECs (HBEC30, n = 21; HBEC34, n = 15; HBEC76, n = 16) versus NSCLCs (HCC4087, n = 11; H2009, n = 22; H1819, n = 11). h, Effect of latrunculin A treatment on oxidative phosphorylation of HBEC76 (black), HCC4087 (red), and HCC827 (orange). Mean oxidative phosphorylation rates normalized to control ± s.d. are shown for each group. Data are from three independent experiments. Data in f, g are shown as a box (median ± 25–75%) and whisker (max–min) plot, and statistical significance was assessed using one-way ANOVA and the Tukey test.
Extended Data Figure 5.
Extended Data Figure 5.. PFKP ubiquitination and degradation.
a, Stability of PFKP analyzed by pulse chase experiments. HEK cells were pulsed with L-AHA for 12 hrs followed by a 0 or 24 hr chase period. The experiment was performed once. b, Abundance of ubiquitinated proteins and PFKP expression in HEK cells in the presence or absence of proteasome inhibitor MG132 (10 μM). Control, DMSO. Representative data from two independent experiments are shown. c, Abundance of polyubiquitinated PFKP upon ubiquitin pull-down using either control beads or beads conjugated to ubiquitin-binding protein using HEK cells. PD, pulldown. The experiment was performed once. d, Abundance of polyubiquitinated PFKP in the presence or absence of MG132 (10 μM for 3 hrs). Representative data from three independent experiments. e, Abundance of over-expressed PFKP-GFP harboring specified lysine-to-arginine (K-to-R) mutations on stiff and soft substrates. Data is normalized with respect to over-expressed wildtype (WT) PFKP-GFP on stiff substrate. Wildtype (n = 13) and each K-to-R mutants (n = 2). Data are shown as mean of two independent experiments. f-m, Abundance of PFKP-GFP harboring a lysine-to-arginine (K-to-R) mutation as indicated in cells cultured on stiff and soft substrates. Representative data from two independent experiments. n, Structure of a PFKP tetramer. Each PFKP monomer is colored differently. Arrows point to the K281 sites in each monomer. o, Enlarged structural detail of PFKP around the K281 site. Each amino acid is shown in different color. p, Abundance of over-expressed PFKL-GFP harboring K272R mutation on stiff and soft substrates. The experiment was performed once. q, Abundance of over-expressed PFKM-GFP harboring K275R mutation on stiff and soft substrates. The experiment was performed once. In a, b, d, f-m, p, q, protein abundance was normalized to the abundance of GAPDH, and in c to the abundance of β-actin.
Extended Data Figure 6.
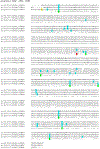
Extended Data Figure 6.. Alignment of human PFK isoforms: PFKP, PFKL, and PFKM.
Conserved lysines are highlighted in green. Lysines reported as ubiquitinated in the Phosphosite database are labeled in cyan. PFKP lysine site 281 is highlighted in red. The previously reported PFKP ubiquitination site, K10, is labeled in yellow .
Extended Data Figure 7.
Extended Data Figure 7.. TRIM21 as a downregulated E3 ligase in lung cancer.
a, Ranking of expression change of E3 ubiquitin ligases (n = 213 ligases) in lung cancer patients. LUAD, lung adenocarcinoma; LUSC, lung squamous cell carcinoma; LUNG, total lung cancer. Data were generated by normalizing individual expression of E3 ligases in tumor samples to their matched normal expression, as reported by the TCGA. Data is plotted in descending order on a log2 scale. TRIM21, red arrows. Right, a summary table of the ranked ligases is shown. Integrated from 20 datasets included in the Lung Cancer Explorer (LCE) . Genes targeted by shRNA are indicated and TRIM21 is highlighted. b, Screening of 18 most consistently downregulated E3 ligases according to LCE for their effects on PFKP expression. Abundance of PFKP relative to GAPDH is summarized as a bar chart. The experiment was performed once. TRIM21, red, is the only of the tested ligases, whose depletion leads to an increase in PFKP expression. c, Abundance of TRIM21 in untransformed HBECs and NSCLCs. Representative data from two independent experiments are shown. d, Abundance of polyubiquinated PFKP in HEK cells without (control) and with overexpression of GFP-tagged TRIM21 (TRIM21-GFP). Representative data from two independent experiments. e, Abundance of PFKP in transformed H2009 cells upon CRISPR-based knockout (KO) of TRIM21. Representative data from two independent experiments. f, Abundance of PFKP after treating HBEC76 with AKT inhibitor X (AKTi, 10 μM) for 15 hrs. Representative data from two independent experiments. g, Abundance of mutant PFKP-GFP (S386A), which cannot be phosphorylated by AKT, compared to control on stiff and soft substrates. The experiment was performed once. In e, f, protein abundance was normalized to the abundance of β-actin, and in b, c, d, g to the abundance of GAPDH.
Extended Data Figure 8.
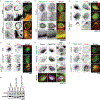
Extended Data Figure 8.. Effect of expression of phosphomimetic alpha-actinin 1Y246Eon F-actin organization and TRIM21 sequestration.
a, TIRF microscopy of TRIM21-GFP and F-actin in NSCLCs. Scale bar, 10 μm. Representative images from a single imaging experiment. b, Fluorescence microscopy of TRIM21-GFP and F-actin in HBEC76 treated with lysophosphatidic acid (LPA; 20 μM) for 30 min. Scale bar, 10 μm. Representative images from a single imaging experiment. c, Epi-fluorescence microscopy of HBEC76 expressing GFP alone, wildtype alpha-actinin 1 (ACTN1)-GFP or mutant alpha-actinin 1Y246E (ACTN1Y246E)-GFP. Scale bar, 10 μm. Representative images from a single imaging experiment. d, Epi-fluorescence microscopy of HEK cells expressing GFP alone, ACTN1-GFP or mutant ACTN1Y246E-GFP. Scale bar, 10 μm. Representative images from a single imaging experiment. e, Epi-fluorescence microscopy of TRIM21-GFP and F-actin following immunofluorescence labeling of Flag-tagged wildtype α-actinin 1 (WT ACTN1) or α-actinin 1 harboring the Y246E mutation (ACTN1Y246E; the cell is outlined with a dotted yellow line) in HBEC76. Scale bar, 10 μm. Representative images from three independent experiments. f, Epi-fluorescence microscopy of TRIM21-GFP and F-actin upon over-expression of wildtype α-actinin 1 (WT ACTN1) or mutant α-actinin 1 (ACTN1Y246E) in HEK cells. Scale bar, 10 μm. Representative images from a single imaging experiment. g, Abundance of PFKP on stiff and soft substrates upon over-expression of GFP alone, ACTN1-GFP or mutant ACTN1Y246E-GFP in HEK cells. Representative data from two independent experiments. Areas of zoom-in are indicated by red boxes (a, b). In all images (a-f), F-actin was stained with fluorescently conjugated phalloidin. Protein abundance was normalized by GAPDH (g).
Extended Data Figure 9.
Extended Data Figure 9.. Analysis of somatic cancer mutations in RING domain E3 ubiquitin ligases.
a, Cancer mutations in TRIM21 RING domain found in proximity to conserved cysteines and histidines. b, Quantification of the number of genes that displayed one or more mutation at positions C1-C8 of the RING domain. c, Summary table of missense and nonsense mutations found in 118 genes at the conserved cysteine and histidine positions C1-C8. Amino acid code is tyrosine (Y), phenylalanine (F), arginine (R), serine (S), tryptophan (W), glycine (G), glutamine (Q), asparagine (N), proline (P), aspartic acid (D), leucine (L), stop codon (*). d, Distribution of mutations across C1-C8. e, Frequency of missense and nonsense mutations at the position C1-C8 and overall. f, WT or mutant TRIM21C54Y-GFP expression in HBEC76 counterstained for F-actin with phalloidin. Scale bar,10 μm. Representative data from a single imaging experiment. g, Representative images of H2009 cells expressing GFP-tagged TRIM21 with indicated cysteine mutations and counterstained for F-actin with phalloidin. Scale bar, 10 μm. The experiment was performed once. h, Representative images of H2009 cells expressing GFP, GFP-tagged wildtype (WT) TRIM21 or TRIM21 with cancer-relevant mutations and counterstained for F-actin with phalloidin. Scale bar, 10 μm. The experiment was performed once. Mutations shown in (g) cause protein aggregation, whereas non-cysteine mutations in (h) do not. i, Abundance of PFKP on stiff and soft substrates when HBEC76 expressed WT or mutant TRIM21C54Y-GFP. The experiment was performed once. j, Effect of expressing WT or mutant TRIM21C54Y on glycolytic rates of HBEC76 normalized to cell number. Data are from three independent experiments shown as mean glycolytic rate ± s.e.m. Dotted line, glycolytic rates of HBEC76 on stiff substrates without over-expressing TRIM21 as indicated in Fig. 1d. Protein abundance was normalized by GAPDH (i).
Figure 1.
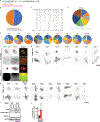
Figure 1.. Glycolysis is mechanically modulated.
a, Morphological differentiation of human bronchial epithelial cells (HBEC76) on stiff and soft substrates. F-actin, grey; nuclei, blue. Scale bar, 15 μm. Representative images from three independent experiments. b, Relative abundance of glucose-derived metabolites on stiff and soft substrates in a heatmap (n = 3 independent cultures); red, accumulation; blue, depletion. Metabolic profiling was performed once. G6P, glucose 6-phosphate; DHAP, dihydroxyacetone phosphate. c, Glycolytic rates of HBEC76 normalized to cell number on stiff and soft substrates. d, Abundance of glycolytic enzymes on stiff and soft substrates: HK1, hexokinase 1; HK2, hexokinase 2; PFKP, phosphofructokinase platelet; PFKL, phosphofructokinase liver; PFKM, phosphofructokinase muscle; ALDA, aldolase A; GAPDH, glyceraldehyde 3-phosphate dehydrogenase; PGAM1, phosphoglycerate mutase 1; ENO1, enolase 1; ENO2, enolase 2; PKM½, pyruvate kinase M1/M2; LDHA, lactate dehydrogenase A; PDH, pyruvate dehydrogenase. Representative data from two independent experiments. e, Left, Representative images of HBEC76 overexpressing GFP-tagged PFKP (PFKP-GFP) on soft and stiff substrates. Scale bar, 10 μm. Right, average PFKP-GFP intensity on stiff (n = 55 cells) and soft (n = 61) substrates from a single imaging experiment. Data shown as a box (median ± 25–75%) and whisker (max–min) plot. f, PFKP-GFP and PFKP abundance on stiff and soft substrates. Representative data from two independent experiments are shown. g, Glycolytic rates of wildtype (WT) and mutant (Mut; sh-p53, KRASV12, c-MYC) HBEC3 normalized to cell number. h, Glycolytic rates of HCC4087 on stiff and soft substrates normalized to cell number. i, Abundance of PFKP in HCC4087 on stiff and soft substrates. Representative data from two independent experiments are shown. In c, g, h, data from three independent experiments are shown (dots); bar graph indicates mean ± s.e.m. of repeats. Statistical significance was assessed using two-tailed Student’s t-test (c, g, h) or two-tailed Mann-Whitney test (e). Protein abundance was normalized to the abundance of β-actin (d, i) or GAPDH (f).
Figure 2.
Figure 2.. F-actin bundling enhances glycolysis.
a, Over-expression of PFKP-GFP in HBEC76 under pharmacological perturbation of myosin II. Control, DMSO; Blebb, blebbistatin (50 μM). Scale bar, 10 μm. Left, representative images. Right, box plots of the distribution of per-cell average intensity of PFKP-GFP under DMSO (control, n = 55 cells) and blebbistatin (n = 51) treatment from a single imaging experiment. b, Effect of same treatments on glycolytic rates of HBEC76 normalized to cell number. Data from three independent experiments are shown (dots); bar graph indicates mean ± s.e.m. of repeats. c, Abundance of PFKP, phosphorylated FAK (pFAK, Y397), and total FAK upon HBEC76 culture on normal adhesive versus low adhesive substrates. Representative data from three independent experiments are shown. d-f, Length of F-actin bundles in HBEC76 plated on normal adhesive (n = 45 cells) versus low adhesive (n = 30) substrates (d), on stiff (n = 10) versus soft (n = 14) substrates (e), and under DMSO (n = 50) versus latrunculin A (LatA, 200 nM; n = 50) treatment (f). Bundle lengths were averaged per cell and distributions of the cell population from a single imaging experiment displayed as whisker plots. g, Abundance of PFKP upon LatA treatment. Control, DMSO. Representative data from three independent experiments are shown. h, Glycolytic response to increasing dose of LatA in HBEC76 (black), HCC4087 (red), and HCC827 (orange). Mean glycolytic rates normalized to control ± s.d. are shown for each concentration. Data are from three independent experiments. i, Representative fluorescence images of F-actin organization in HBEC76 and HCC4087 after LatA treatment vs. DMSO control from two independent experiments. Scale bar, 10 μm. j, Representative fluorescence images of F-actin organization in HBEC76 and HCC4087 on stiff and soft substrates from two independent experiments. Scale bar, 10 μm. Data in a, d-f are shown as a box (median ± 25–75%) and whisker (max–min) plot. Statistical significance was assessed using two-tailed Student’s t-test (b) or two-tailed Mann-Whitney test (a, d-f). Protein abundance was normalized to the abundance of GAPDH (c, g).
Figure 3.
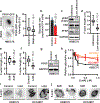
Figure 3.. TRIM21 mediates mechanically modulated PFKP degradation.
a, Abundance of PFKP and ubiquitination in HBEC76 on stiff and soft substrates in the presence or absence of proteasome inhibitor MG132. Representative data from three independent experiments. b, Abundance of wildtype or mutant PFKP-GFP harboring K281R mutation (selected from Extended Data Fig. 5e) on stiff and soft substrates. Representative data from two independent experiments. c, Glycolytic rates, normalized to cell number, of HBEC76 expressing wildtype or K281R mutant PFKP on stiff and soft substrates (n = 6 independent cultures for each condition) from a single experiment. Bar graph indicates mean ± s.e.m. d, Abundance of PFKP in HBEC76 on stiff and soft substrates upon TRIM21 shRNA knockdown (shTRIM21). Representative data from two independent experiments. e, Abundance of PFKP in HBEC76 on stiff and soft substrates upon TRIM21-GFP over-expression. Representative data from two independent experiments. f, Abundance of PFKP in transformed H2009 cells upon TRIM21-GFP over-expression. Representative data from two independent experiments. Statistical significance was assessed using two-tailed Mann-Whitney test (c). Protein abundance was normalized to the abundance of GAPDH (a, b, e) or β-actin (d, f).
Figure 4.
Figure 4.. TRIM21’s E3 ligase activity is negatively regulated by sequestration on F-actin bundles.
a, TIRF microscopy of TRIM21-GFP and F-actin in H1819. Scale bar, 10 μm. Red squares, areas of zoom-in. Representative images from a single imaging experiment. Experiments using other NSCLCs are shown in Extended Data Fig. 8a. b, Co-sedimentation of F-actin with TRIM21-GFP, α-actinin 1 (ACTN1)-GFP (positive control), and GFP (negative control) collected from HEK cell lysates. S, supernatant; P, pellet. Representative data from two independent experiments. c, Left, representative images of HBEC76 expressing WT ACTN1 (control) or mutant ACTN1Y246E stained for F-actin with Alexa-Fluor-568 conjugated phalloidin on soft substrates. Scale bar, 10 μm. Right, average intensity of F-actin for control (50 cells) and ACTN1Y246E expression (n = 50 cells) from a single imaging experiment. Data shown as a box (median ± 25–75%) and whisker (max–min) plot. d, Abundance of PFKP on stiff and soft substrates upon over-expression of WT ACTN1 (control) or ACTN1Y246E in HBEC76. Representative data from two independent experiments. Replicated experiments using HEK cells are shown in Extended Data Fig. 8g. e, Glycolytic rates, normalized to cell number, of HBEC76 expressing WT ACTN1 (control) or ACTN1Y246E on stiff and soft substrates. Data from three independent experiments are shown as mean glycolytic rate ± s.e.m. Statistical significance was assessed using two-tailed Mann-Whitney test (c) or two-tailed Student’s t-test (e). Protein abundance was normalized to the abundance of GAPDH (d).

Comment in

References

    1. Liu Z et al. Mechanical tugging force regulates the size of cell-cell junctions. Proc Natl Acad Sci U S A 107, 9944–9949, doi:10.1073/pnas.0914547107 (2010). - DOI - PMC - PubMed
    1. Vogel V & Sheetz M Local force and geometry sensing regulate cell functions. Nat Rev Mol Cell Biol 7, 265–275, doi:10.1038/nrm1890 (2006). - DOI - PubMed
    1. Wang N, Butler JP & Ingber DE Mechanotransduction across the cell surface and through the cytoskeleton. Science 260, 1124–1127, doi:10.1126/science.7684161 (1993). - DOI - PubMed
    1. Loisel TP, Boujemaa R, Pantaloni D & Carlier MF Reconstitution of actin-based motility of Listeria and Shigella using pure proteins. Nature 401, 613–616, doi:10.1038/44183 (1999). - DOI - PubMed
    1. Kitamura K, Tokunaga M, Iwane AH & Yanagida T A single myosin head moves along an actin filament with regular steps of 5.3 nanometres. Nature 397, 129–134, doi:10.1038/16403 (1999). - DOI - PubMed

Method References

    1. Li L, Teller S, Clifton RJ, Jia X & Kiick KL Tunable mechanical stability and deformation response of a resilin-based elastomer. Biomacromolecules 12, 2302–2310, doi:10.1021/bm200373p (2011). - DOI - PMC - PubMed
    1. Hornbeck PV et al. PhosphoSitePlus, 2014: mutations, PTMs and recalibrations. Nucleic Acids Res 43, D512–520, doi:10.1093/nar/gku1267 (2015). - DOI - PMC - PubMed
    1. Zacharias DA, Violin JD, Newton AC & Tsien RY Partitioning of lipid-modified monomeric GFPs into membrane microdomains of live cells. Science 296, 913–916, doi:10.1126/science.1068539 (2002). - DOI - PubMed
    1. Ran FA et al. Genome engineering using the CRISPR-Cas9 system. Nat Protoc 8, 2281–2308, doi:10.1038/nprot.2013.143 (2013). - DOI - PMC - PubMed
    1. Zerbino DR et al. Ensembl 2018. Nucleic Acids Res 46, D754–D761, doi:10.1093/nar/gkx1098 (2018). - DOI - PMC - PubMed

MeSH terms