. 2020 Feb;578(7796):600-604.
doi: 10.1038/s41586-020-2003-8. Epub 2020 Feb 12.

IL-15, gluten and HLA-DQ8 drive tissue destruction in coeliac disease

Affiliations

IL-15, gluten and HLA-DQ8 drive tissue destruction in coeliac disease

Valérie Abadie et al. Nature. 2020 Feb.

Abstract

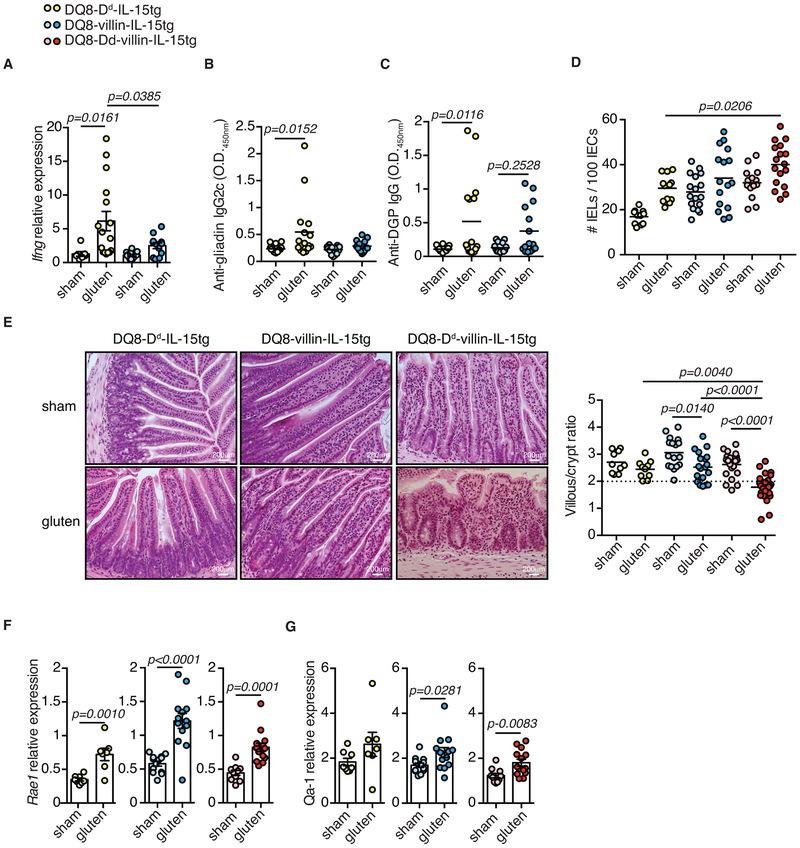
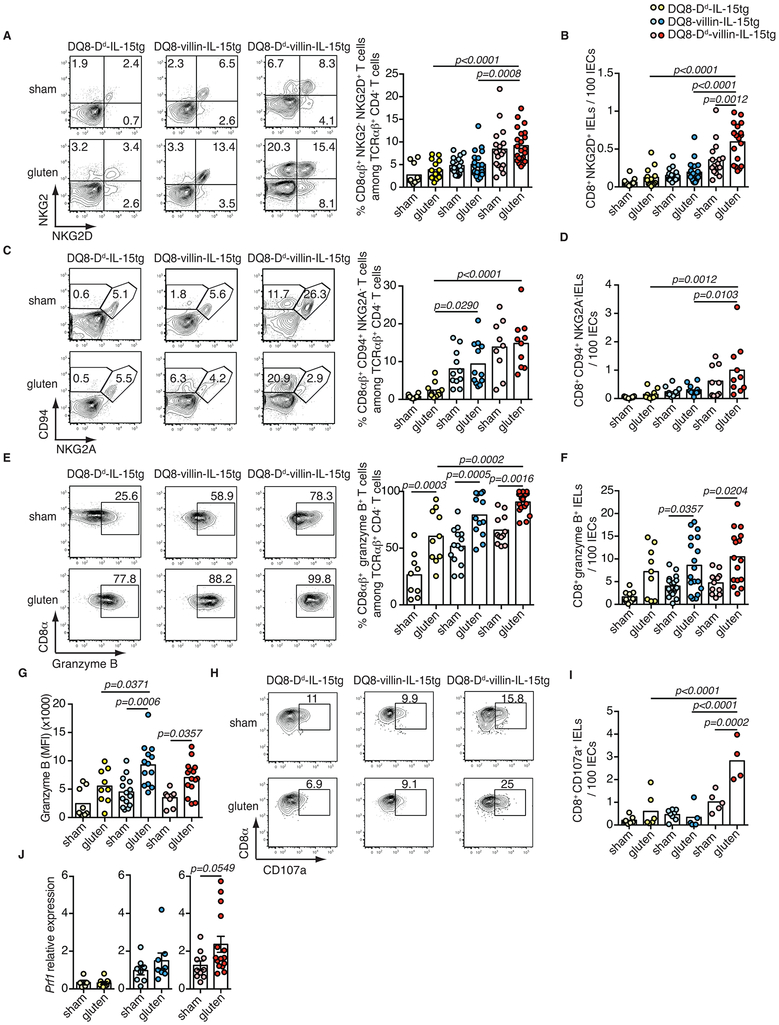
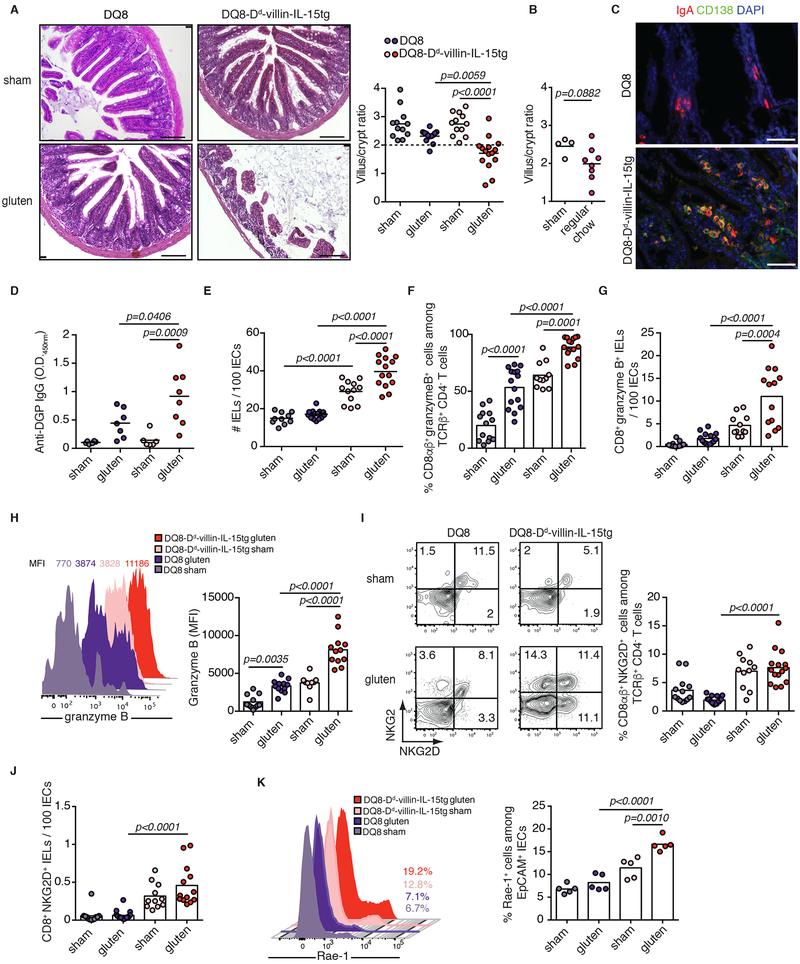
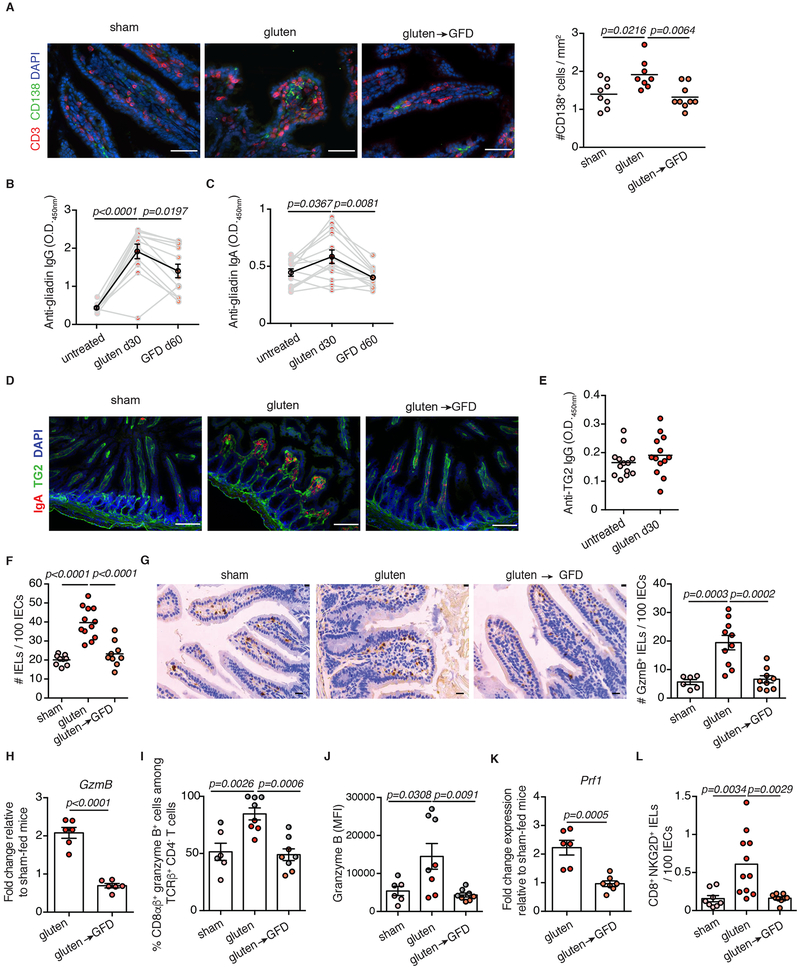
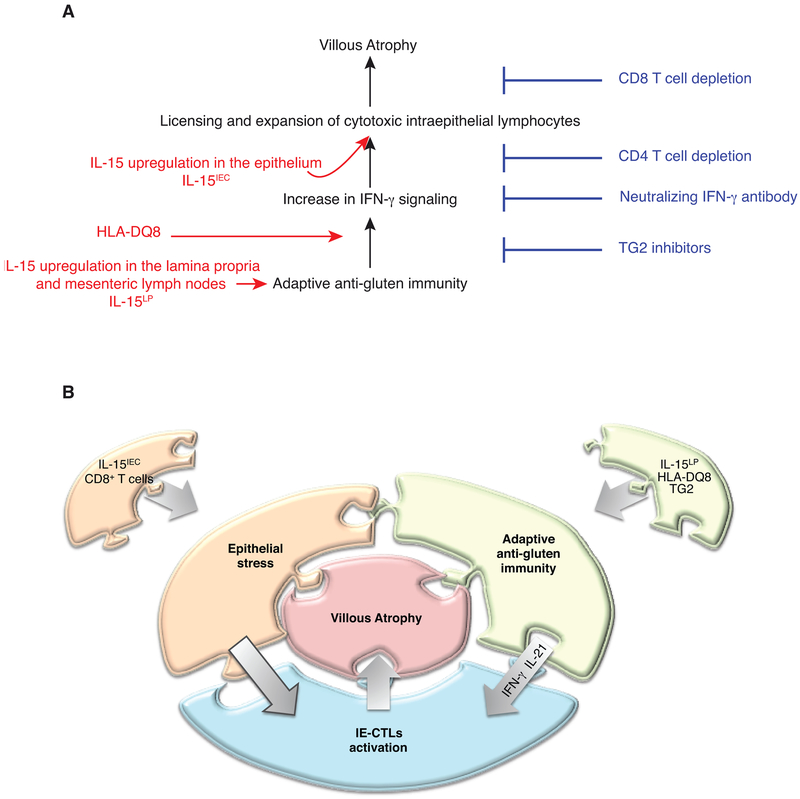
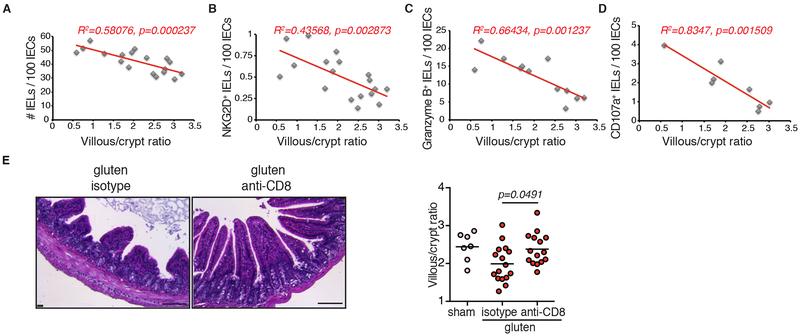
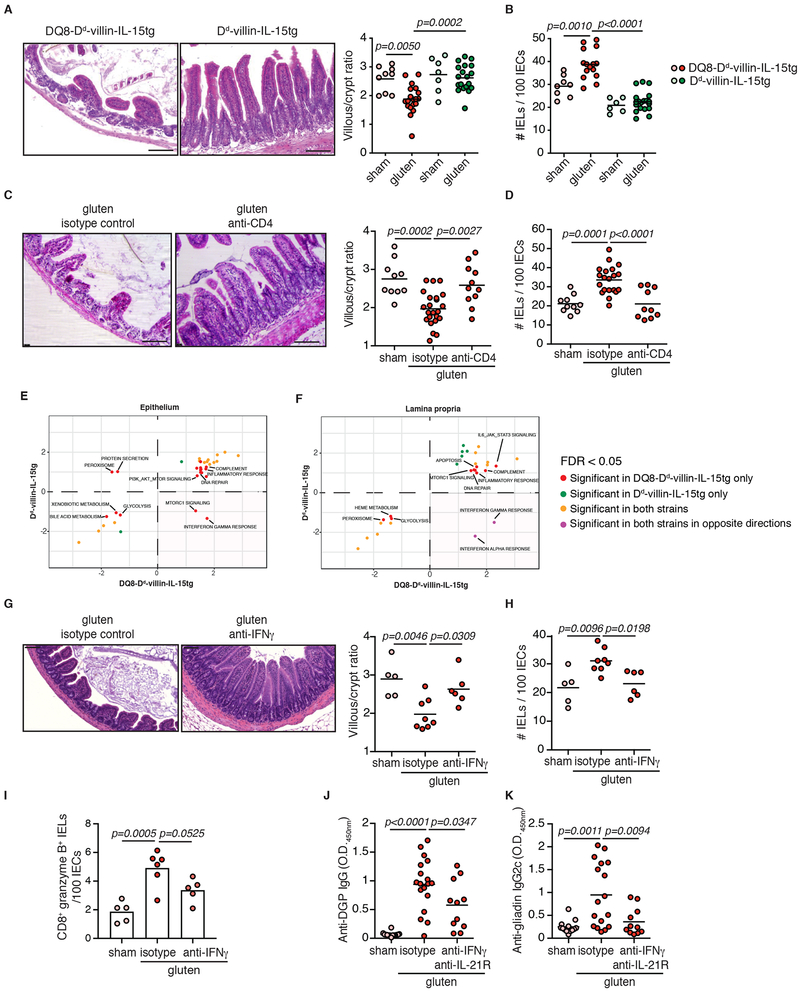
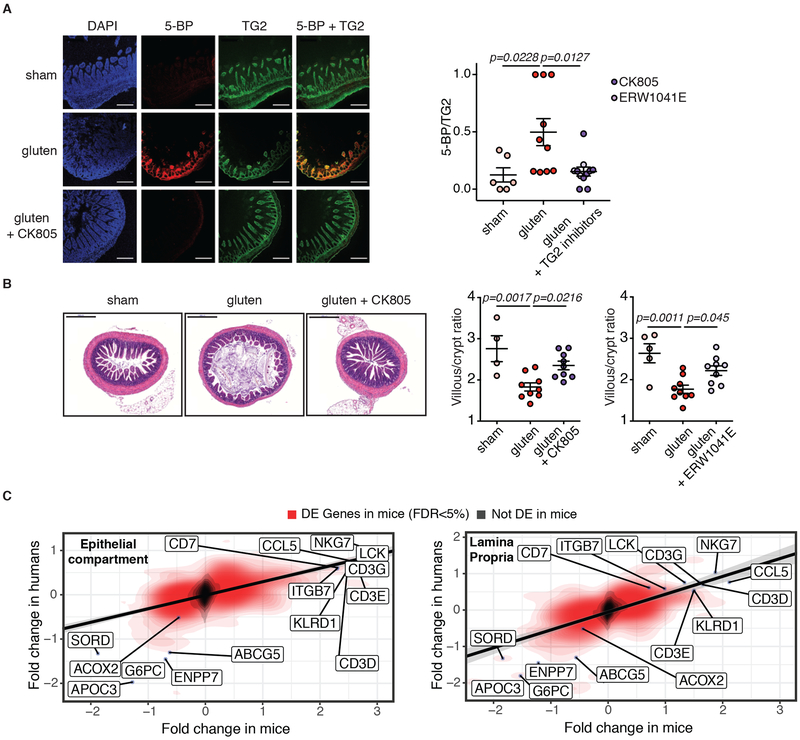
Coeliac disease is a complex, polygenic inflammatory enteropathy caused by exposure to dietary gluten that occurs in a subset of genetically susceptible individuals who express either the HLA-DQ8 or HLA-DQ2 haplotypes1,2. The need to develop non-dietary treatments is now widely recognized3, but no pathophysiologically relevant gluten- and HLA-dependent preclinical model exists. Furthermore, although studies in humans have led to major advances in our understanding of the pathogenesis of coeliac disease4, the respective roles of disease-predisposing HLA molecules, and of adaptive and innate immunity in the development of tissue damage, have not been directly demonstrated. Here we describe a mouse model that reproduces the overexpression of interleukin-15 (IL-15) in the gut epithelium and lamina propria that is characteristic of active coeliac disease, expresses the predisposing HLA-DQ8 molecule, and develops villous atrophy after ingestion of gluten. Overexpression of IL-15 in both the epithelium and the lamina propria is required for the development of villous atrophy, which demonstrates the location-dependent central role of IL-15 in the pathogenesis of coeliac disease. In addition, CD4+ T cells and HLA-DQ8 have a crucial role in the licensing of cytotoxic T cells to mediate intestinal epithelial cell lysis. We also demonstrate a role for the cytokine interferon-γ (IFNγ) and the enzyme transglutaminase 2 (TG2) in tissue destruction. By reflecting the complex interaction between gluten, genetics and IL-15-driven tissue inflammation, this mouse model provides the opportunity to both increase our understanding of coeliac disease, and develop new therapeutic strategies.


Figures

Extended Data Figure 1.
Extended Data Figure 1.. Development of villous atrophy requires IL-15 expression in both the lamina propria and epithelium.
(A-G) DQ8-Dd-IL-15tg, DQ8-villin-IL-15tg, and DQ8-Dd-villin-IL-15tg mice that were raised on a GFD were maintained on a GFD (sham) or fed with gluten for 30 days (gluten). (A) Expression of Ifng in the LP was measured by qPCR. Data are representative of three independent experiments shown as mean ± s.e.m (DQ8-Dd-IL-15tg sham, n=7, gluten n=16; DQ8-villin-IL-15tg sham, n=13, gluten n=12). One-way analysis of variance (ANOVA) / Tukey’s multiple comparison. (B) Serum anti-gliadin IgG2c levels were measured by ELISA thirty days after gluten feeding. Three independent experiments shown (DQ8-Dd-IL-15tg sham, n=16, gluten n=16; DQ8-villin-IL-15tg sham, n=15, gluten n=15); mean; ANOVA / Tukey’s multiple comparison. (C) Serum anti-deamidated gliadin peptides (DGP) IgG levels were measured by ELISA thirty days after gluten feeding. Three independent experiments (DQ8-Dd-IL-15tg sham, n=10, gluten n=10; DQ8-villin-IL-15tg sham, n=9, gluten n=9); mean; ANOVA / Tukey’s multiple comparison. (D) Quantification of IELs among IECs was performed on H&E stained ileum sections. Four independent experiments (DQ8-Dd-IL-15tg sham, n=11, gluten n=12; DQ8-villin-IL-15tg sham, n=17, gluten n=16; DQ8-Dd-villin-IL-15tg sham, n=14, gluten n=17); mean; ANOVA / Tukey’s multiple comparison. (E) H&E staining of paraffin-embedded ileum sections. The graph depicts the ratio of the morphometric assessment of villous height to crypt depth. Six independent experiments shown as mean (DQ8-Dd-IL-15tg sham, n=10, gluten n=10; DQ8-villin-IL-15tg sham, n=17, gluten n=19; DQ8-Dd-villin-IL-15tg sham, n=21, gluten n=28); ANOVA) / Tukey’s multiple comparison. (F, G) Expression of (F) Rae1and (G) Qa-1 in the intestinal epithelium was measured by qPCR. Relative expression levels in sham and gluten-fed mice for each strain are shown. Data are representative of three (DQ8-Dd-IL-15tg sham, n=16, gluten n=16; DQ8-villin-IL-15tg sham, n=15, gluten n=15) or four (DQ8-Dd-villin-IL-15tg sham, n=20, gluten n=26) independent experiments shown as mean ± s.e.m.. Unpaired, two-tailed, t-test.
Extended Data Figure 2.
Extended Data Figure 2.. Acquisition of cytotoxic properties by intraepithelial lymphocytes requires IL-15 expression in both the lamina propria and epithelium.
(A-J) DQ8-Dd-IL-15tg, DQ8-villin-IL-15tg, and DQ8-Dd-villin-IL-15tg mice were maintained on a GFD (sham) or fed with gluten for 30 days (gluten). (A-I) The intestinal epithelium was isolated and analyzed by flow cytometry. A subset of IELs was identified as TCRβ+ CD4 CD8αβ+ cells. In parallel, total IELs were identified as TCRβ+ CD4 CD8+ cells by flow cytometry and quantified among IECs on H&E stained ileum sections. (A) Percentage of NKG2D+ NKG2 CD8αβ+ IELs are indicated. Six independent experiments (DQ8-Dd-IL-15tg sham, n=11, gluten n=14; DQ8-villin-IL-15tg sham, n=20, gluten n=20; DQ8-Dd-villin-IL-15tg sham, n=17, gluten n=22); mean; ANOVA/ Tukey’s multiple comparison. (B) Numbers of NKG2D+ NKG2 CD8+ IELs / 100 IECs. Six independent experiments (DQ8-Dd-IL-15tg sham, n=11, gluten n=13; DQ8-villin-IL-15tg sham, n=20, gluten n=20; DQ8-Dd-villin-IL-15tg sham, n=16, gluten n=19); mean; ANOVA / Tukey’s multiple comparison. (C) Percentage of CD94+ NKG2A CD8αβ+ IELs are indicated. Three independent experiments (DQ8-Dd-IL-15tg sham, n=10, gluten n=10; DQ8-villin-IL-15tg sham, n=11, gluten n=11; DQ8-Dd-villin-IL-15tg sham, n=9, gluten n=10); mean; ANOVA / Tukey’s multiple comparison. (D) Numbers of CD94+NKG2A CD8+ IELs / 100 IECs. Three independent experiments (DQ8-Dd-IL-15tg sham, n=10, gluten n=10; DQ8-villin-IL-15tg sham, n=11, gluten n=11; DQ8-Dd-villin-IL-15tg sham, n=9, gluten n=10); mean; ANOVA / Tukey’s multiple comparison. (E) Intracellular granzyme B+ IELs are indicated by percentage. Data are representative of five independent experiments shown as mean (DQ8-Dd-IL-15tg sham, n=9, gluten n=10; DQ8-villin-IL-15tg sham, n=14, gluten n=13; DQ8-Dd-villin-IL-15tg sham, n=12, gluten n=18). ANOVA / Tukey’s multiple comparison. (F) Numbers of granzyme B+ IELs / 100 IECs. Five independent experiments (DQ8-Dd-IL-15tg sham, n=11, gluten n=13; DQ8-villin-IL-15tg sham, n=20, gluten n=20; DQ8-Dd-villin-IL-15tg sham, n=16, gluten n=19); mean; ANOVA / Tukey’s multiple comparison. (G) Intracellular granzyme B mean fluorescence intensity (MFI) was measured. Four independent experiments (DQ8-Dd-IL-15tg sham, n=9, gluten n=9; DQ8-villin-IL-15tg sham, n=14, gluten n=13; DQ8-Dd-villin-IL-15tg sham, n=10, gluten n=15); mean; ANOVA / Tukey’s multiple comparison. (H) The percentages of CD8αβ+ CD107a+ IELs are indicated. (I) Numbers of CD8+ CD107a+ IELs / 100 IECs are shown. Two independent experiments (DQ8-Dd-IL-15tg sham, n=7, gluten n=6; DQ8-Dd-villin-IL-15tg sham, n=8, gluten n=5; DQ8-Dd-villin-IL-15tg sham, n=5, gluten n=4). ANOVA / Tukey’s multiple comparison. (J) Expression of Prf1 in the intestinal epithelium was measured by qPCR. Relative expression levels in sham and gluten-fed mice for each strain are shown (DQ8-Dd-IL-15tg sham, n=16, gluten n=16; DQ8-villin-IL-15tg sham, n=15, gluten n=15; DQ8-Dd-villin-IL-15tg sham, n=20, gluten n=26). Unpaired, two-tailed, t-test.
Extended Data Figure 3.
Extended Data Figure 3.. Overexpression of IL-15 in HLA-humanized DQ8 mice confers susceptibility to development of coeliac disease-like features in a gluten-dependent manner.
(A-K) DQ8 and DQ8-Dd-villin-IL-15tg mice were maintained on a GFD (sham) or fed with gluten for 30 days (gluten). (A) H&E staining of paraffin-embedded ileum sections. Scale bar, 100 μm. The graph depicts the ratio of the morphometric assessment of villous height to crypt depth. Four independent experiments shown (DQ8 sham, n=12, gluten n=13; DQ8-Dd-villin-IL-15tg sham, n=12, gluten n=15); mean; ANOVA / Tukey’s multiple comparison. (B) Villous to crypt ratio from sham-fed DQ8-Dd-villin-IL-15tg mice and DQ8-Dd-villin-IL-15tg mice fed a standard rodent chow without supplemental gluten. Two independent experiments (sham, n=4, gluten n=8); mean; Unpaired, two-tailed, t-test. (C) IgA (red) and CD138+ plasma cells (green) were distinguished by immunohistochemistry (IHC) staining of frozen ileum sections. (D) Serum anti-deamidated gliadin peptides (DGP) IgG levels as measured by ELISA. Sera were collected thirty days after gluten feeding. Two independent experiments (DQ8 sham, n=6, gluten n=7; DQ8-Dd-villin-IL-15tg sham, n=6, gluten n=7); mean; ANOVA / Tukey’s multiple comparison. (E) Quantification of IELs among IECs performed on H&E stained ileum sections. Four independent experiments (DQ8 sham, n=10, gluten n=16; DQ8-Dd-villin-IL-15tg sham, n=12, gluten n=14); mean; ANOVA / Tukey’s multiple comparison. (F-J) The intestinal epithelium was isolated and analyzed by flow cytometry. IELs were identified as TCRβ+ CD4 CD8+ and TCRβ+ CD4 CD8αβ+ cells. (F) Granzyme B+ IELs are indicated by percentage. Four independent experiments (DQ8 sham, n=13, gluten n=15; DQ8-Dd-villin-IL-15tg sham, n=11, gluten n=15); mean; ANOVA / Tukey’s multiple comparison. (G) Numbers of granzyme B+ CD8+ IELs / 100 IECs. Four independent experiments (DQ8 sham, n=11, gluten n=14; DQ8-Dd-villin-IL-15tg sham, n=11, gluten n=13); mean; ANOVA / Tukey’s multiple comparison. (H) Granzyme B MFI. Data are representative of three independent experiments shown as mean (DQ8 sham, n=11, gluten n=12; DQ8-Dd-villin-IL-15tg sham, n=9, gluten n=12). ANOVA / Tukey’s multiple comparison. (I) NKG2D+ NKG2 IELs are indicated by percentage. Four independent experiments (DQ8 sham, n=13, gluten n=17; DQ8-Dd-villin-IL-15tg sham, n=11, gluten n=15); mean; ANOVA / Tukey’s multiple comparison. (J) Numbers of NKG2D+ NKG2 IELs / 100 IECs. Four independent experiments (DQ8 sham, n=12, gluten n=16; DQ8-Dd-villin-IL-15tg sham, n=11, gluten n=13); mean; ANOVA / Tukey’s multiple comparison. (K) The intestinal epithelium was isolated and analyzed by flow cytometry. Intestinal epithelial cells (IECs) were identified as EpCAM+ CD45 cells. Rae1ε+ IECs are indicated by percentage. Two independent experiments (n=5 mice per group); mean; ANOVA / Tukey’s multiple comparison.
Extended Data Figure 4.
Extended Data Figure 4.. Gluten-free diet decreases the anti-gluten antibody response and the number of cytotoxic intraepithelial lymphocytes.
(A-H, K-L) DQ8-Dd-villin-IL-15tg\ mice that were raised on a gluten-free diet (GFD) were maintained on a GFD (denoted “sham”), fed with gluten for 30 days (“gluten”), or fed with gluten for 30 days and then reverted to a GFD (“gluten→GFD”) for 30 days. (A) CD3ε+ T cells (red) and CD138+ plasma cells (green) were distinguished by immunohistochemistry (IHC) staining of frozen ileum sections. Scale bar, 50 μm. The graph depicts the number of CD138+ cells per section, normalized to lamina propria (LP) area. Three independent experiments (sham, n=8 mice; gluten, n=8 mice; gluten→GFD, n=9 mice); mean; ANOVA / Tukey’s multiple comparison. (B, C) Serum anti-gliadin (C) IgG and (D) IgA levels were measured by ELISA. Sera were collected sequentially in the same mice before gluten feeding (untreated), thirty days after gluten feeding (gluten d30), and thirty days after reversion to a GFD (GFD d60). Data are representative of four independent experiments (n=12 or 13 mice per group for anti-gliadin IgG and IgA, respectively). The black line represents the average for each of the groups (mean ± s.e.m.). ANOVA) / Tukey’s multiple comparison. (D) Mucosal IgA deposits (red) and transglutaminase 2 (TG2, green) were identified by immunohistochemistry (IHC) staining of frozen ileum sections. (E) Serum anti-TG2 IgG antibody levels measured by ELISA thirty days after gluten feeding. Data are representative of four independent experiments shown as mean (n=13 mice per group). (F) Quantification of intraepithelial lymphocytes (IELs) among intestinal epithelial cells (IECs) was performed on H&E stained ileum sections. Four independent experiments (sham, n=8 mice; gluten, n=12 mice; gluten→GFD, n=9 mice); mean; ANOVA / Tukey’s multiple comparison. (G) Granzyme B staining by IHC on paraffin-embedded ileum sections. Scale bar, 20 μm. The graph depicts the average number of granzyme B+ IELs / 100 IECs per mouse. Three independent experiments (sham, n=6 mice; gluten, n=10 mice; gluten→GFD, n=9 mice). mean ± s.e.m.; ANOVA / Tukey’s multiple comparison. (H) Expression of GzmB in the intestinal epithelium was measured by qPCR. Relative expression levels in gluten and gluten→GFD groups were normalized against the expression levels observed in sham-fed DQ8-Dd-villin-IL-15tg mice. Two independent experiments (n=6 mice per group). mean ± s.e.m.; Unpaired, two-tailed, t-test. (I, J) DQ8-Dd-villin-IL-15tg mice that were raised on a gluten-free diet (GFD) were maintained on a GFD (denoted “sham”), fed with gluten for 30 days (“gluten”), or fed with gluten for 30 days and then reverted to a GFD (“gluten→GFD”) for 60 (day 90, red dots) or 90 days (day 120, gray dots). The intestinal epithelium was isolated and analyzed by flow cytometry. IELs were identified as TCRβ+ CD4 CD8αβ+ cells. Granzyme B+ IELs are indicated by (I) percentage and (J) MFI. Two independent experiments (sham, n=6 mice; gluten, n=8 mice; gluten→GFD, n=8 mice); mean ± s.e.m.; ANOVA / Tukey’s multiple comparison. (K) Expression of Prf1 in the intestinal epithelium was measured by qPCR. Analysis was performed as in (F). Two independent experiments (gluten, n=6 mice; gluten→GFD, n=7 mice). mean ± s.e.m ; Unpaired, two-tailed, t-test. (L) The intestinal epithelium was isolated and analyzed by flow cytometry. IELs were identified as TCRβ+ CD4 CD8+ cells. In parallel, IELs were quantified among IECs on H&E stained ileum sections. NKG2D+ NKG2 IELs are indicated by absolute number / 100 IECs. Two independent experiments( sham, n=8 mice; gluten, n=11 mice; gluten→GFD, n=9 mice). mean ± s.e.m; ANOVA / Tukey’s multiple comparison.
Extended Data Figure 5.
Extended Data Figure 5.. Impact of CD8 T cell depletion on antibody production and epithelial stress markers.
(A-F) Ten-week old DQ8-Dd-villin-IL-15tg mice were treated with 200 or 400 μg of depleting anti-CD8α antibody (clone 2.43) or its isotype control (rat IgG2b) twice prior to and during the course of gluten feeding. (A) Experimental scheme. (B, C) Representative dot-plots showing depletion efficiency in the (B) blood and (C) epithelium of DQ8-Dd-villin-IL-15tg mice after 30 days of anti-CD8α treatment. (D, E) Rae1 (D) and Qa-1 (E) gene expression in the intestinal epithelium was determined by qPCR. Relative expression levels were normalized against the expression levels observed in sham-fed DQ8-Dd-villin-IL-15tg mice. Four independent experiments (gluten + isotype, n=16; gluten + anti-CD8, n=14). mean ± s.e.m; Unpaired, two-tailed, t-test. (F) Anti-deamidated gluten peptide (DGP) IgG levels from serum collected thirty days after gluten feeding. Data are representative of three independent experiments shown as mean (gluten + isotype, n=11; gluten + anti-CD8, n=11).
Extended Data Figure 6.
Extended Data Figure 6.. HLA-DQ8 is required for the expansion of cytotoxic intraepithelial lymphocytes.
(A) Cells isolated from the mesenteric lymph nodes of DQ8-Dd-villin-IL-15tg and Dd-villin-IL-15tg mice. CD11c+ CD103+ dendritic cells were analyzed by flow cytometry for their expression of MHC class II and HLA-DQ8 molecules. (B-F) DQ8-Dd-villin-IL-15tg and Dd-villin-IL-15tg mice that were raised on a GFD were maintained on a GFD (sham) or fed with gluten for 30 days (gluten). (B) Anti-DGP IgG levels were measured by ELISA. Sera were collected thirty days after gluten feeding. Six independent experiments (DQ8-Dd-villin-IL-15tg, sham n=17, gluten n=28; Dd-villin-IL-15tg, sham n=17, gluten n=28); mean; ANOVA / Tukey’s multiple comparison. (C) Expression of IFN-γ in the LP was measured by qPCR. Relative expression levels in gluten groups were normalized against the expression levels observed in sham-fed DQ8-Dd-villin-IL-15tg mice and sham-fed Dd-villin-IL-15tg. Three independent experiments (DQ8-Dd-villin-IL-15tg, n=8; Dd-villin-IL-15tg, n=9);mean ± s.e.m.. (D-F) The intestinal epithelium was isolated and analyzed by flow cytometry. IELs were identified as TCRβ+ CD4 CD8+ cells. (D) NKG2D+ NKG2 IELs are indicated by absolute number / 100 IECs. Six independent experiments (DQ8-Dd-villin-IL-15tg, sham n=8, gluten n=16; Dd-villin-IL-15tg, sham n=9, gluten n=22); mean; ANOVA / Tukey’s multiple comparison. (E) Granzyme B+ IELs are indicated by absolute number / 100 IECs. Four independent experiments (DQ8-Dd-villin-IL-15tg, sham n=8, gluten n=8; Dd-villin-IL-15tg, sham n=9, gluten n=10); mean; ANOVA / Tukey’s multiple comparison. (F) Intracellular granzyme B mean fluorescence intensity (MFI) was measured. Data are representative of two independent experiments shown as mean (DQ8-Dd-villin-IL-15tg, sham n=5, gluten n=6; Dd-villin-IL-15tg, sham n=5, gluten n=5). ANOVA / Tukey’s multiple comparison.
Extended Data Figure 7.
Extended Data Figure 7.. CD4+ T cells are required for coeliac disease pathogenesis.
(A-J) DQ8-Dd-villin-IL-15tg mice were treated with 200 or 400 μg of depleting anti-CD4 antibody (clone GK1.5) or its isotype control (rat IgG2b) twice prior to and during the course of gluten feeding. (A) Experimental scheme. (B, C) Representative dot-plots showing depletion efficiency in the (B) blood and (C) mesenteric lymph nodes (MLN) of DQ8-Dd-villin-IL-15tg mice. (D) The intestinal epithelium was isolated and analyzed by flow cytometry. IELs were identified as TCRβ+ CD4 CD8+ cells. NKG2D+ NKG2 IELs are indicated by absolute number / 100 IECs. Four independent experiments (sham, n=8; gluten + isotype, n=20, gluten + anti-CD4, n=12); mean; ANOVA / Tukey’s multiple comparison. (E-H) Expression of (E) GzmB, (F) Prf1, (G) Rae1, and (H) Qa-1 in the intestinal epithelium as measured by qPCR. Relative expression levels were normalized against the expression levels observed in sham-fed DQ8-Dd-villin-IL-15tg mice. Four independent experiments ± s.e.m (gluten + isotype, n=12 to 17, gluten + anti-CD4, n=8); mean; Unpaired, two-tailed, t-test. (I, L) Anti-DGP IgG (I), anti-gliadin IgG2c (J), anti-gliadin IgG (K) and anti-gliadin IgA (L) levels were measured by ELISA from serum collected thirty days after gluten feeding. Four independent experiments (sham, n=11; gluten + isotype, n=25-26, gluten + anti-CD4, n=11); mean; ANOVA / Tukey’s multiple comparison.
Extended Data Figure 8.
Extended Data Figure 8.. Transcriptional programs promoted by HLA-DQ8, IL-15 and gluten.
(A, B) We contrasted the enrichment scores in the epithelium and the lamina propria for DQ8-Dd-villin-IL-15tg (x-axis) and DQ8 mice (y-axis) for all pathways enriched at an FDR <5% in at least one of the strains. Positive and negative scores represent enrichments among genes that are more highly or lowly expressed in gluten-fed animals, respectively. The bottom right quadrant refers to pathways that in response to gluten are up-regulated in DQ8-Dd-villin-IL-15tg but down-regulated in DQ8 mice. (C) Gene ontology terms significantly enriched among genes differently expressed in response to gluten challenge in DQ8, Dd-villin-IL-15tg, and DQ8-Dd-villin-IL-15tg mice. (D) Heatmap of genes showing a stronger response to gluten in DQ8-Dd-villin-IL-15tg mice as compared to DQ8 and Dd-villin-IL-15tg mice. The colors reflect the magnitude of the response to gluten (in log2 scale), and the stars highlight gene ontology terms associated with each of the genes plotted.
Extended Data Figure 9.
Extended Data Figure 9.. Impact of IFN-γ and IL-21 neutralization on the development of coeliac disease.
(A-I) DQ8-Dd-villin-IL-15tg mice were treated with 500 μg of anti-IFNγ (clone XMG1.2) and/or anti-IL21R (clone 4A9) antibodies or corresponding isotype controls (rat IgG1 and rat IgG2a, respectively) once prior to, and every 3 days during the course of gluten feeding as indicated in the panels. (A) Ratio of the morphometric assessment of villous height to crypt depth. Data are representative of two independent experiments shown as mean (sham, n=8, gluten + isotype, n=7, gluten + anti-IL-21R, n= 6). ANOVA / Tukey’s multiple comparison. (B) Quantification of IELs among IECs was performed on H&E stained ileum sections. Two independent experiments (sham, n=8, gluten + isotype, n=7, gluten + anti-IL-21R, n= 6); mean; ANOVA / Tukey’s multiple comparison. (C) The intestinal epithelium was isolated and analyzed by flow cytometry. IELs were identified as TCRβ+ CD4 CD8+ cells. Granzyme B+ IELs are indicated by absolute number / 100 IECs. Data are representative of two independent experiments shown as mean (sham, n=8, gluten + isotype, n=7, gluten + anti-IL-21R, n= 6). (D) Granzyme B+ IELs are indicated as in (C). Four independent experiments (sham, n=12, gluten + isotype, n=16, gluten + anti-IL-21R + anti- IFN-γ, n= 11); mean; ANOVA / Tukey’s multiple comparison. (E) Quantification of IELs among IECs was performed on H&E stained ileum sections. Four independent experiments (sham, n=13, gluten + isotype, n=17, gluten + anti-IL-21R+ anti- IFN-γ, n= 11); mean; ANOVA / Tukey’s multiple comparison. (F-G) Serum anti-DGP IgG (F) and anti-gliadin IgG2c (G) levels were measured by ELISA. Sera were collected thirty days after gluten feeding. Two independent experiments (sham, n=5 and 6, gluten + isotype, n=8 and 7, gluten + anti-IL-21R, n= 6); mean; ANOVA / Tukey’s multiple comparison. (H-I) Serum anti-DGP IgG (H) and anti-gliadin IgG2c (I) levels were measured as in (F-G). Two independent experiments (sham, n=6 and 6, gluten + isotype, n=8, gluten + anti- IFN-γ, n= 6); mean; ANOVA/ Tukey’s multiple comparison.
Extended Data Figure 10.
Extended Data Figure 10.. Validation of DQ8-Dd-villin-IL-15tg mice as a preclinical mouse model of coeliac disease.
(A) Serum anti-native gliadin peptides (Native) and anti-deamidated gliadin peptide (DGP) IgG levels in gluten-fed DQ8-Dd-villin-IL-15tg mice dosed with TG2 inhibitors (gluten + TG2 inhibitors) or vehicle (gluten) were compared by ELISA. Four independent experiments (gluten n=17; gluten + TG2 inhibitors n=13); Paired, two-tailed, t-test. In all cases, serum samples were obtained on day 30 after initiating the gluten challenge. (B) Similar gene regulatory mechanisms underlie the development of CeD in humans and DQ8-Dd-villin-IL-15tg mice. Contrast between the gene ontology terms enriched among genes induced by gluten challenge in DQ8-Dd-villin-IL-15tg mice (depicted in the form of −log10 p-values on the x-axis) and the gene ontology terms enriched among genes differently expressed between CeD patients and healthy controls (depicted in the form of −log10 p-values on the x-axis) in the epithelial compartment (A) and the LP (B). The transcriptional comparison was made between the intestinal epithelium and LP of gluten-fed DQ8-Dd-villin-IL-15tg mice and whole duodenal biopsies of active CeD patients.
Extended Data Figure 11.
Extended Data Figure 11.. Interplay between IL-15, TG2, and HLA-DQ8 promote the development of villous atrophy.
(A) Representation of the respective roles of HLA-DQ8, IL-15 in the epithelial and LP compartments, IFN-γ, TG2, CD4+ and CD8+ T cells in promoting VA. IL-15 upregulation in the LP is required to induce the adaptive anti-gluten TH1 response, and HLA-DQ8 facilitates and enhances the IFN-γ response that is required for the development of VA. The adaptive TH1 immune response promoted by HLA-DQ8 and IL-15 in the LP, is however insufficient to cause tissue destruction. It needs to synergize with IL-15 in the epithelium to further promote the expansion of cytolytic IELs and their degranulation, leading to CD8 T cell dependent killing of epithelial cells and VA. The value of this mouse model as a gluten and HLA-DQ8-dependent preclinical model for CeD, is further emphasized by the finding that TG2 inhibition prevents VA. (B) CeD can be represented as a jigsaw puzzle where each piece representing one component of the anti-gluten immune response must interlock to lead to the development of VA, the diagnostic hallmark of active CeD.
Figure 1.
Figure 1.. DQ8-Dd-villin-IL-15tg mice: a gluten-dependent model of CeD with villous atrophy.
(A-G) DQ8-Dd-villin-IL-15tg mice were maintained on a GFD (sham), fed with gluten for 60 days (gluten), or fed with gluten for 30 days and then reverted to a GFD (gluten→GFD) for 30 days. (A) Experimental timeline. (B) Hematoxylin and eosin (H&E) staining of paraffin-embedded ileum sections. Scale bar, 200 μm. The graph depicts the ratio of the morphometric assessment of villous height to crypt depth. (sham, n=9; gluten, n=13; gluten→GFD, n=11 mice, four independent experiments). ANOVA) / Tukey’s multiple comparison; mean. (C) Serum anti-deamidated gliadin peptide (DGP) IgG levels were measured by ELISA. Sera were collected sequentially from four independent experiments in the same mice (n=12) before gluten feeding (untreated), thirty days after gluten feeding (gluten d30), and thirty days after reversion to a GFD (GFD d60). The black line represents the average mean ± s.e.m.. Paired, two-tailed, t-test. (D) Serum anti-gliadin IgG2c levels measured as in (C) (n=12 mice per group, four independent experiments). Paired, two-tailed, t-test. (E) Expression of IFN-γ in the LP was measured by qPCR. Relative expression levels in gluten-fed (n=6) and gluten→GFD (n=6) mice were normalized against the expression levels observed in sham-fed DQ8-Dd-villin-IL-15tg mice. Two independent experiments; Unpaired, two-tailed, t-test. (F, G) Expression of Rae1 (gluten, n=5; gluten→GFD, n=7) (F) and Qa-1 (gluten, n=7; gluten→GFD, n=7) (G) in the intestinal epithelium measured by qPCR as in (E). Two independent experiments; mean ± s.e.m; Unpaired, two-tailed, t-test.
Figure 2.
Figure 2.. Cytotoxic IELs are the key effector cells mediating tissue destruction.
(A-D) Correlations between the extent of villous atrophy determined by analysis of the villous/crypt ratio (Extended Data Fig. 1E) and (A) the number of IELs / 100 IECs (Extended Data Fig. 1D), (B) the number of IELs expressing NKG2D / 100 IECs (Extended Data Fig. 2B), (C) the number of IELs expressing granzyme B / 100 IECs (Extended Data Fig. 2F), and (D) the amount of IELs expressing CD107a (Extended Data Fig. 2I) in sham and gluten-fed DQ8-Dd-villin-IL-15tg mice. Pearson’s correlation test. (E) H&E staining of ileum sections of DQ8-Dd-villin-IL-15tg mice fed with gluten for 30 days and concurrently treated with a CD8 depleting antibody or isotype control (treatment regimen and efficacy summarized in Extended Data Figure 5). Scale bar 100 μm. The graph depicts the villous to crypt ratio. Four independent experiments (sham, n=7; gluten n=16; gluten + anti-CD8, n=15); mean; One-way ANOVA / Tukey’s multiple comparison.
Figure 3.
Figure 3.. HLA-DQ8, CD4+ T cells and IFN-γ are required for tissue destruction.
(A-B) DQ8-Dd-villin-IL-15tg and Dd-villin-IL-15tg mice were maintained on a GFD (sham) or fed with gluten for 30 days (gluten). (A) H&E staining of paraffin-embedded ileum sections of gluten-fed mice. Scale bar, 100 μm. The graph depicts the villous to crypt ratio. Six independent experiments (DQ8-Dd-villin-IL-15tg, sham n=9, gluten n=19; Dd-villin-IL-15tg, sham n=7, gluten n=19); mean; ANOVA / Tukey’s multiple comparison. (B) Quantification of IELs among IECs. Six independent experiments (DQ8-Dd-villin-IL-15tg, sham n=8, gluten n=15; Dd-villin-IL-15tg, sham n=6, gluten n=19); mean; ANOVA / Tukey’s multiple comparison. (C-D) DQ8-Dd-villin-IL-15tg mice were maintained on a GFD (sham), fed with gluten for 30 days (gluten), or fed with gluten and concurrently treated with an anti-CD4 antibody (treatment regimen and efficacy summarized in Extended Data Figure 7). (C) H&E staining of ileum sections. Scale bar, 100 μm. The graph depicts the villous to crypt ratio. Six independent experiments (sham, n=10; gluten n=23; gluten + anti-CD4, n=11); mean; ANOVA) / Tukey’s multiple comparison. (D) Quantification of IELs among IECs. Six independent experiments (sham, n=10; gluten n=20; gluten + anti-CD4, n=10); mean; ANOVA / Tukey’s multiple comparison. (E-F) GSEA for gluten-responsive genes in DQ8-Dd-villin-IL-15tg and Dd-villin-IL-15tg mice. We contrast the enrichment scores for DQ8-Dd-villin-IL-15tg (x-axis) and Dd-villin-IL-15tg mice (y-axis) for all pathways enriched at an FDR <5% in at least of the strains, in the epithelium and the LP. Positive and negative scores represent enrichments among genes that are more highly or lowly expressed in gluten-fed animals, respectively. The bottom right quadrant refers to pathways, notably IFN-γ, that in response to gluten are up-regulated in DQ8-Dd-villin-IL-15tg but down-regulated in Dd-villin-IL-15tg mice. IFN-γ shows a reversed response to gluten when comparing DQ8-Dd-villin-IL-15tg against DQ8 mice (Extended Data Figure 8). (G-K) DQ8-Dd-villin-IL-15tg mice were maintained on a GFD (sham), fed with gluten for 30 days and concurrently treated with anti-IFN-γ antibody, anti-IFN-γ and IL-21R antibodies together or isotype control. (G) H&E staining of ileum sections. The graph depicts the villous to crypt ratio. Scale bar, 100 μm. Two independent experiments (sham, n=5, gluten n=8, gluten + anti-IFN-γ, n=6); mean; ANOVA / Tukey’s multiple comparison. (H) Quantification of IELs among IECs. Two independent experiments (sham, n=5; gluten n=8; gluten + anti-IFN-γ, n=6); mean; ANOVA / Tukey’s multiple comparison. (I) The intestinal epithelium was isolated and analyzed by flow cytometry. IELs were identified as TCRβ+ CD4 CD8+ cells. granzyme B+ IELs are indicated by absolute number / 100 IECs. Two independent experiments (sham, n=5, gluten + isotype, n=6, gluten + anti-IFN-γ, n= 5); mean; ANOVA / Tukey’s multiple comparison. (J) Serum anti-DGP IgG levels were measured by ELISA thirty days after gluten feeding. Four independent experiments (sham, n=14; gluten n=18; gluten + anti-IFN-γ + anti-IL-21R, n=11); mean; ANOVA/ Tukey’s multiple comparison. (K) Serum anti-gliadin IgG2c levels. Four independent experiments (sham, n=13; gluten n=17; gluten + anti-IFN-γ + anti-IL-21R, n=11); mean; ANOVA / Tukey’s multiple comparison.
Figure 4.
Figure 4.. DQ8-Dd-villin-IL-15tg mice represent a preclinical model for coeliac disease.
(A-C) DQ8-Dd-villin-IL-15tg mice were maintained on a GFD (sham), fed with gluten for 30 days (gluten), or fed with gluten with concurrent administration of transglutaminase 2 (TG2) inhibitors ERW1041E or CK805 intraperitonially twice daily (25 mg/kg) for 30 days (gluten + TG2 inhibitors). (A) TG2 protein (green) and TG2 enzymatic activity (red, as assessed by 5-biotinamido pentylamine (5-BP) crosslinking), were distinguished by IHC staining of frozen ileum sections. Scale bar, 200 μm. The graph depicts a semiquantitative analysis of the intensity of TG2 activity (5-BP) staining relative to the intensity of total TG2 protein, with each point representing the relative TG2 activity of an individual mouse. Three independent experiments (sham, n=6; gluten n=10; gluten + TG2 inhibitors n=11); mean ± s.e.m ; ANOVA / Tukey’s multiple comparison. (B) H&E staining of paraffin-embedded ileum sections. Scale bar, 200μm. The graphs show the means of the villous to crypt ratio for two independent experiments (sham, n=4; gluten n=9; gluten + CK805 n=9, left panel) and (sham, n=5; gluten n=9; gluten + ERW1041E n=9, right panel).One-way ANOVA / Tukey’s multiple comparison. (C) Transcriptional comparison of the intestinal epithelium and LP of gluten-fed DQ8-Dd-villin-IL-15tg mice and whole biopsies of active CeD patients. The figure shows the correlation between the log2 fold-changes in gene expression between gluten-fed DQ8 and DQ8-Dd-villin-IL-15tg mice (x-axis) in the epithelial compartment that encompass IELs and IECs (left panel) and the LP (right panel) and the log2 fold-changes in gene expression observed between active CeD patients (n=51) and healthy controls (n=45) (y-axis). The red density gradient shows the correlation among genes that are differentially expressed in gluten-fed DQ8-Dd-villin-IL-15tg mice.

Comment in

References

    1. Abadie V, Sollid LM, Barreiro LB & Jabri B Integration of genetic and immunological insights into a model of celiac disease pathogenesis. Annu Rev Immunol 29, 493–525 (2011). - PubMed
    1. Green PH & Cellier C Celiac disease. N Engl J Med 357, 1731–1743 (2007). - PubMed
    1. Plugis NM & Khosla C Therapeutic approaches for celiac disease. Best Pract Res Clin Gastroenterol 29, 503–521 (2015). - PMC - PubMed
    1. Jabri B & Sollid LM Tissue-mediated control of immunopathology in coeliac disease. Nat Rev Immunol 9, 858–870 (2009). - PubMed
    1. Husby S et al. European Society for Pediatric Gastroenterology, Hepatology, and Nutrition guidelines for the diagnosis of coeliac disease. J Pediatr Gastroenterol Nutr 54, 136–160 (2012). - PubMed

Additional References

    1. Meisel M et al. Interleukin-15 promotes intestinal dysbiosis with butyrate deficiency associated with increased susceptibility to colitis. ISME J 11, 15–30 (2017). - PMC - PubMed
    1. Pinto D, Robine S, Jaisser F, El Marjou FE & Louvard D Regulatory sequences of the mouse villin gene that efficiently drive transgenic expression in immature and differentiated epithelial cells of small and large intestines. J Biol Chem 274, 6476–6482 (1999). - PubMed
    1. Lefrancois L & Lycke N Isolation of mouse small intestinal intraepithelial lymphocytes, Peyer’s patch, and lamina propria cells. Curr Protoc Immunol Chapter 3, Unit 3 19 (2001). - PubMed
    1. Bouziat R et al. Reovirus infection triggers inflammatory responses to dietary antigens and development of celiac disease. Science 356, 44–50 (2017). - PMC - PubMed
    1. DiRaimondo TR et al. Elevated transglutaminase 2 activity is associated with hypoxia-induced experimental pulmonary hypertension in mice. ACS Chem Biol 9, 266–275 (2014). - PMC - PubMed