. 2020 Feb;578(7795):449-454.
doi: 10.1038/s41586-020-1996-3. Epub 2020 Feb 12.

Loss of p53 drives neuron reprogramming in head and neck cancer

Affiliations

Loss of p53 drives neuron reprogramming in head and neck cancer

Moran Amit et al. Nature. 2020 Feb.

Abstract

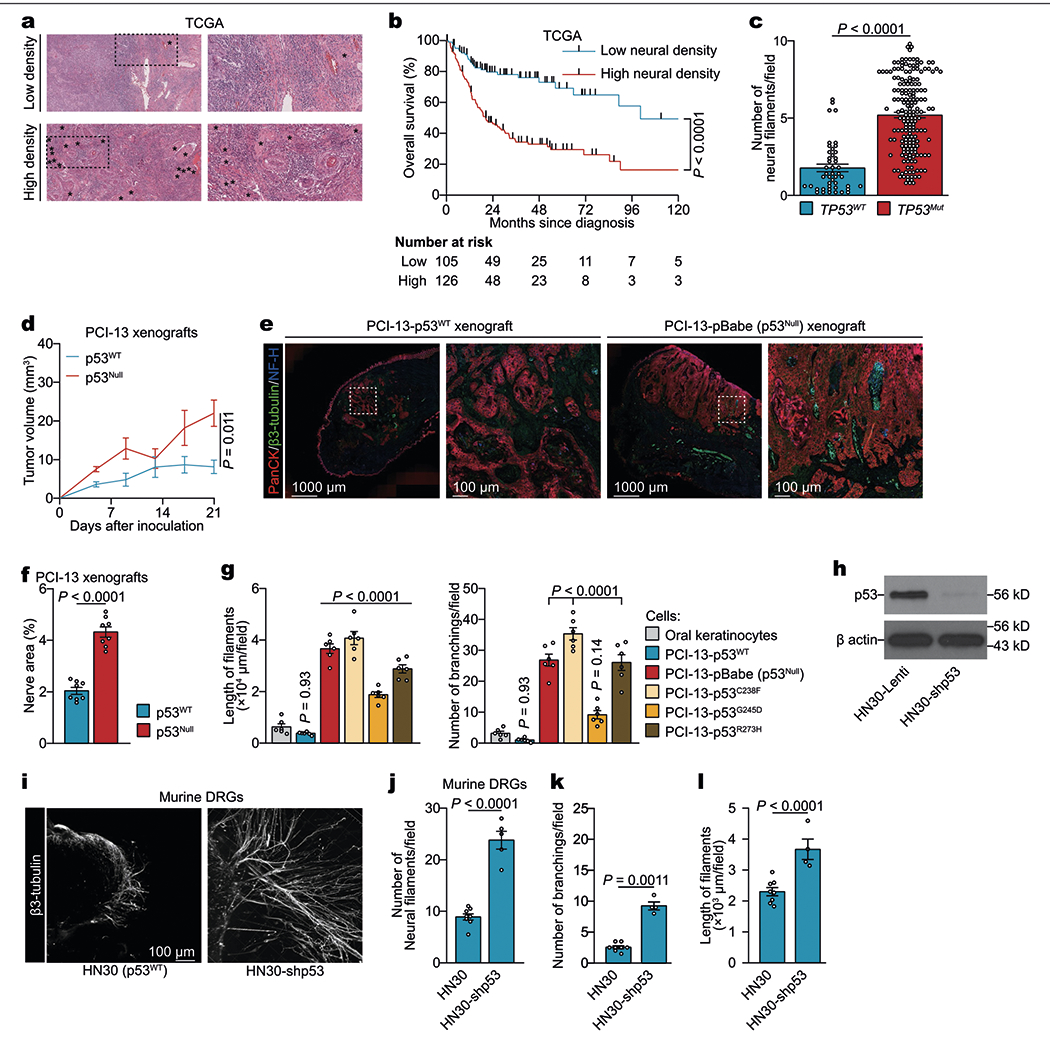
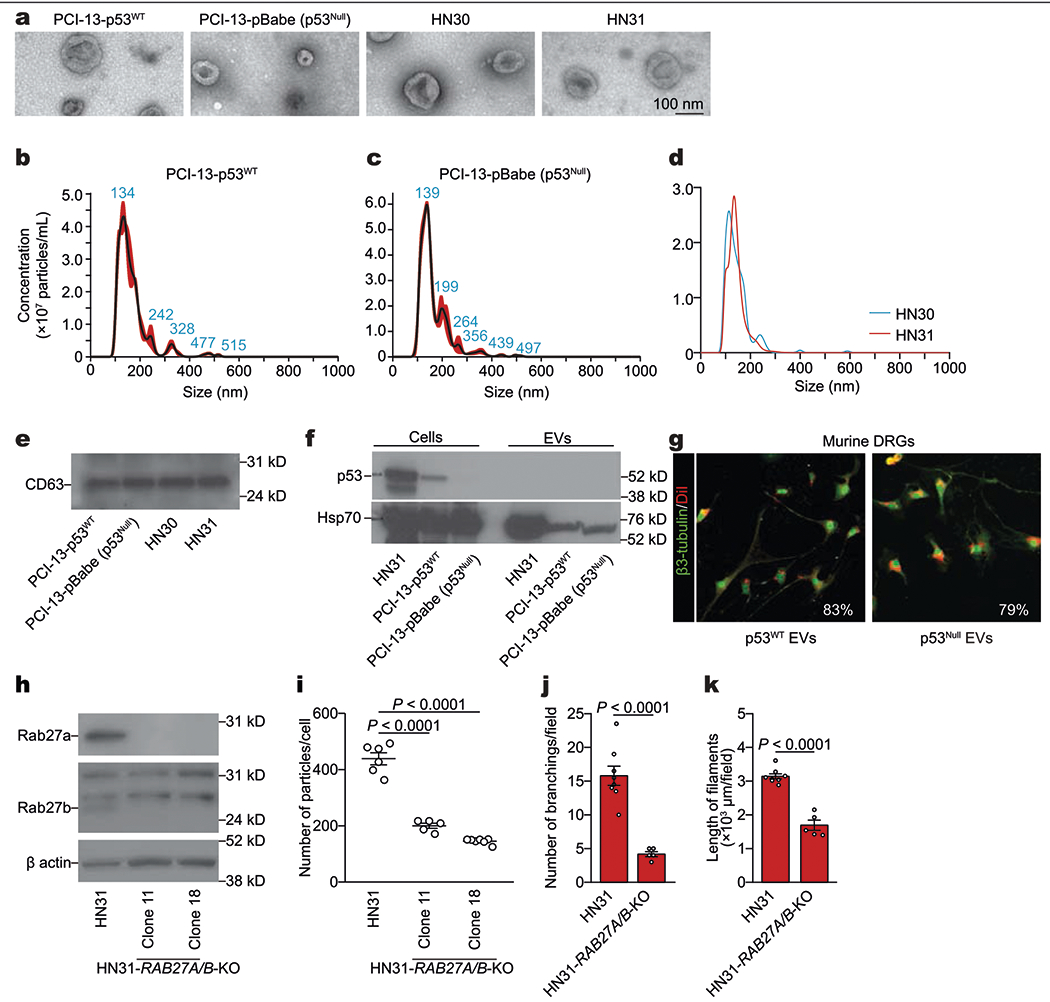
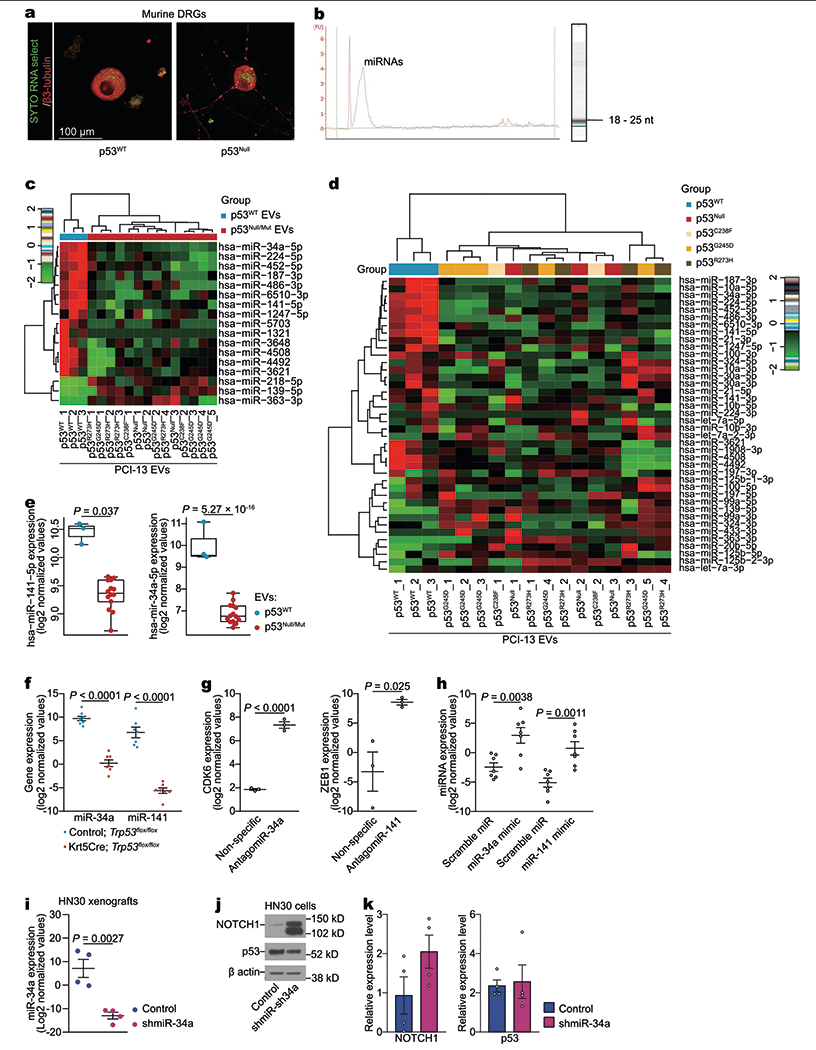
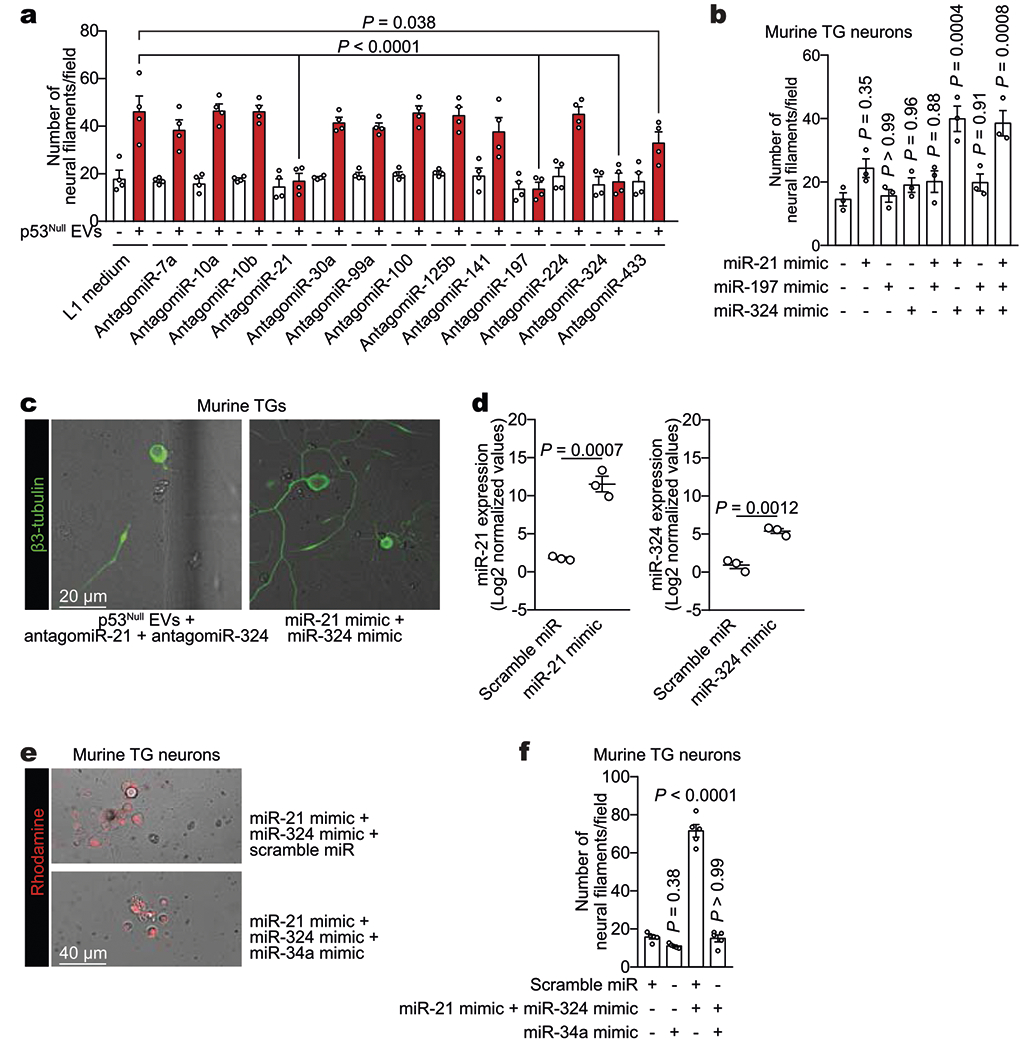
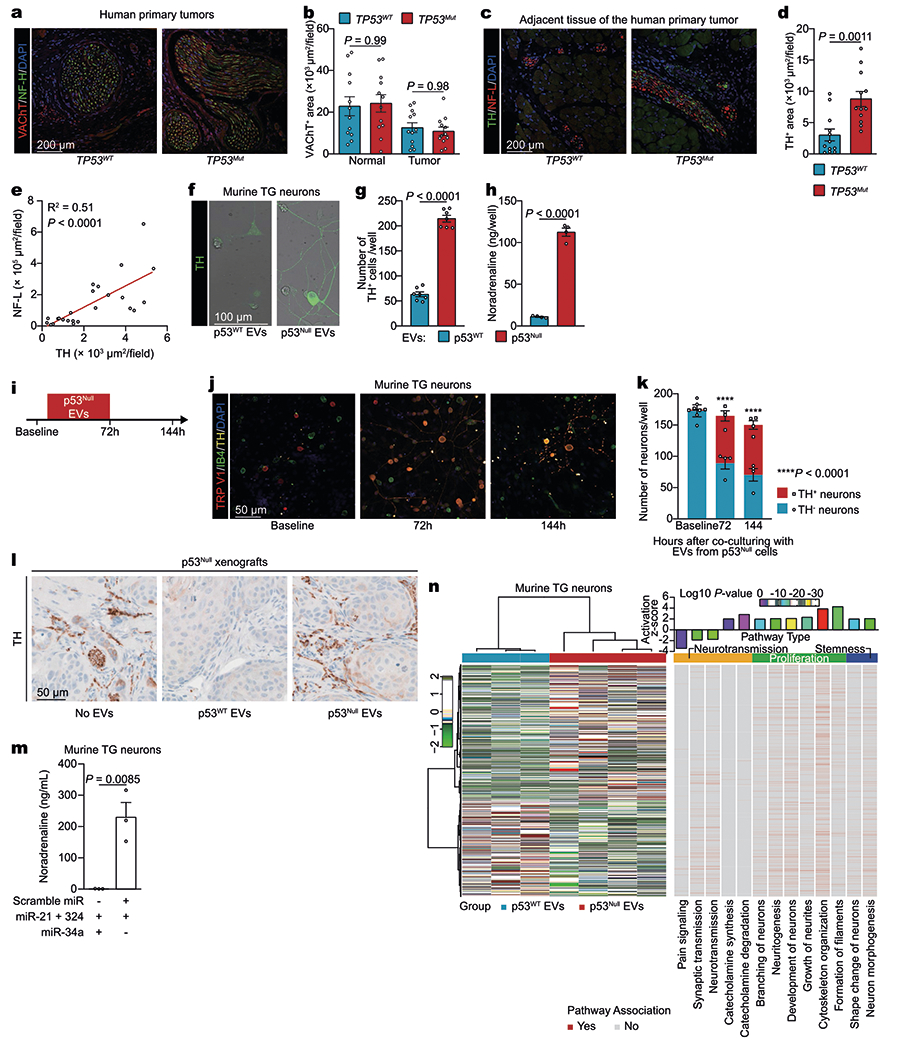
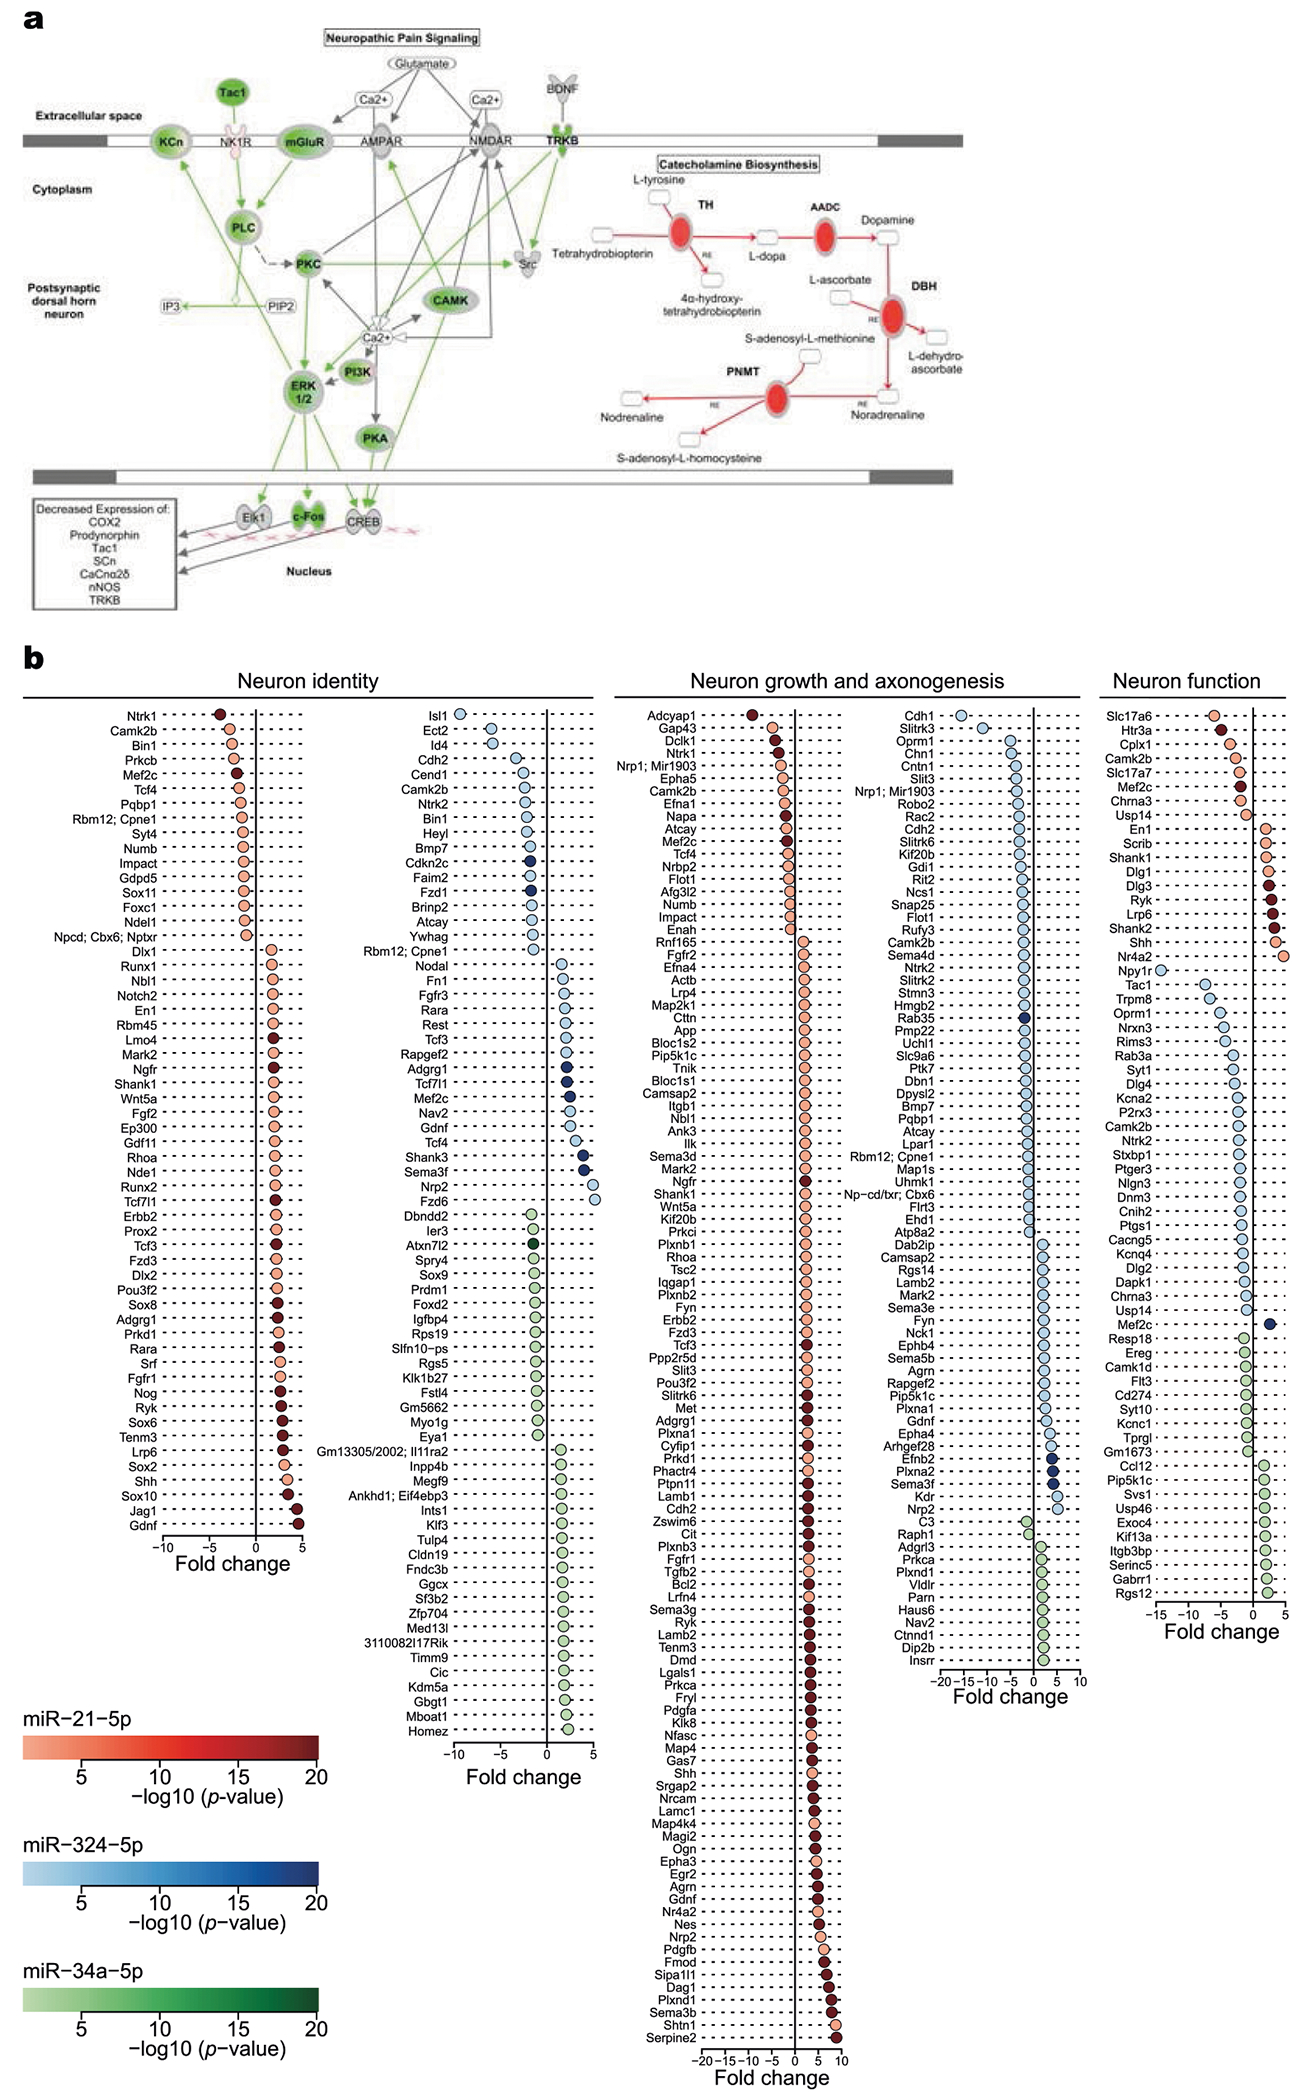
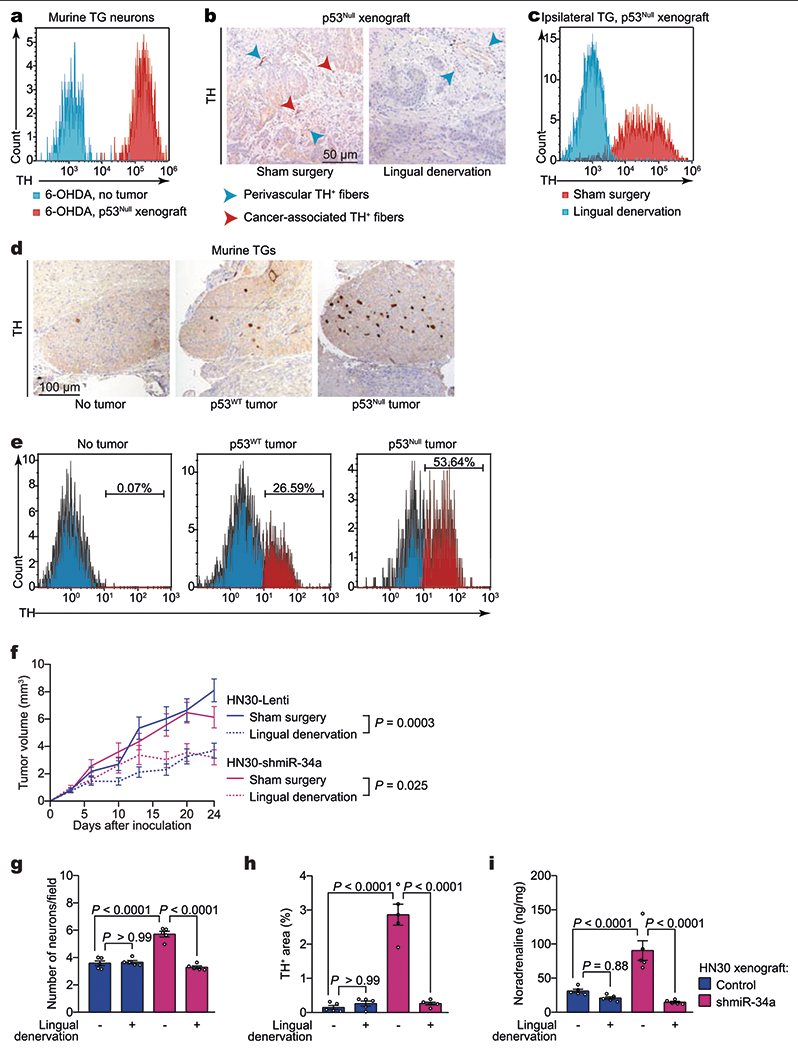
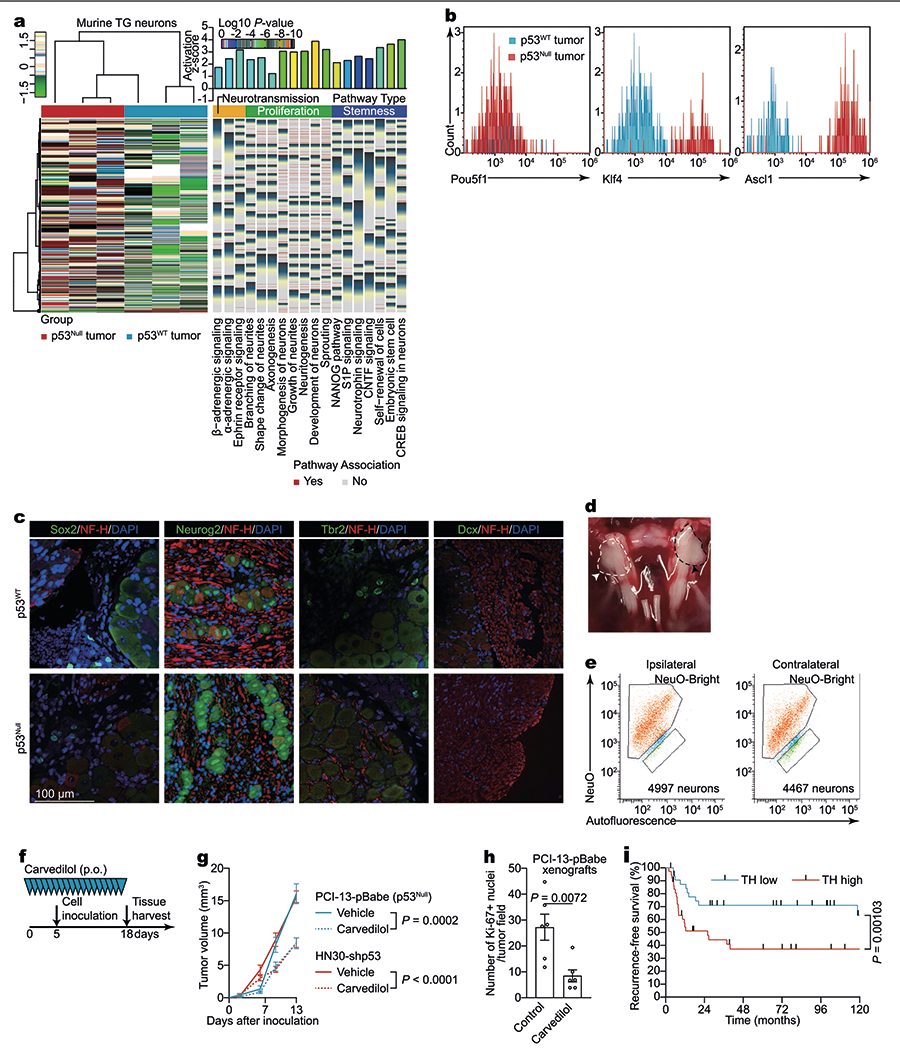
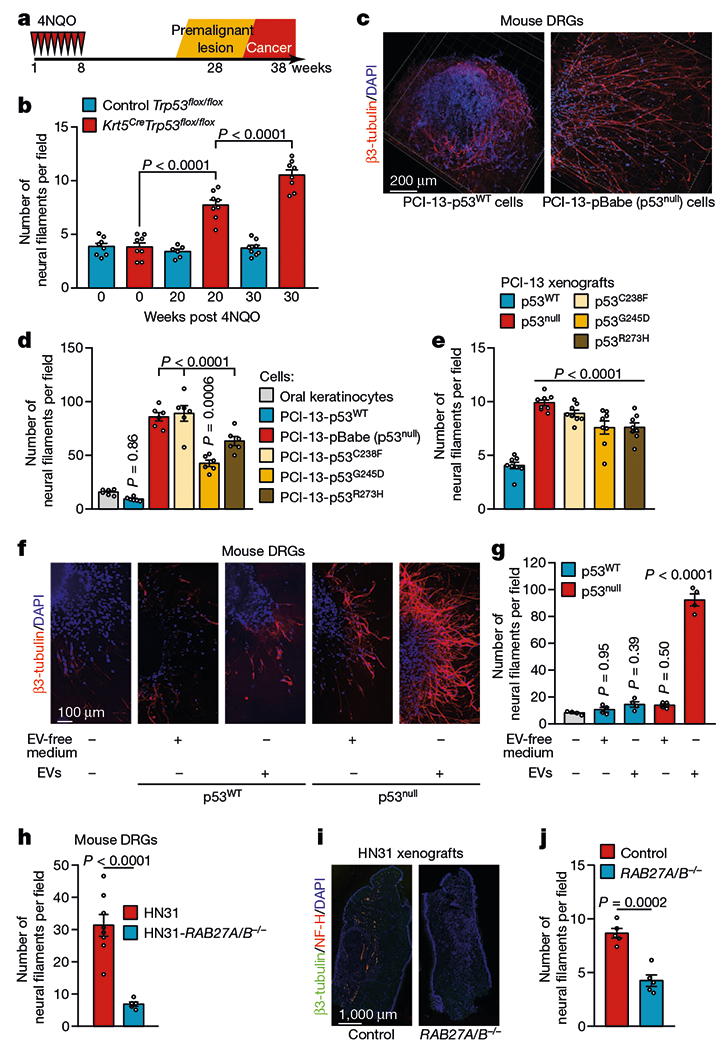
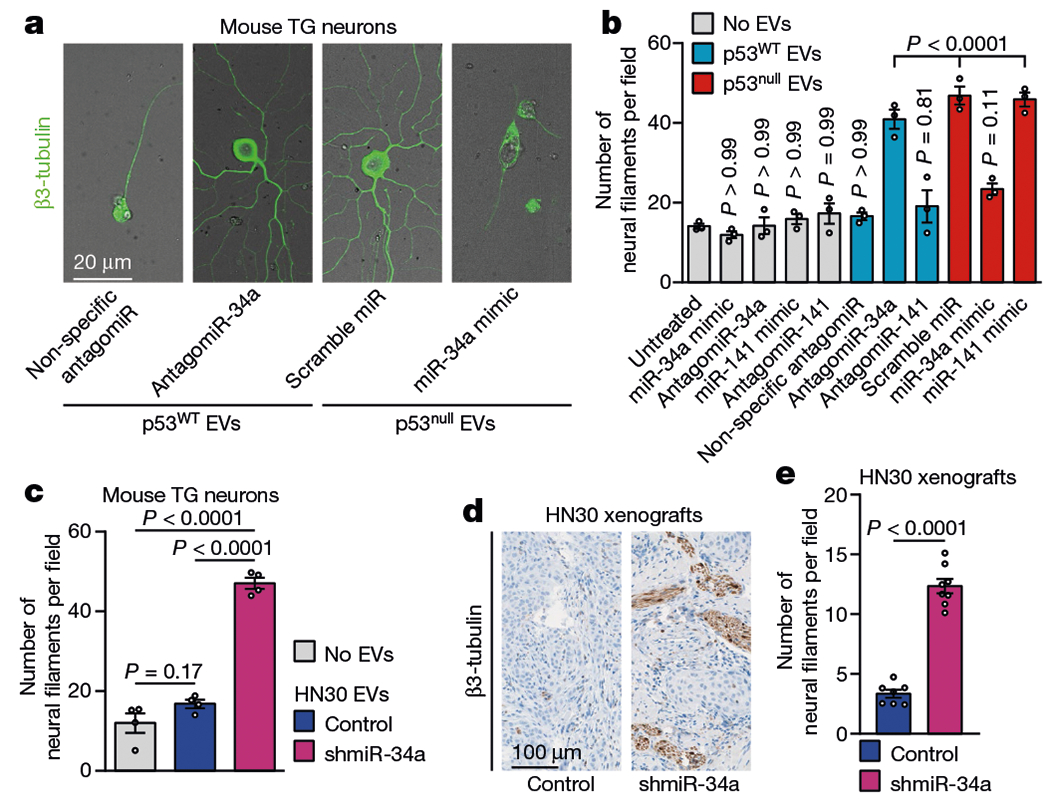
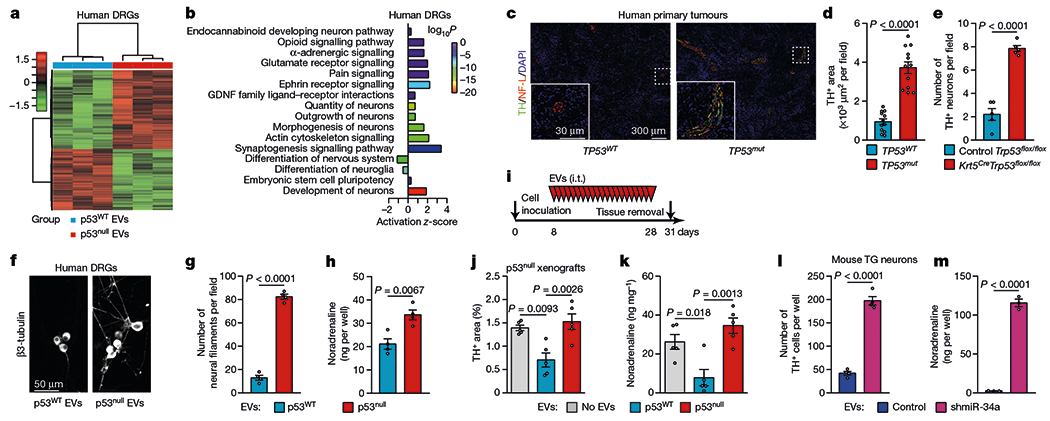
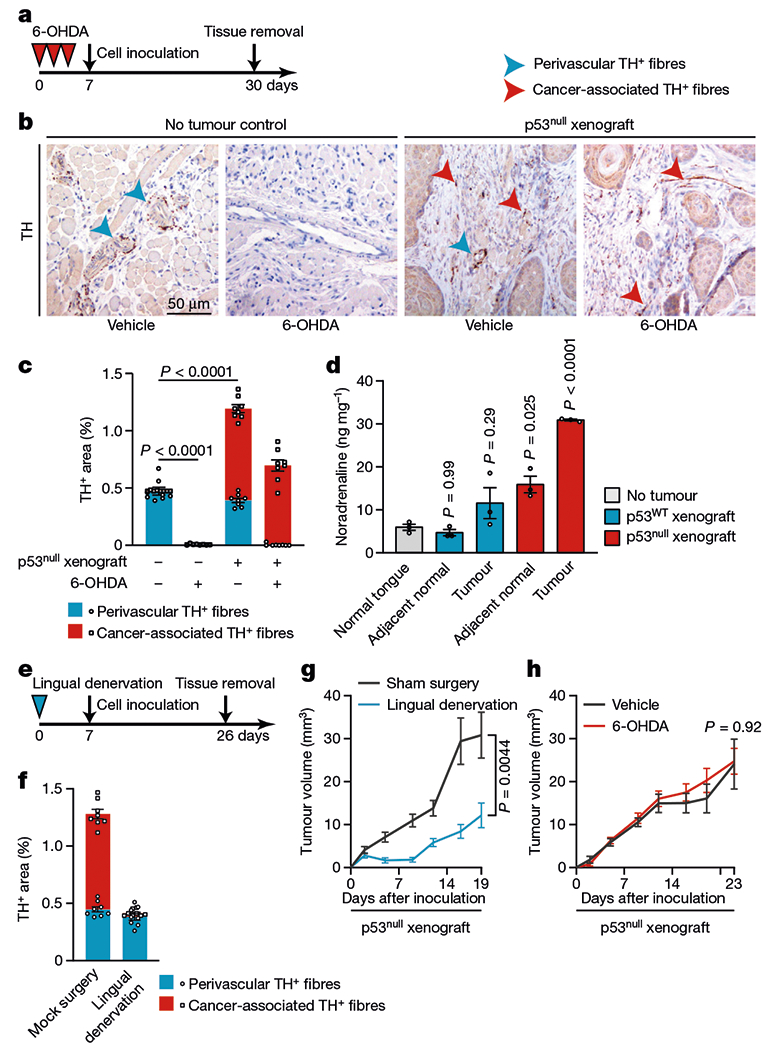
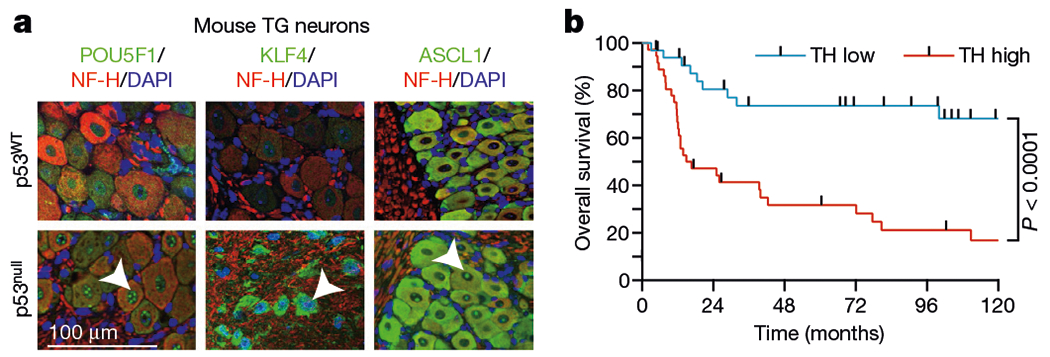
The solid tumour microenvironment includes nerve fibres that arise from the peripheral nervous system1,2. Recent work indicates that newly formed adrenergic nerve fibres promote tumour growth, but the origin of these nerves and the mechanism of their inception are unknown1,3. Here, by comparing the transcriptomes of cancer-associated trigeminal sensory neurons with those of endogenous neurons in mouse models of oral cancer, we identified an adrenergic differentiation signature. We show that loss of TP53 leads to adrenergic transdifferentiation of tumour-associated sensory nerves through loss of the microRNA miR-34a. Tumour growth was inhibited by sensory denervation or pharmacological blockade of adrenergic receptors, but not by chemical sympathectomy of pre-existing adrenergic nerves. A retrospective analysis of samples from oral cancer revealed that p53 status was associated with nerve density, which was in turn associated with poor clinical outcomes. This crosstalk between cancer cells and neurons represents mechanism by which tumour-associated neurons are reprogrammed towards an adrenergic phenotype that can stimulate tumour progression, and is a potential target for anticancer therapy.


Conflict of interest statement

Competing interests The authors declare no competing interests.

Figures

Extended Data Fig. 1 |
Extended Data Fig. 1 |. High nerve density was associated with the presence of p53 mutation.
a, Representative haematoxylin and eosin image of OCSCC samples from TCGA demonstrating low (top) and high (bottom) nerve densities; data independently replicated in 231 samples. Asterisks represent neural structures. b, Overall survival of patients with OCSCC with high (≥4 neurofilaments per field) and low nerve densities. Two-sided log-rank test. c, Quantification of nerve density in TCGA OCSCC patient cohort (n = 231). Bar graphs represent mean ± s.e.m. Unpaired two-tailed t-test. d, Serial in vivo analyses of PCI-13 cell engraftment and growth in BALB/c (nu/nu) mice (n = 6 per group). Tumour growth curves represent mean tumour volume ± s.e.m. Unpaired two-tailed t-test. e, Representative immunofluorescence of glossectomy specimens taken 4 weeks after orthotopic injection of isogenic p53WT or p53null PCI-13 cells; data independently replicated in 16 mice. f, Quantification of nerve area in p53WT and p53null OCSCC xenografts (n = 8 mice per group). g, Quantification of neuritogenesis in DRG co-cultured with p53-isogenic PCI-13 cells or normal oral keratinocytes (n = 6 biologically independent ganglia per cell line). h, Immunoblots demonstrating the knockdown of TP53 in human HN30 OCSCC cells; data replicated in two independent experiments. i, Representative immunofluorescence staining of neo-neurites (β3-tubulin+) in DRG co-cultured with HN30 (left) and HN30-shp53 (right) OCSCC cells. Data independently replicated in 13 samples. jl, In vitro quantification of number (j), branching (k), and length (l) of neurofilaments protruding from ex vivo DRG co-cultured with HN30 (n = 8 ganglia) or HN30-shp53 (n = 5 ganglia) OCSCC cells. Bar graphs represent mean ± s.e.m. One-way ANOVA with Tukey multiple comparison.
Extended Data Fig. 2 |
Extended Data Fig. 2 |. OCSCC-derived EVs and neuritogenesis.
a, Representative transmission electron microscopy image of EVs from isogenic PCI-13, HN30, and HN31 OCSCC cells; data replicated in two independent experiments. bd, Size distribution from nanoparticle tracking analysis of particles derived from p53WT (b) or p53null (c) PCI-13 cells or HN30 and HN31 (d) cells; data replicated in two independent experiments. e, Western blot of the EV marker CD63 in EVs from PCI-13 and HN30/HN31 cells; data replicated in two independent experiments. f, Western blot of the p53 and controls (HSP70) in p53WT or p53Null PCI-13 and HN31 cells and their corresponding cell-derived EVs; data replicated in three independent experiments. g, Confocal immunofluorescence images showing EVs (lipophilic DiI-labelled, red) in the cytoplasm of a neuron (labelled with β3-tubulin, green) 8 h after application of EVs derived from p53WT or p53null PCI-13 cells. Percentage represents the proportion of DiI+ β3-tubulin+ neurons out of all β3-tubulin+ neurons (n = 6 ganglia per condition). h, Immunoblots demonstrating the knockout (KO) of RAB27A and RAB27B in OCSCC cells edited with sgRNAs targeting RAB27A and RAB27B (HN31 clones 11 and 18, respectively) compared with HN31 controls; data replicated in two independent experiments. i, Nanoparticle tracking analysis of EV particle number in conditioned medium from HN31 clones 11 (n = 5 biologically independent samples) and 18 (n = 7 biologically independent samples) compared with HN31 controls (n = 6 biologically independent samples). Number of EVs was adjusted to cell number; bars represent mean ± s.e.m. Unpaired two-tailed t-test. j, k, In vitro quantification of branching (j) and neurofilament length (k) in freshly collected DRGs cultured with conditioned medium from HN31 RAB27A+/+RAB27B+/+ (n = 8) and HN31 RAB27A−/−RAB27B−/− (n = 5) isogenic human OCSCC cells. Bar graphs and tumour growth curves represent mean tumour volume ± s.e.m. Unpaired two-tailed t-test.
Extended Data Fig. 3 |
Extended Data Fig. 3 |. p53-dependent miRNA in OCSCC.
a, OCSCC RNA transfer to neurons via EVs. Representative confocal immunofluorescence image demonstrating PCI-13 cell-derived RNA labelled with SYTO RNASelect (green) in the perinuclear cytoplasm of a neuron (labelled with β3-tubulin, red). Images were captured 12 h after application of EVs derived from PCI-13 cells labelled with SYTO RNASelect; data replicated in two independent experiments. b, EVs derived from PCI-13 cells contained mainly small RNA species. Bioanalyzer results showing presence of RNA in EVs from PCI-13 cells. Representative band of EV RNA by Agilent RNA Pico Chips; data independently replicated in ten experiments. c, An unsupervised hierarchical clustering heat map showing differentially expressed EV miRNAs between p53-isogenic PCI-13 cells. p53WT, n = 3 biologically independent samples; p53null and p53mut, n = 14 biologically independent samples. d, Heat map of differentially expressed miRNA, arranged by unsupervised hierarchical clustering, presenting the miRNA sequencing for EVs derived from isogenic PCI-13 cells expressing p53WT versus no p53 (p53null) or mutant p53 (p53C238F, p53G245D, and p53R273H). The Pearson distance and Ward’s minimum variance method were used for pairwise clustering (c, d). Red and green indicate increased and decreased expression levels, respectively (n = 2 to 5 per group). e, Fold change in hsa-miR-141-5p and hsa-miR-34a-5p in EVs derived from p53WT PCI-13 cells (blue, n = 3 biologically independent samples) compared with p53null or p53mut cells (red, n = 14 biologically independent samples). Results are log2 normalized. f, Real-time PCR quantification of miR-34a and miR-141 in ventral tongues from Trp53flox/flox and Krt5CreTrp53flox/flox mice (n = 7 per group). g, Real-time PCR quantification of CDK6 (miR-34a target) and ZEB1 (miR-141 target) in neurons treated with antagomiR-34 or antagomiR-141 compared with nonspecific antagomiR-treated controls (n = 3 biologically independent samples per group). h, Quantitative validation of miR-34a and miR-141 overexpression after transfection with miR-34a and miR-141 mimics, respectively. TG neurons were transfected with miR-34a mimic, miR-141 mimic, or scramble miR, and overexpression of miR-34a and miR-141 was confirmed by real-time PCR (n = 7 biologically independent samples per group). i, Real-time PCR quantification of miR-34a in orthotopic tumour xenografts of HN30 OCSCC cells treated with shControl (blue) or shmiR-34a (purple). n = 4 biologically independent samples per group. j, k, Western blot of NOTCH1 (confirmed miR-34a target) in OCSCC transfected with lentiviral miR-34a inhibitor or scramble miRNA inhibitor (j). Bar graph quantification of the blots demonstrates no impact of miR-34a inhibition on p53 expression and is normalized to the total amount of β-actin (n = 4 biologically independent samples per group, j). Unpaired two-tailed t-test; bars and dot plots represent mean ± s.e.m. (ei, k).
Extended Data Fig. 4 |
Extended Data Fig. 4 |. microRNAs modulate neuritogenesis.
a, Screening of candidate neuritogenesis-associated miRNAs. Quantification of neuritogenesis 72 h after neuron–EV co-culture. Eight hours after transfection with 13 different antagomiRs, TG neurons were incubated with EVs derived from p53null PCI-13 cells (n = 4 biologically independent samples per condition). One-way ANOVA with Tukey multiple comparison. b, Quantification of neuritogenesis in TG neurons 72 h after transfection with miR-21 mimic, miR-197 mimic, or miR-324 mimic or co-transfection with their combinations (n = 3 biologically independent samples per condition). c, Representative fluorescent–bright-field overlay images demonstrating the lack of response of TG neurons exposed to EVs derived from p53null PCI-13 cells after co-transfection with antagomiR-21 and antagomiR-324 and the response of TG neurons after miR-21 and miR-324 mimic co-transfection. Data replicated across six independent samples. d, Quantitative validation of miR-21 and miR-324 overexpression in TG neurons incubated with liposomes containing miR-21, miR-324, and scramble miRNA (n = 3 biologically independent samples per group). e, Representative fluorescence–bright-field overlay images of TG neurons exposed to liposomes containing miR-21, miR-324, and scramble miRNA or liposomes containing miR-21, miR-324, and miR-34a; data independently replicated in 20 wells. f, Quantification of neuritogenesis in TG neurons 72 h after neuron–liposome co-culture (n = 5 biologically independent samples per condition). Unpaired two-tailed t-test; bars represent mean ± s.e.m. (a, b, d) or one-way ANOVA with Tukey multiple comparisons (f).
Extended Data Fig. 5 |
Extended Data Fig. 5 |. TP53 deficiency does not change parasympathetic nerve fibre densities in human OCSCC specimens.
a, b, Representation of vesicular acetylcholine transporter (VAChT)+ nerve densities in both TP53WT and TP53mut OCSCC tissues; data independently replicated in 24 patient specimens (a). Quantification of cholinergic VAChT+ neural areas in TP53-sufficient (TP53WT, blue, n = 12) and TP53-deficient (TP53mut, red, n = 12) human OCSCC tissues. Each dot represents the mean for one patient (b). NF-H, neurofilament heavy. c, d, TP53 deficiency increases the sympathetic nerve fibre density in normal tongue tissue surrounding OCSCC in humans. Representative images showing TH+ adrenergic neural fibres in human normal tongue tissue surrounding OCSCC with TP53WT (left) or TP53mut (right) (TH, green; neurofilament light (NF-L), red; DAPI, blue). Data independently replicated in 24 patient specimens (c). Quantification of adrenergic TH+ areas in TP53-sufficient (TP53WT, blue, n = 12) and TP53-deficient (TP53mut, red, n = 12) human OCSCC samples. Each dot represents the mean for a patient (d). e, Correlation of TH and NF-L expression levels. Linear regression (r2, n = 24 biologically independent samples). fh, Representative images of TG neurons labelled with anti-TH antibody after incubation with EVs derived from p53WT or p53null PCI-13 cells; data independently replicated in 14 wells (f). Quantification of TH+ neurons (n = 7 biologically independent samples per condition, g), and noradrenaline levels (n = 4 biologically independent samples per condition, h). ik, Co-culture of TG neurons with p53null EVs for 72 h induced TH coexpression in TRPV1+ but not IB4+ neurons; TH expression remained stable 72 h after washout of the EVs. n = 4 biologically independent samples per condition (k). l, TH+ neural areas in PCI-13–p53null orthotopic tumours injected daily with no EVs or with EVs derived from p53null or p53WT PCI-13 cells for 3 weeks; data independently replicated in 15 mice. m, Co-culture of TG with liposomes containing miR-21 and miR-324 but not miR-34a increases catecholamine synthesis. Noradrenaline levels in neurons cultured with nano-liposomes containing miR-21 + miR-34a + miR-324 or miR-21 + miR-324 controls, quantified by enzyme-linked immunosorbent assay. n = 3 biologically independent samples per condition. n, Heat map of differentially expressed genes in mouse TG neurons co-cultured with p53-isogenic EVs. Enriched Gene Ontology terms of the neurons were plotted at fold enrichment with the associated log P value (Fisher’s exact algorithm for functional gene set enrichment); n = 3 biologically independent samples for p53WT and n = 4 biologically independent samples for p53null. Mean ± s.e.m.; unpaired two-tailed t-test (b, d, g, h, k, m).
Extended Data Fig. 6 |
Extended Data Fig. 6 |. Target analysis for miR-21, miR-34a, and miR-324.
a, Schematic of ingenuity pathway analysis of pain signalling (silenced, green) and noradrenaline biosynthesis (activated, red). AADC, aromatic l-amino acid decarboxylase; DBH, dopamine β-hydroxylase; PNMT, phenylethanolamine N-methyltransferase. b, Total RNA was collected to assess global gene changes after TG neurons were transfected with miR-21 (red), miR-324 (blue), miR-34a (green), or scrambled miRNA. Data show fold change in expression of potential targets involved in neural identity determination (left), neural growth (middle), and neural function (right) between neurons transfected with different miRNAs (n = 3 biologically independent samples per condition). P values obtained from the moderated t-statistic for the presented genes were <0.05. Forest plots displaying fold change and P values for genes on different neuron pathways that are significantly differentiated between TG neurons transfected with miR-21, miR-34a or miR-324 and scramble miRNA. Linear models and empirical Bayes methods were used for obtaining the statistics and assessing differential gene expression between two conditions.
Extended Data Fig. 7 |
Extended Data Fig. 7 |. Loss of p53 in OCSCC induces adrenergic switch proximally in TG neurons.
a, Flow cytometry quantification of neurotrophin-3-positive (NT3+), TH+ neurons in freshly collected ipsilateral TG neurons 3 weeks after orthotopic inoculation of p53null PCI-13 cells to the tongues of sympathectomized mice. Non-tumour-bearing, sympathectomized mice were used as controls (n = 6). b, Representative immunohistochemical analysis for TH+ in orthotopic xenografts; data independently replicated in 16 mice. c, Flow cytometry quantification of NT3+TH+ neurons in ipsilateral TG neurons (n = 6 mice per condition). d, Representative images of TH+ TG neurons in mice without tumours (left) and 3 weeks after injection of p53WT (middle) or p53null (right) PCI-13 cells to the ipsilateral tongue; data independently replicated in nine mice. e, Flow cytometry quantification of NT3+ TH+ neurons in freshly collected ipsilateral TG 3 weeks after orthotopic inoculation of p53WT (middle) and p53null (right) PCI-13 cells to the tongue. Non-tumour-bearing mice were used as controls (left, n = 12 per group). f, Serial in vivo analyses of tumour growth after engraftment of HN30 transfected with either control lentivirus (HN30-lenti) or shmiR34a (HN30-shmiR34a) into BALB/c (nu/nu) mice. Mice were randomized and underwent lingual denervation or sham surgery 1 week before cell injection (n = 8 per group). Tumour growth curves represent mean tumour volume ± s.e.m.; unpaired two-tailed t-test. gi, Neural density (g), TH+ area (h), and noradrenaline levels in vivo (i) in HN30-lenti and HN30-shmiR34a orthotopic xenografts with and without lingual denervation (n = 5 biologically independent samples per condition). Bars indicate mean ± s.e.m.; unpaired two-tailed t-test.
Extended Data Fig. 8 |
Extended Data Fig. 8 |. Characterization of OCSCC-induced neural transcriptional program.
a, Heat map of differentially expressed genes arranged by unsupervised hierarchical clustering in TG neurons 3 weeks after orthotopic injection of p53null or p53WT PCI-13 cells (n = 3 biologically independent samples per condition) and enriched Gene Ontology terms plotted by fold enrichment with the associated log P value (right; Fisher’s exact algorithm for functional gene set enrichment). b, Flow cytometry quantification of NeuroFluor-positive (NeuO+), POU5F1+ (left), NeuO+KLF4+ (middle), and NeuO+ASCL1+ (right) neurons in ipsilateral TGs after orthotopic injection of p53null or p53WT PCI-13 cells; data independently replicated in six mice. c, Representative images in freshly collected TG neurons (red, NF-H+) from BALB/c (nu/nu) mice after orthotopic injection of either p53null or p53WT PCI-13 cells to the ipsilateral tongue, demonstrating lack of nuclear expression of the transcription factors SOX2, TBR2, and DCX and similar neurogenin2 expression between groups. Data independently replicated in six mice; DAPI, blue. d, e, Representative necropsy photograph (TG delineated by dashed line in c) and flow cytometry quantification of NeuO+ neurons in freshly collected TG 3 weeks after tumour injection to the left side of the tongue; ipsilateral (c, right, black arrowhead) and contralateral (c, left, white arrowhead) ganglia were similar in size. None of the tumours crossed the midline of the tongue (n = 6). f, g, Mice were treated daily with either β-adrenergic receptor blocker carvedilol or vehicle via oral gavage. On day 5, mice were orthotopically xenografted with human p53-deficient (p53null PCI-13 or HN30-shp53) cells to the tongue. Serial in vivo tumour volume measurement (n = 12 per group except for p53null PCI-13 tumour-bearing mice with carvedilol treatment, n = 13; f). h, Adrenergic inhibition decreases OCSCC proliferation in vivo. Carvedilol injections inhibited the proliferation of p53null PCI-13 cells orthotopically implanted into the tongue, as determined by Ki-67 expression (n = 6 biologically independent samples per condition). i, Kaplan–Meier curves showing the recurrence-free survival of patients with high (>2,000 μm2 per field) and low (≤2,000 μm2 per field) TH+ adrenergic nerve densities. Mean ± s.e.m.; unpaired two-tailed t-test.
Fig. 1 |
Fig. 1 |. Loss of p53 alters the neural microenvironment throughout tumour evolution.
a, Tumour progression in Krt5.Cre;B6.129P2-Trp53tm1Brn/J (Krt5CreTrp53flox/flox) and B6.129P2-Trp53tm1Brn/J (Trp53flox/flox) control mice. b, Quantification of neural density in tongues from Trp53flox/flox and Krt5CreTrp53flox/flox mice immediately after the end of treatment with the carcinogen 4-nitroquinoline 1-oxide (4NQO) (normal mucosa), 20 weeks after treatment completion (low-grade lesions), and 30 weeks after treatment completion (high-grade lesions) (n = 8 except for control group at 20 weeks (n = 6)). c, Representative immunofluorescence staining of DRGs co-cultured with p53WT or p53null PCI-13 cells; data independently replicated in 12 ganglia. d, Quantification of neuritogenesis in DRGs co-cultured with p53-isogenic PCI-13 cells or normal oral keratinocytes (n = 6 biologically independent ganglia per cell line). e, Analysis of neural density in orthotopic p53-isogenic PCI-13 xenograft cells (n = 8 mice per group). f, Representative immunofluorescence of in vitro neuritogenesis in DRGs treated with soluble factors (EV-depleted conditioned medium) or EVs from p53-isogenic PCI-13 cells; data independently replicated in 20 ganglia. g, In vitro quantification of neuritogenesis (n = 4 biologically independent ganglia per condition). h, Quantification of neuritogenesis in freshly collected DRG cultured with conditioned medium from HN31 RAB27A/RAB27B-isogenic human OCSCC cells (n = 8 and n = 5 biologically independent ganglia for HN31 RAB27A−/−RAB27B−/− and HN31 RAB27A+/+RAB27B+/+ cells respectively). i, Representative immunofluorescence montage of glossectomy specimens derived from mice 3 weeks after injection of HN31 RAB27A/RAB27B-isogenic OCSCC cells; data independently replicated in 10 mice. j, In vivo analyses of neural density (n = 5 mice per group). Unpaired two-tailed t-test (h, j) and one-way ANOVA with Tukey multiple comparisons (b, d, e, g). Bar graphs represent mean ± s.e.m.
Fig. 2 |
Fig. 2 |. p53-dependent alterations in miRNA populations control neuritogenesis.
a, Representative fluorescence–bright-field overlay images of TG neurons after transfection with antagomiR-34a and incubation with EVs from p53WT PCI-13 cells EVs (left) and after transfection with miR-34a mimic and incubation with EVs from p53null PCI-13 cells (right); data independently replicated in 12 wells. b, Quantification of neuritogenesis 72 h after neuron–EV co-culture. EV-free medium (grey bars) or non-specific antagomiR/miR-mimic transfection were used as controls (n = 3 biologically independent samples per condition). c, Quantification of neuritogenesis in TG neurons 72 h after neuron-EV co-culture using EVs from p53WT OCSCC cells stably expressing a short hairpin targeting miR-34a (shmiR-34a) or non-specific control (n = 4 biologically independent samples per condition). d, Representative images showing β3-tubulin-positive neural fibres in orthotopic OCSCC xenografts stably expressing shmiR-34a (n = 8 mice) or non-specific control (n = 7 mice); data independently replicated in 15 mice. e, Quantification of neural density 3 weeks after orthotopic injection as in d. Bar graphs represent mean ± s.e.m. Unpaired two-tailed t-test (c, e) or one-way ANOVA with Tukey multiple comparisons (b).
Fig. 3 |
Fig. 3 |. p53-deficient tumours are enriched with adrenergic nerve fibres.
a, b, Heat map (a) and enriched Gene Ontology terms (b) for differentially expressed genes in freshly collected human DRG neurons incubated with EVs from p53WT or p53null PCI-13 cells, plotted by fold enrichment with the associated log P value (Fisher’s exact algorithm for functional gene set enrichment); n = 3 biologically independent samples per condition. c, Representative images showing TH+ adrenergic neural fibres in TP53WT or TP53mut human OCSCC tissue; data independently replicated in 24 patient specimens. d, Quantification of TH+ areas as in c (n = 12 independent samples per group). e, Quantification of TH+ neural fibres in tumours from Krt5CreTrp53flox/flox and control mice (n = 5). f, Representative images of neo-neurites (β3-tubulin+) in human DRG co-cultured with EVs from p53WT or p53null PCI-13 cells; data independently replicated in 8 wells. g, h, Quantification of neuritogenesis (g) and noradrenaline levels (h) in human DRGs as in f (n = 4 biologically independent samples per condition). ik, PCI-13-p53null orthotopic tumours were injected daily with no EVs (vehicle) or with EVs from p53null or p53WT PCI-13 cells for 3 weeks (n = 5 mice per group, i), and TH+ neural areas (j) and noradrenaline levels (k) in the tongue were measured. l, m, TG neurons were co-cultured with EVs from p53WT OCSCC cells treated with lentiviral miR-34a or non-specific inhibitors. Quantification of TH+ TG neurons (n = 4 mice per condition, l), and noradrenaline levels (n = 3 biologically independent samples per condition, m). Bars represent mean ± s.e.m. Unpaired two-tailed t-test (d, e, g, h, l, m) or one-way ANOVA with Tukey multiple comparisons (j, k).
Fig. 4 |
Fig. 4 |. De novo transdifferentiated cancer-associated adrenergic nerves support tumour growth.
a, BALB/c (nu/nu) mice were chemically sympathectomized by intraperitoneal injection of 6-OHDA and then injected orthotopically with p53null PCI-13 cells. Tumour volume was monitored for 3 weeks. b, Illustrative immunohistochemical analysis for TH+ neural fibres in tongues from mice with or without tumours and with or without sympathectomy. Blue arrowheads, pre-existing TH+ perivascular neural fibres; red arrowheads, non-perivascular TH+ fibres that emerged after tumour formation (cancer-associated nerves); data independently replicated in 32 mice. c, Perivascular and cancer-associated TH+ area (n = 8 mice per condition). d, Noradrenaline levels in tumour-bearing tongue (ipsilateral to tumour injection site), adjacent normal tongue (contralateral to tumour injection site), and normal tongue controls (n = 3). e, BALB/c (nu/nu) mice were orthotopically xenografted with p53null PCI-13 cells to the denervated or sham-operated tongue. f, Quantification of TH+ nerve fibres in mice from e (n = 8 mice per condition). g, h, In vivo p53null PCI-13 tumour growth after lingual denervation (blue, n = 12) compared with sham surgery controls (n = 10, g), or chemical sympathectomy (red, n = 12) compared with vehicle controls (n = 11, h). Bar graphs and tumour growth curves represent mean ± s.e.m. Unpaired two-tailed t-test (g, h) or one-way ANOVA with Tukey multiple comparisons (c, d, f).
Fig. 5 |
Fig. 5 |. Retrograde signalling by p53-deficient but not p53-sufficient cancer cells activates neural reprogramming.
a, Representative images demonstrating expression of POU5F1, KLF4, and ASCL1 in ipsilateral TGs after orthotopic injection of p53WT (upper) or p53null (lower) PCI-13 cells; data independently replicated in six mice. b, Kaplan–Meier curves showing the overall survival of patients with high and low TH+ adrenergic nerve densities. Two-sided log-rank test.

Comment in

References

    1. Magnon C et al. Autonomic nerve development contributes to prostate cancer progression. Science 341, 1236361 (2013). - PubMed
    1. Ayala GE et al. Cancer-related axonogenesis and neurogenesis in prostate cancer. Clin. Cancer Res. 14, 7593–7603 (2008). - PubMed
    1. Zahalka AH et al. Adrenergic nerves activate an angio-metabolic switch in prostate cancer. Science 358, 321–326 (2017). - PMC - PubMed
    1. Ravi R et al. Regulation of tumor angiogenesis by p53-induced degradation of hypoxia-inducible factor 1α. Genes Dev. 14, 34–44 (2000). - PMC - PubMed
    1. Schmid JO et al. Cancer cells cue the p53 response of cancer-associated fibroblasts to cisplatin. Cancer Res. 72, 5824–5832 (2012). - PubMed

MeSH terms