. 2020 Feb;578(7796):593-599.
doi: 10.1038/s41586-020-1999-0. Epub 2020 Feb 12.

MAFG-driven astrocytes promote CNS inflammation

Affiliations

MAFG-driven astrocytes promote CNS inflammation

Michael A Wheeler et al. Nature. 2020 Feb.

Abstract

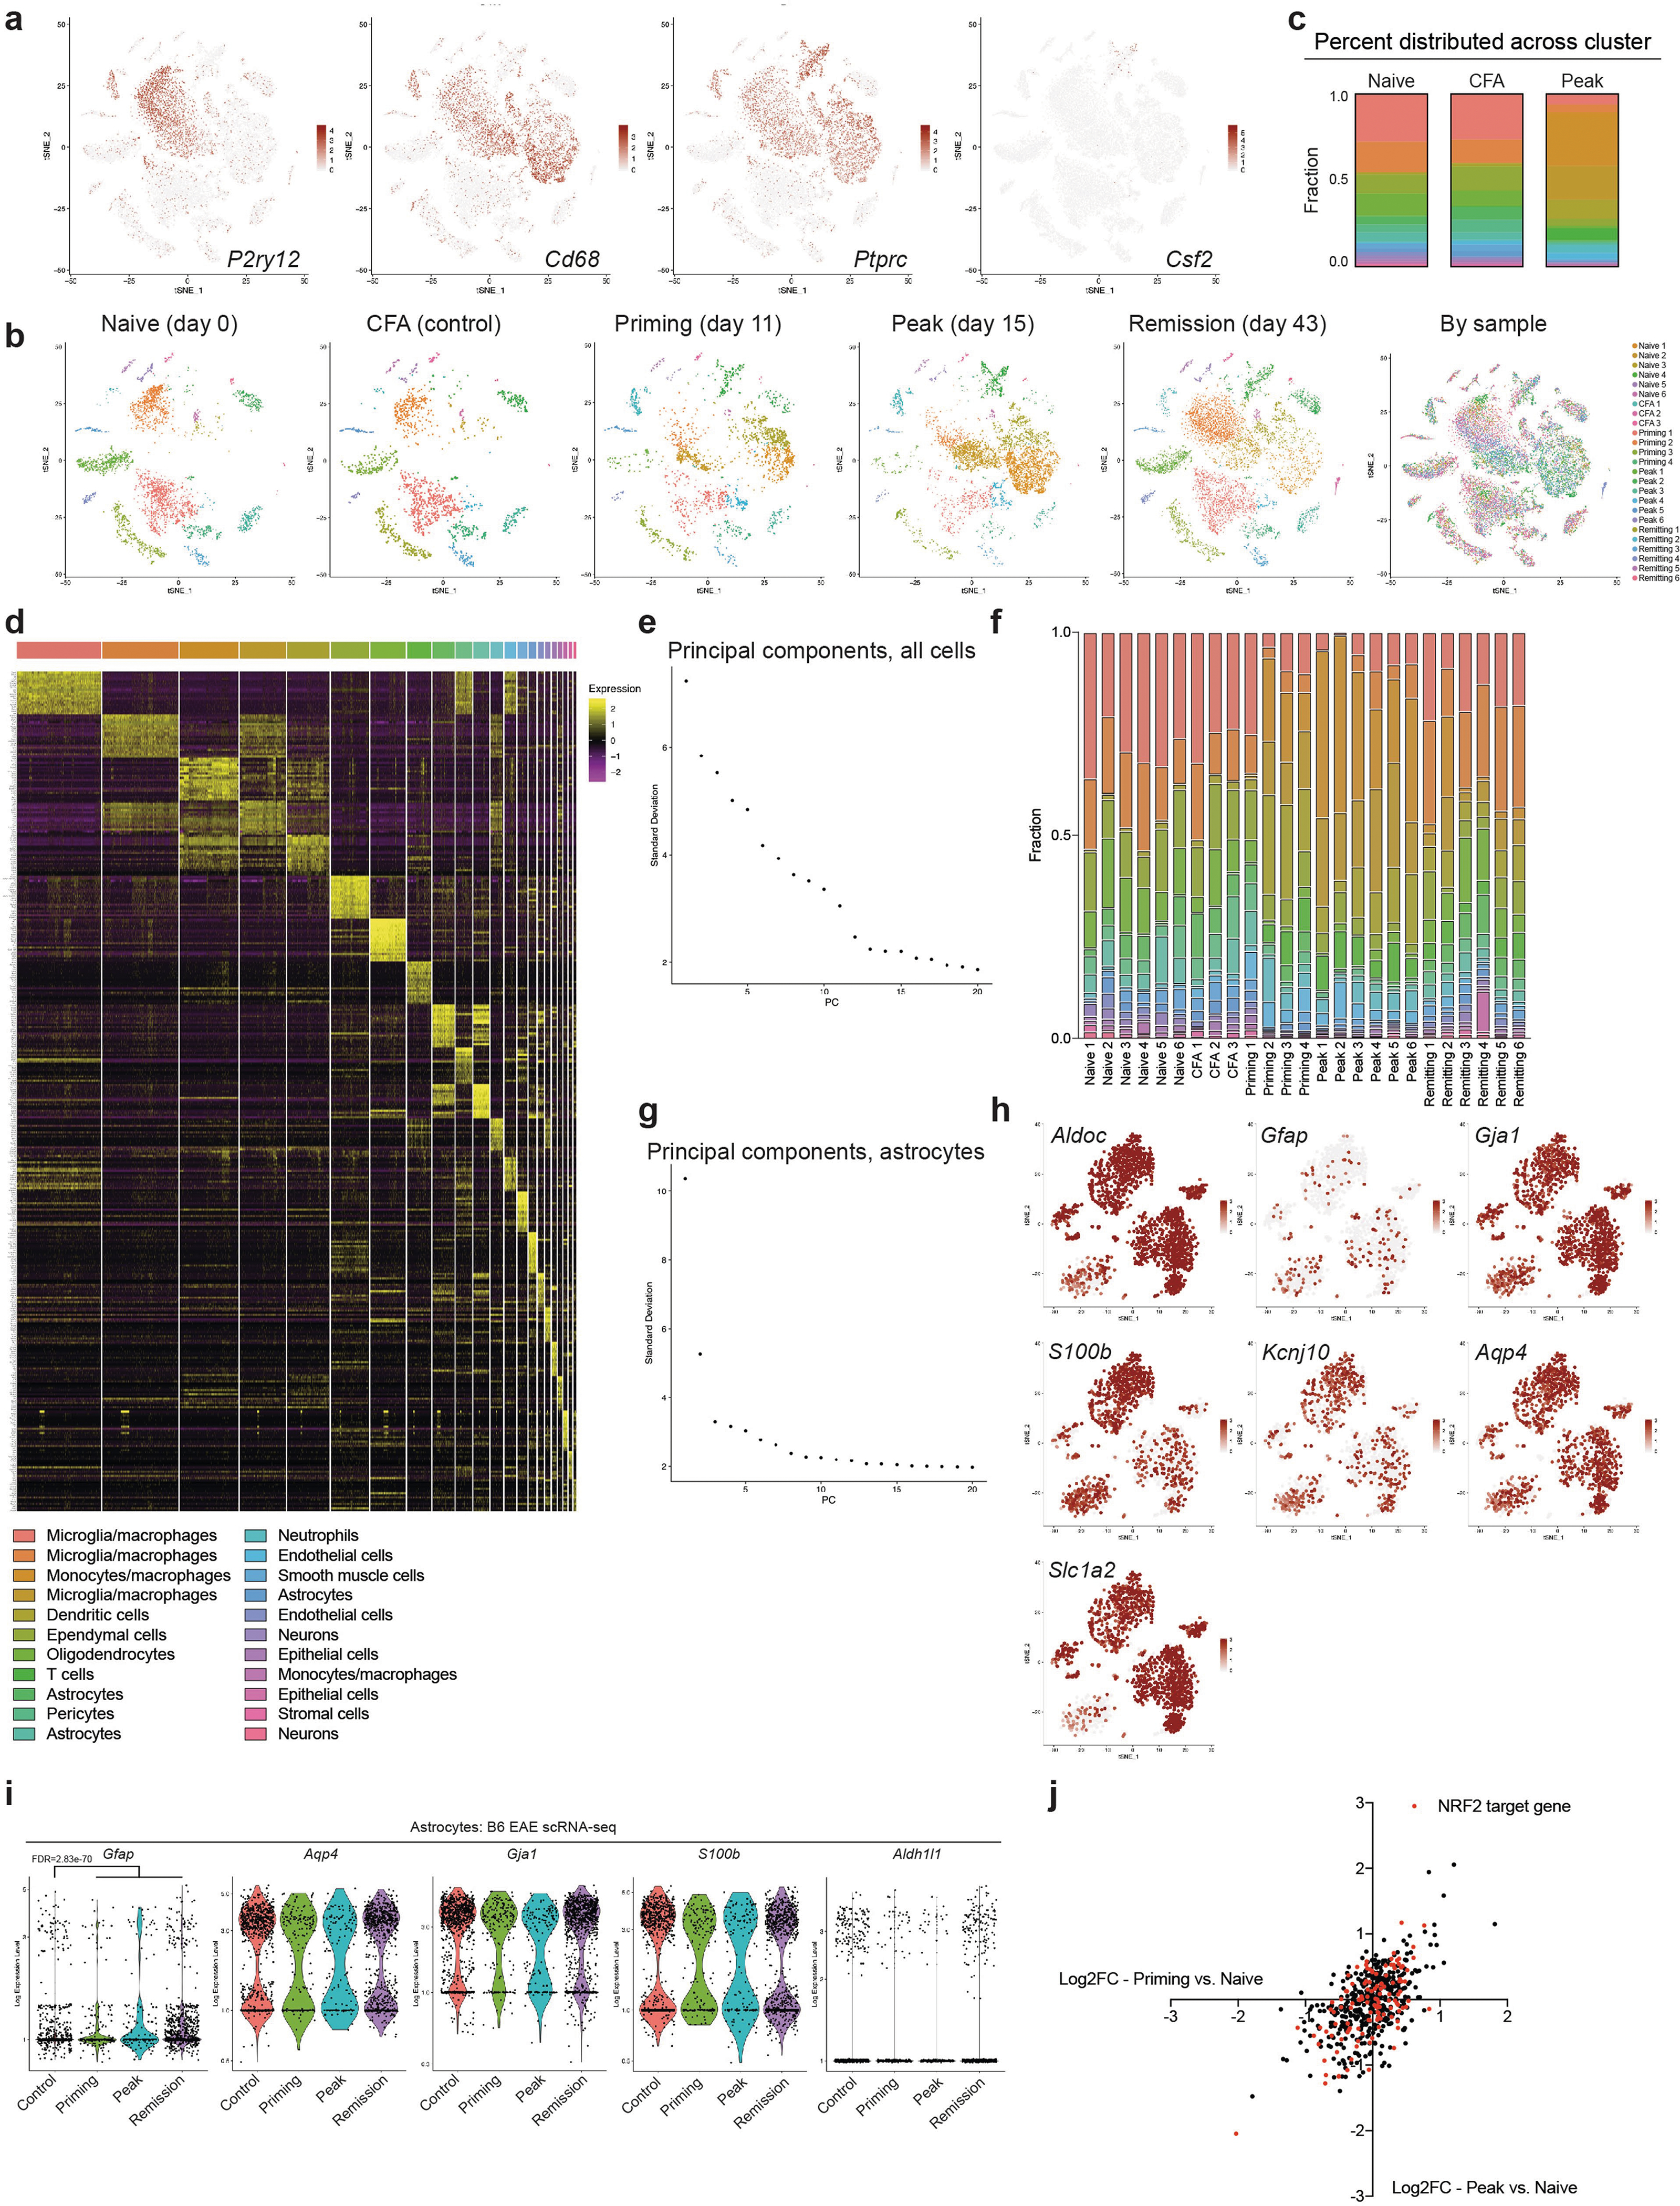
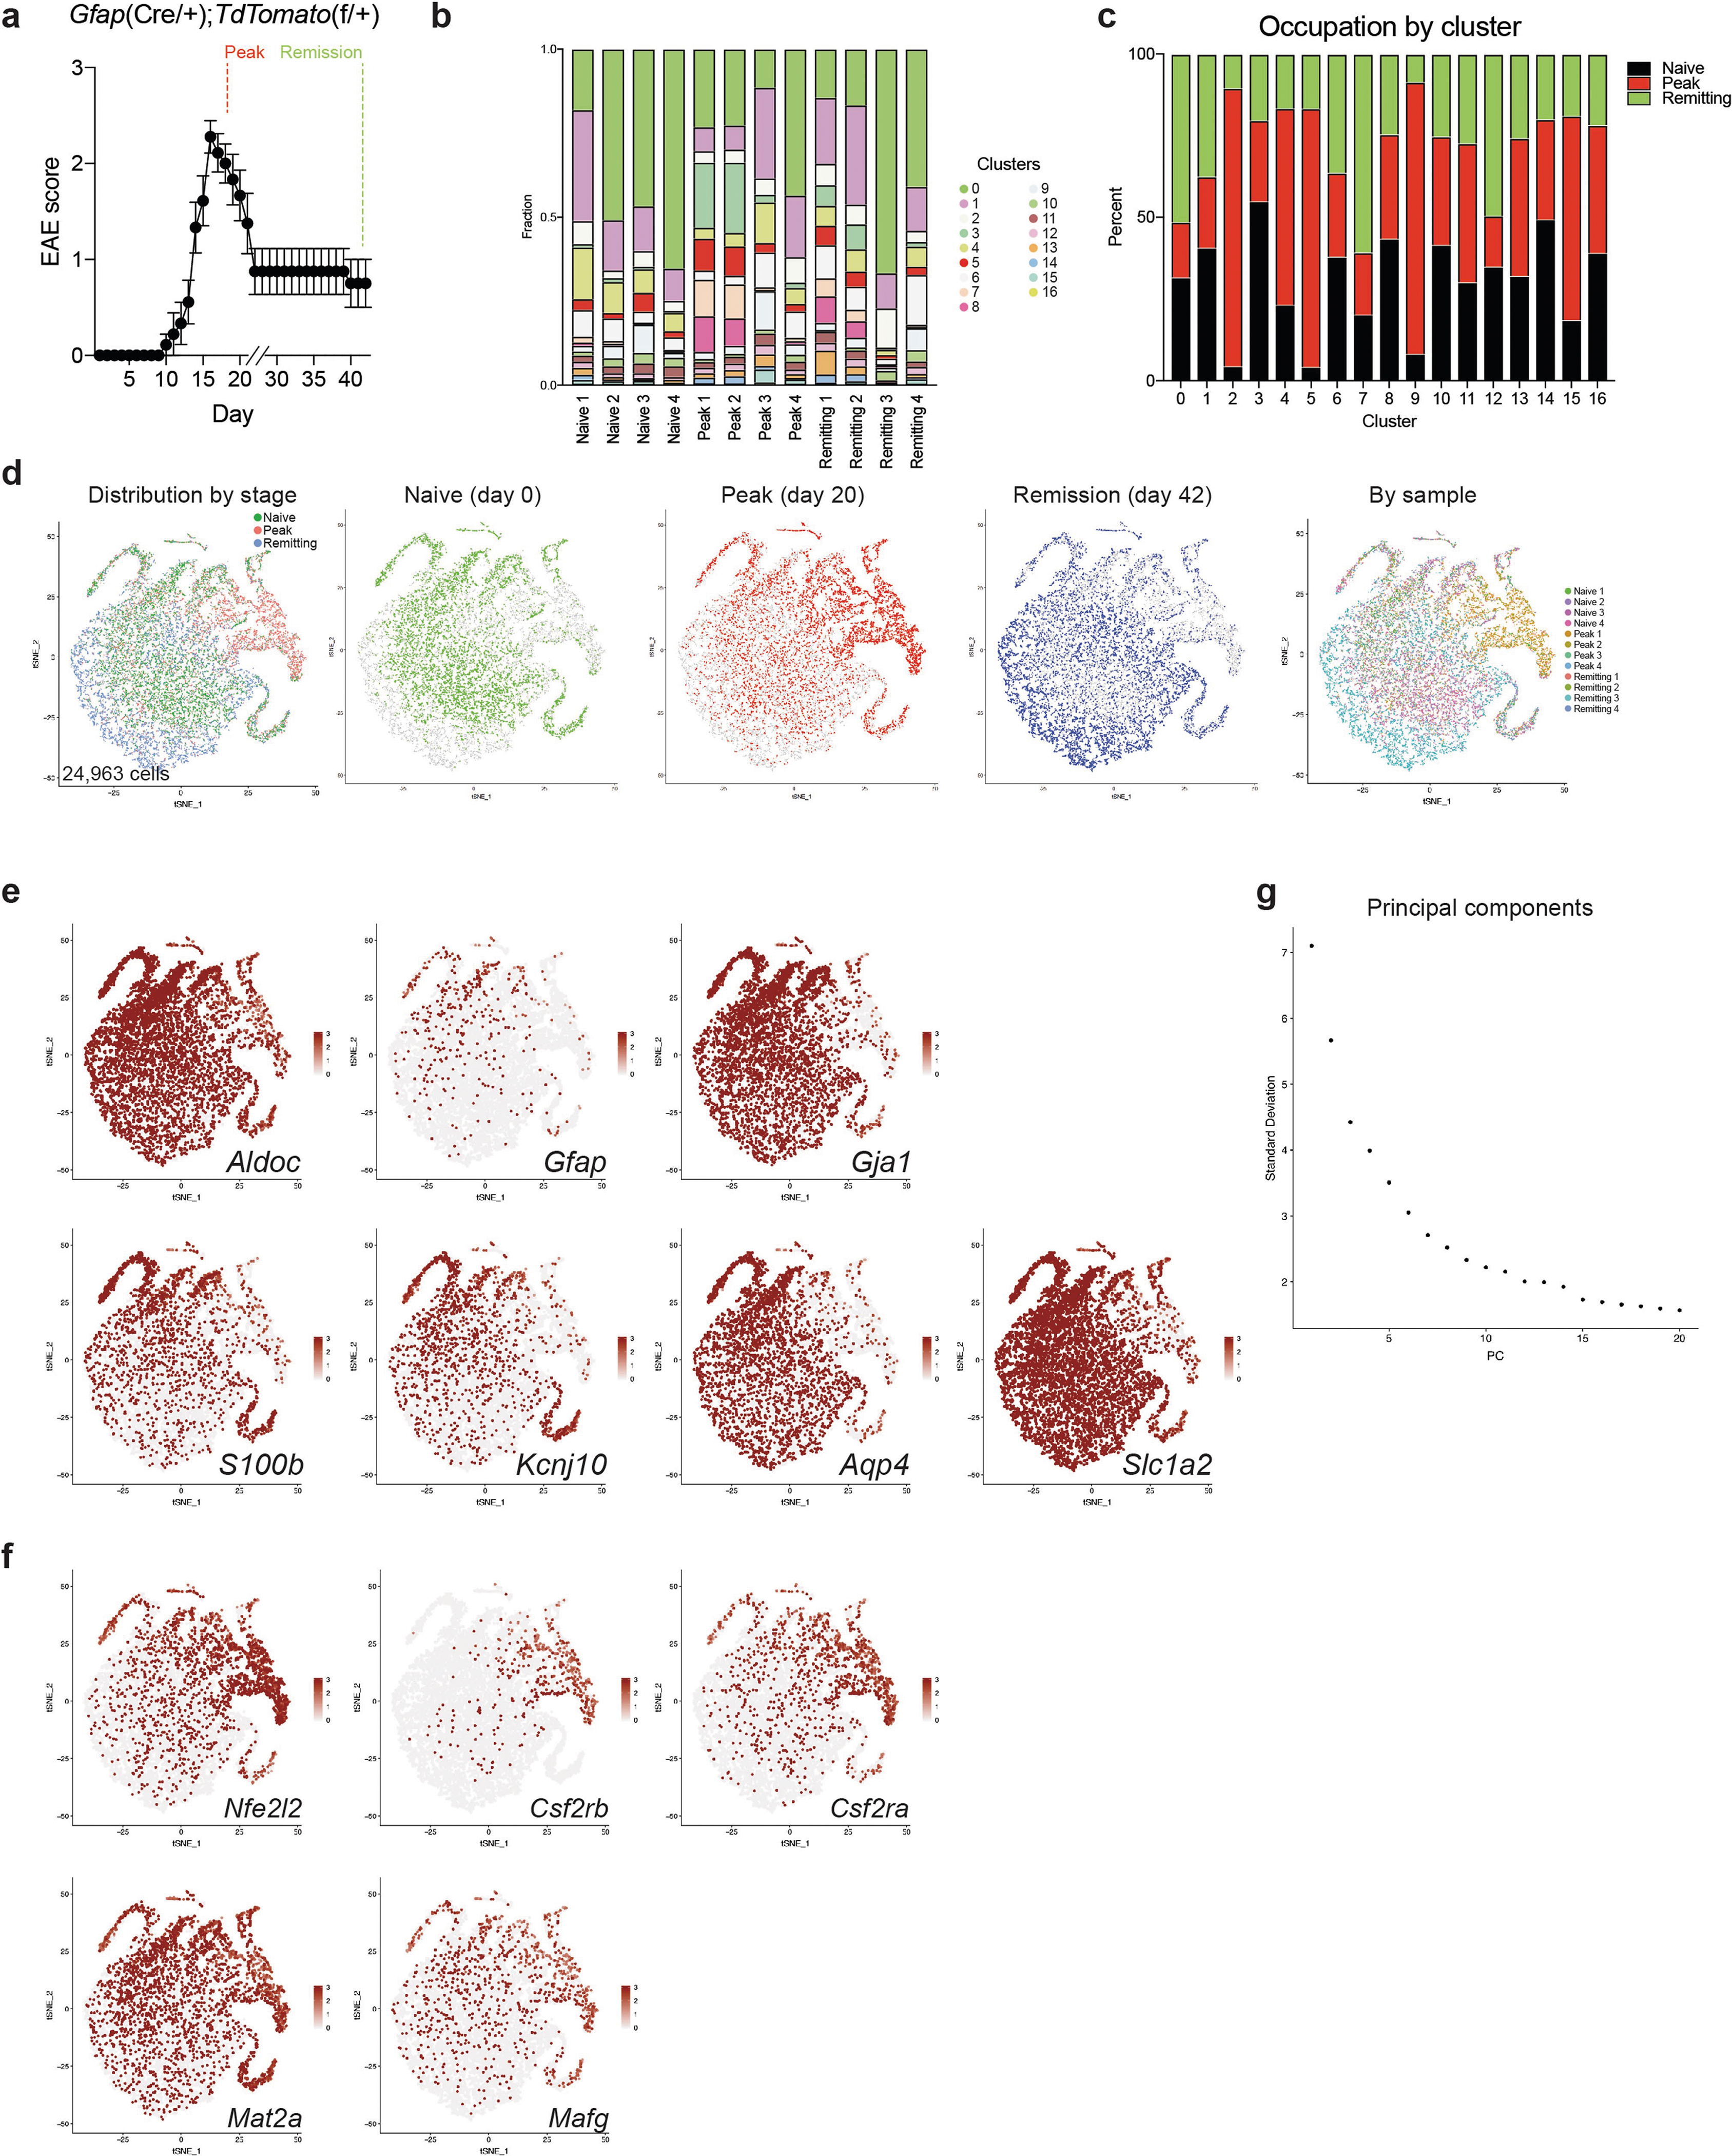
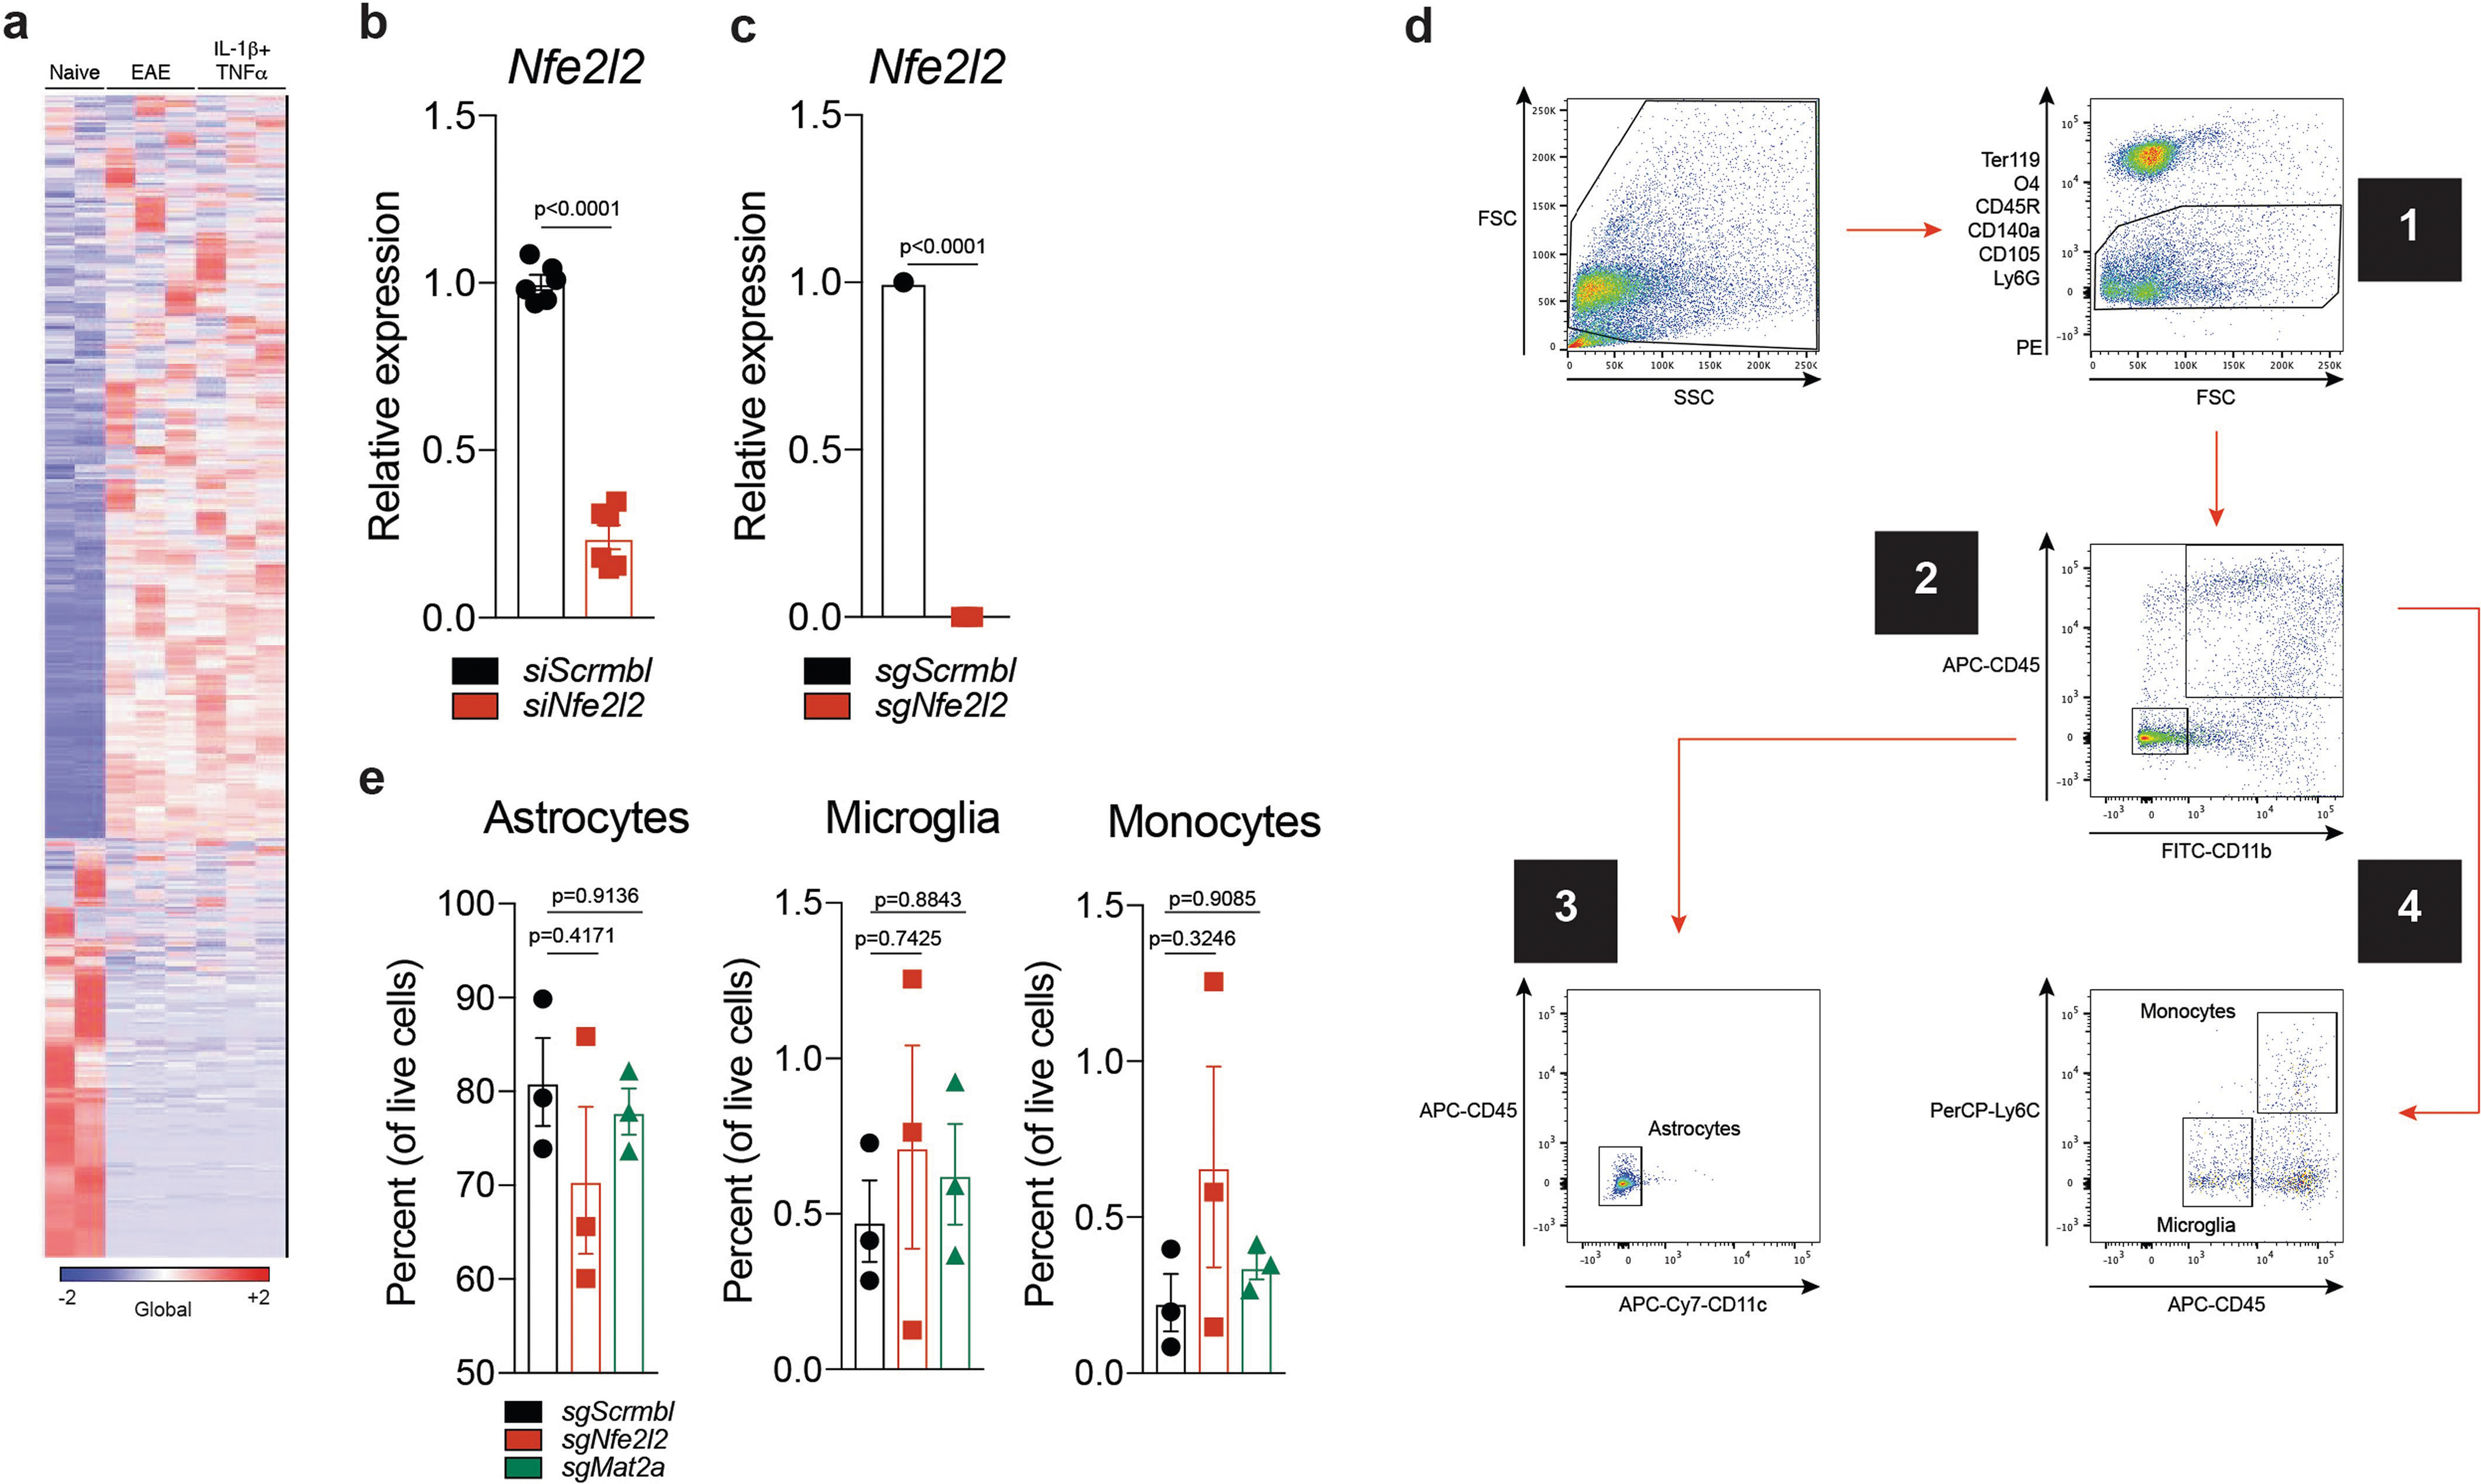
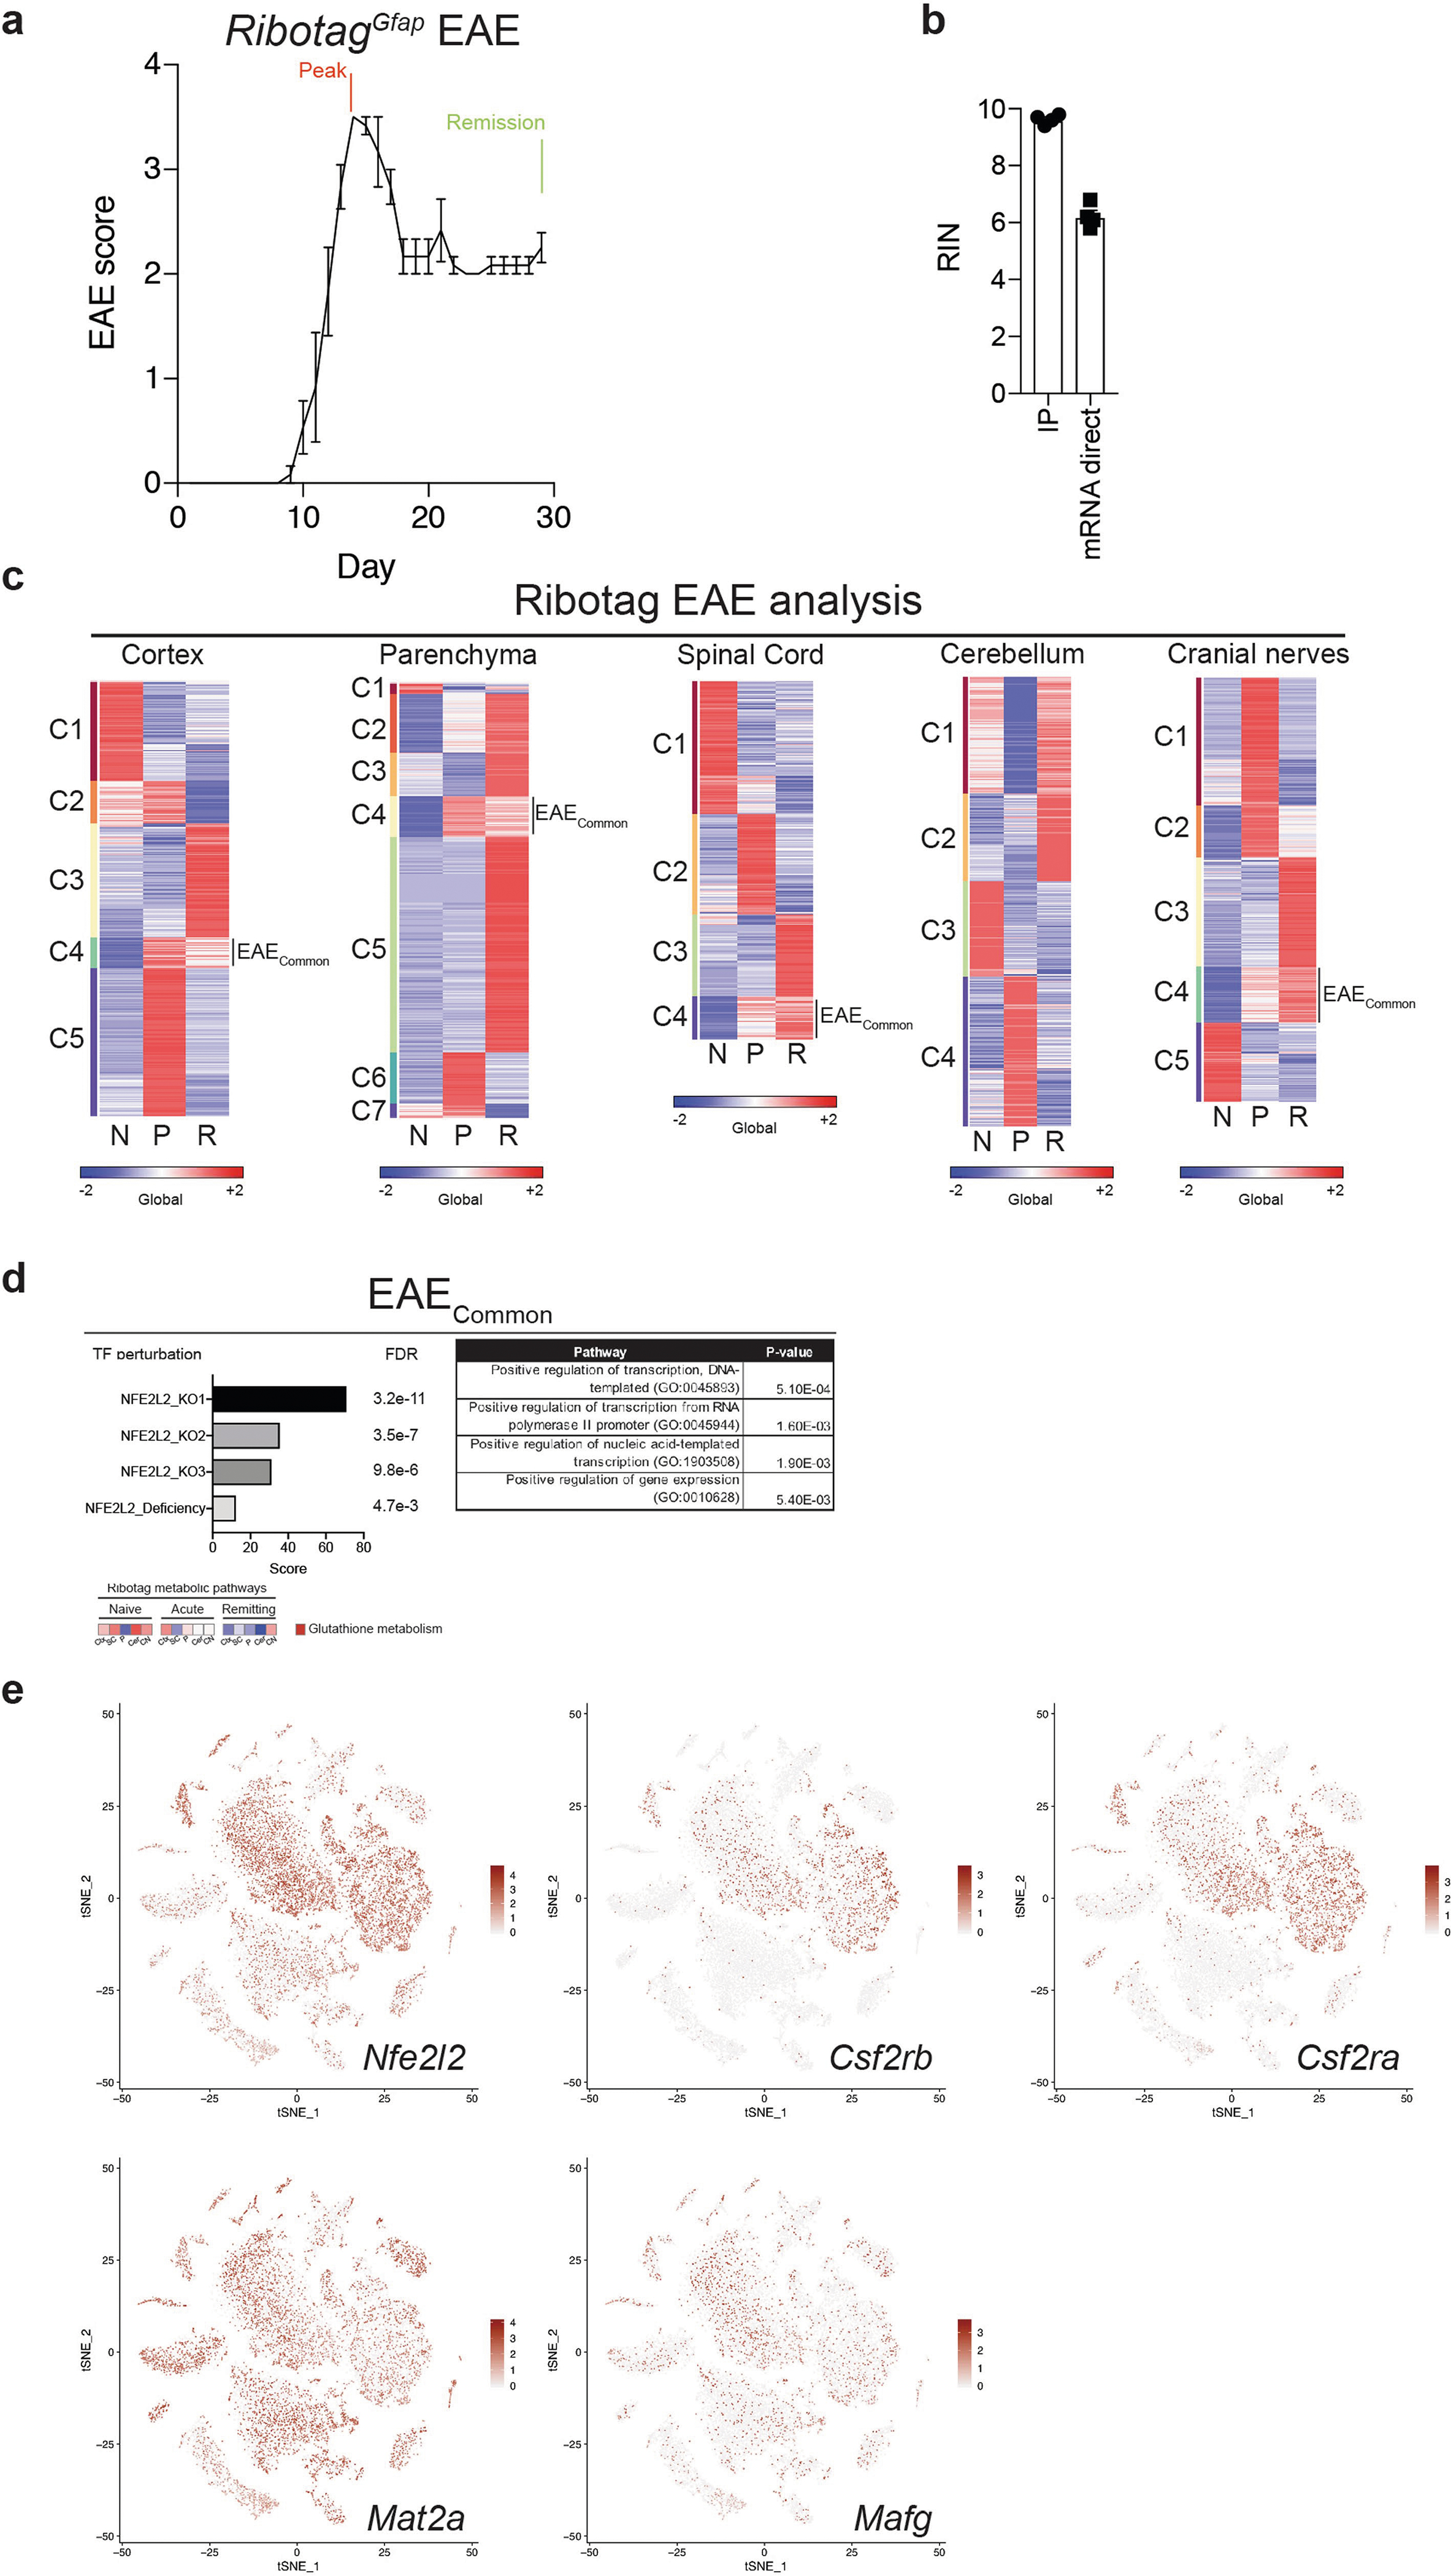
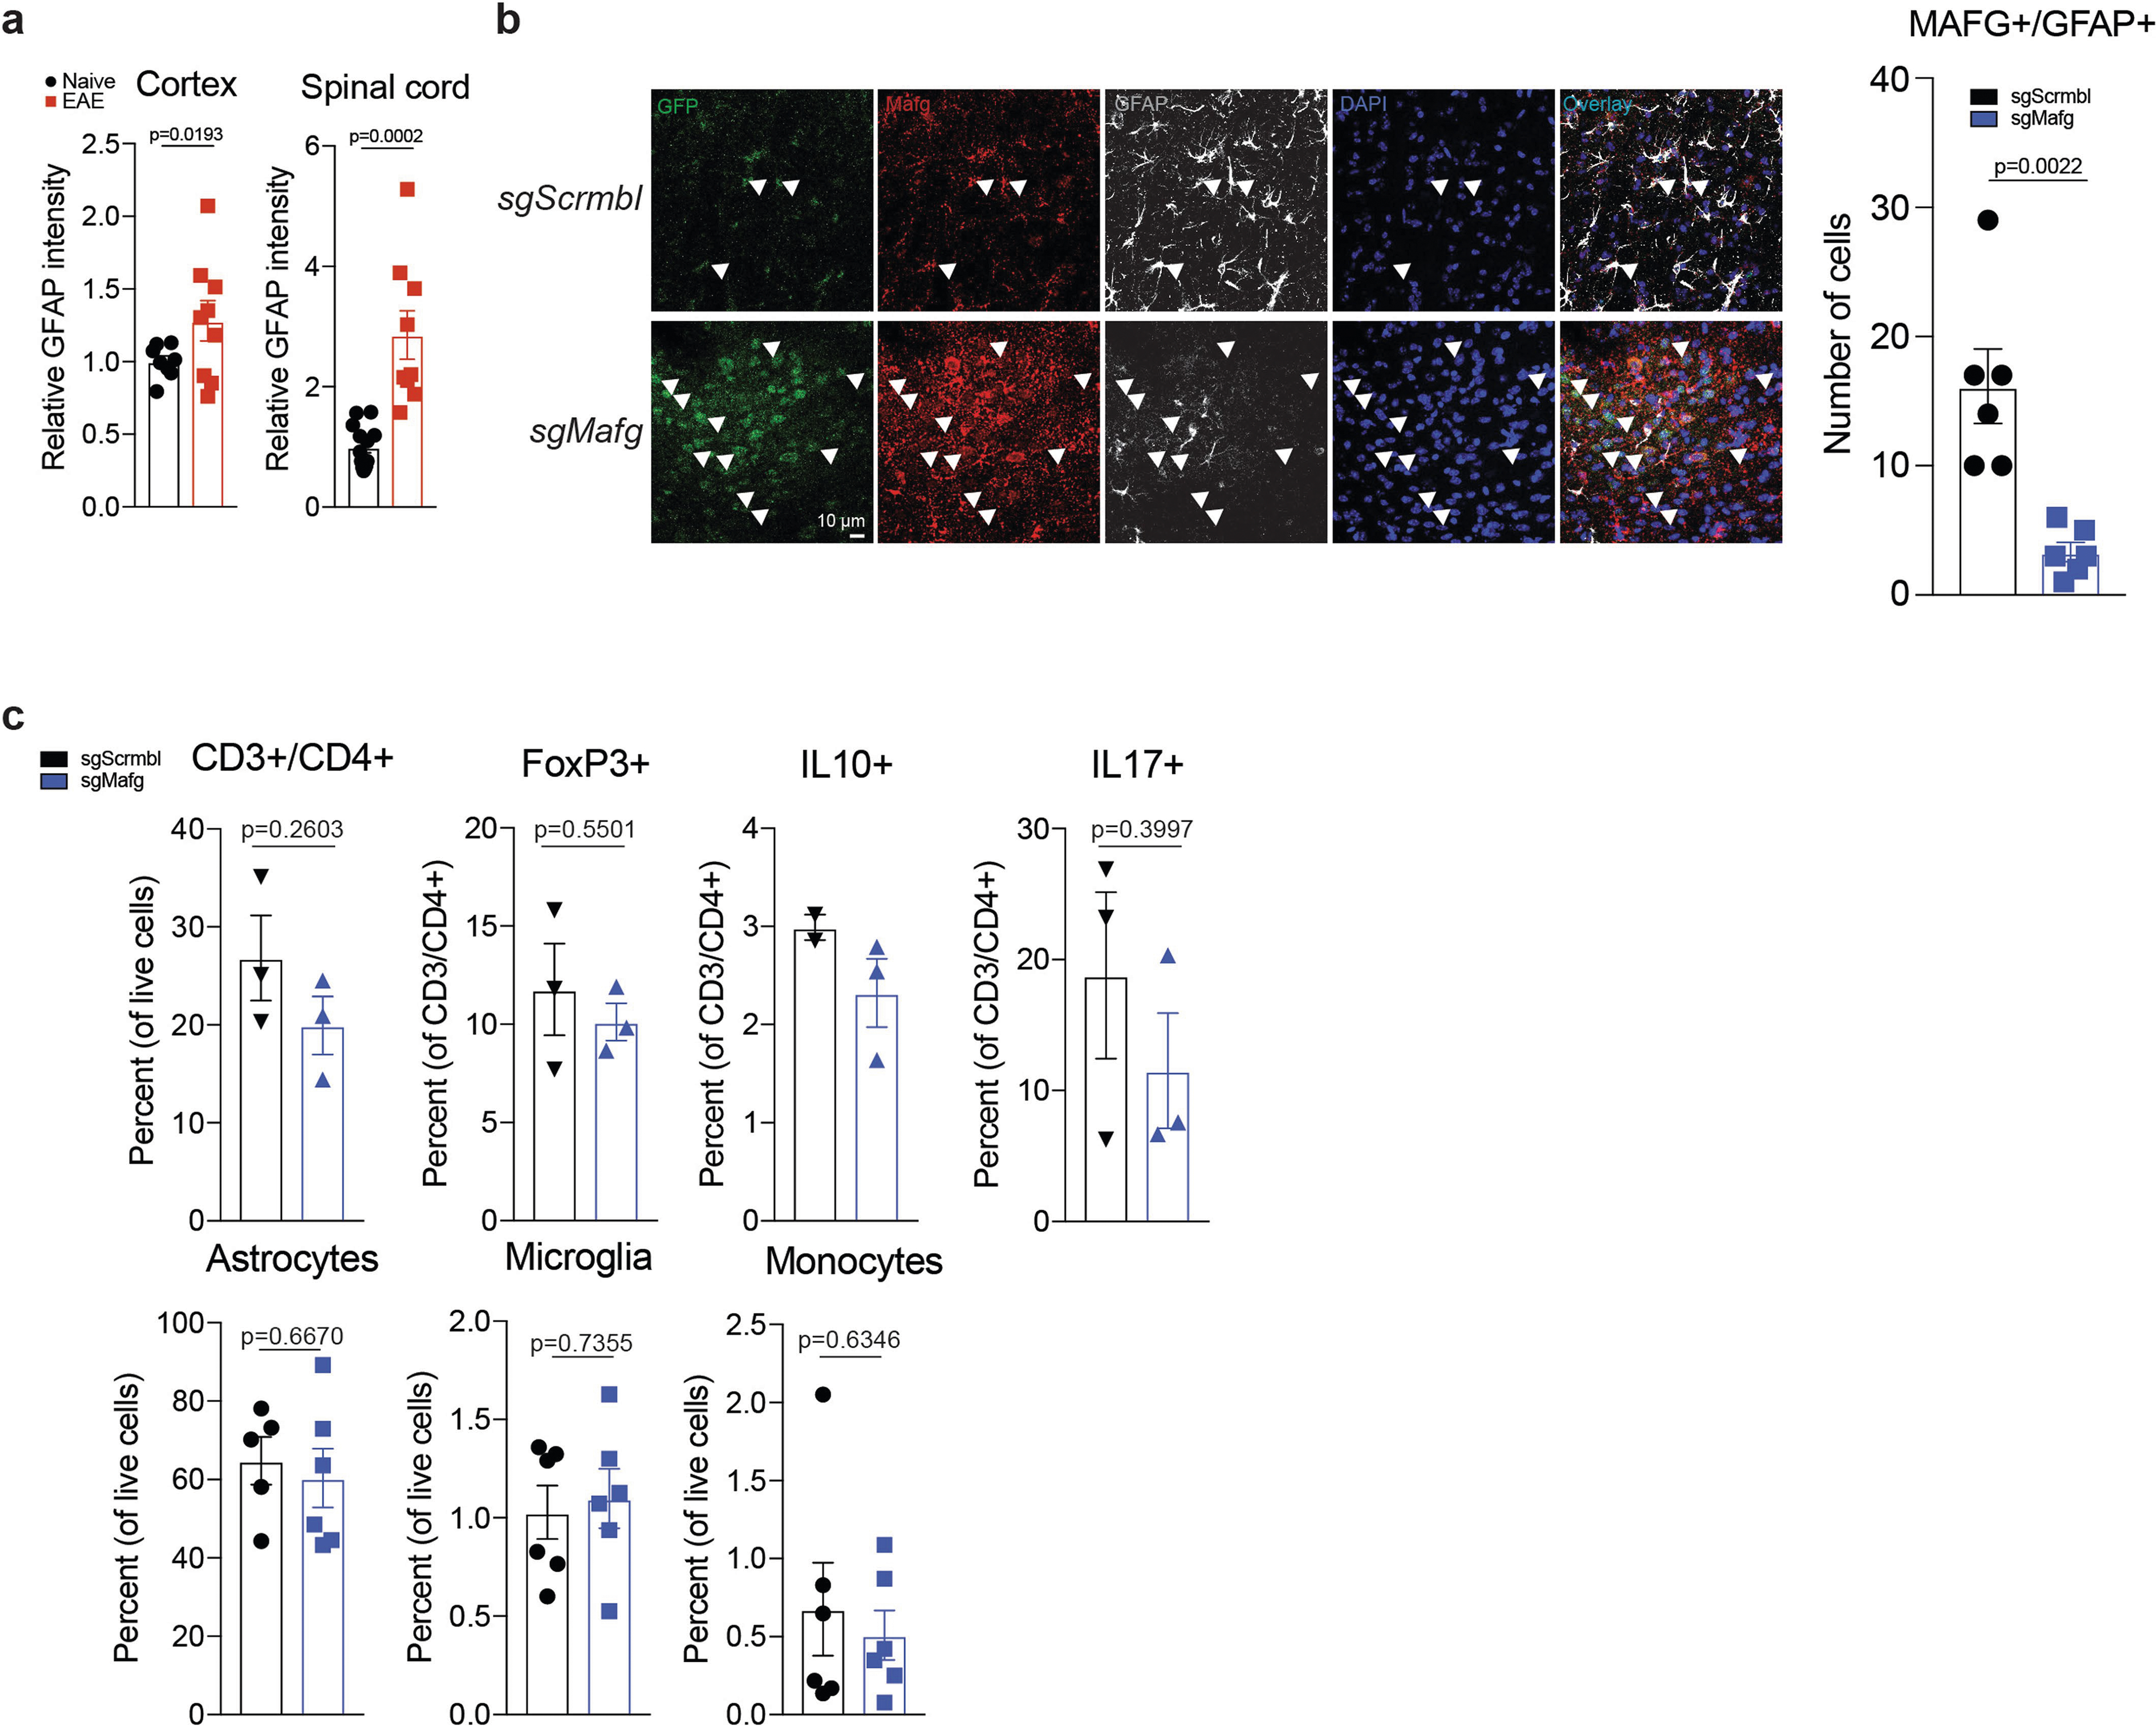
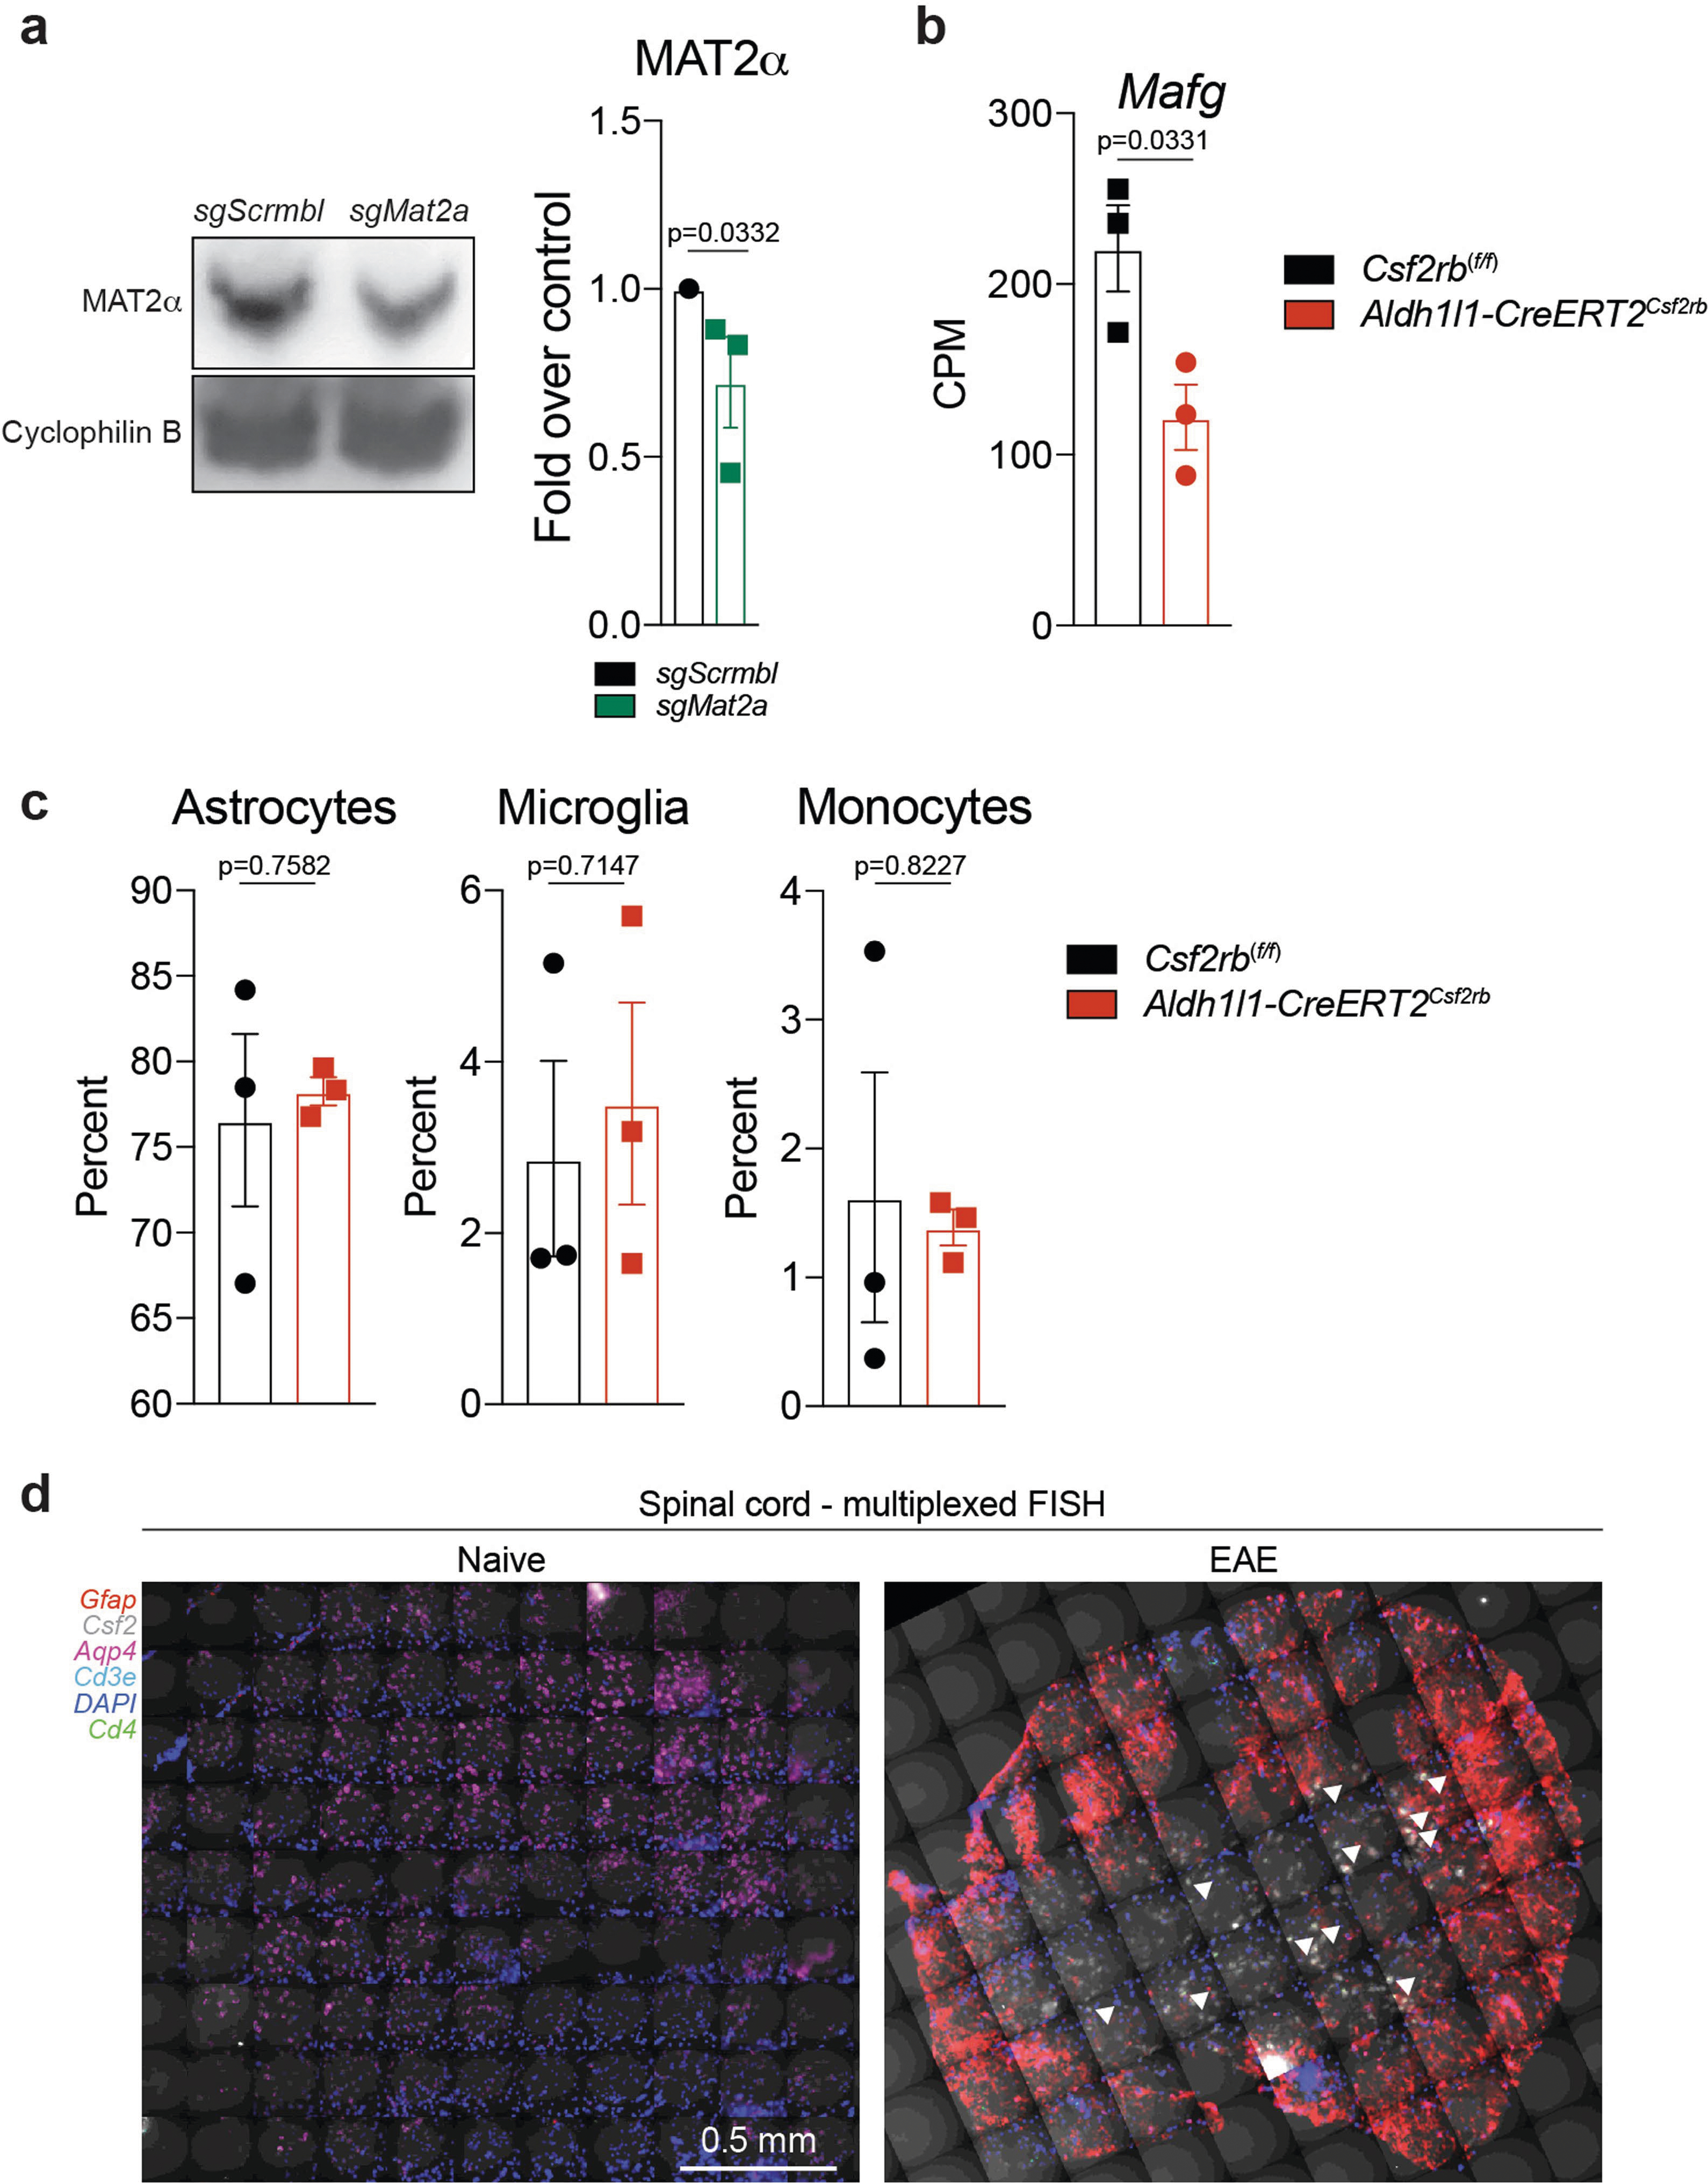
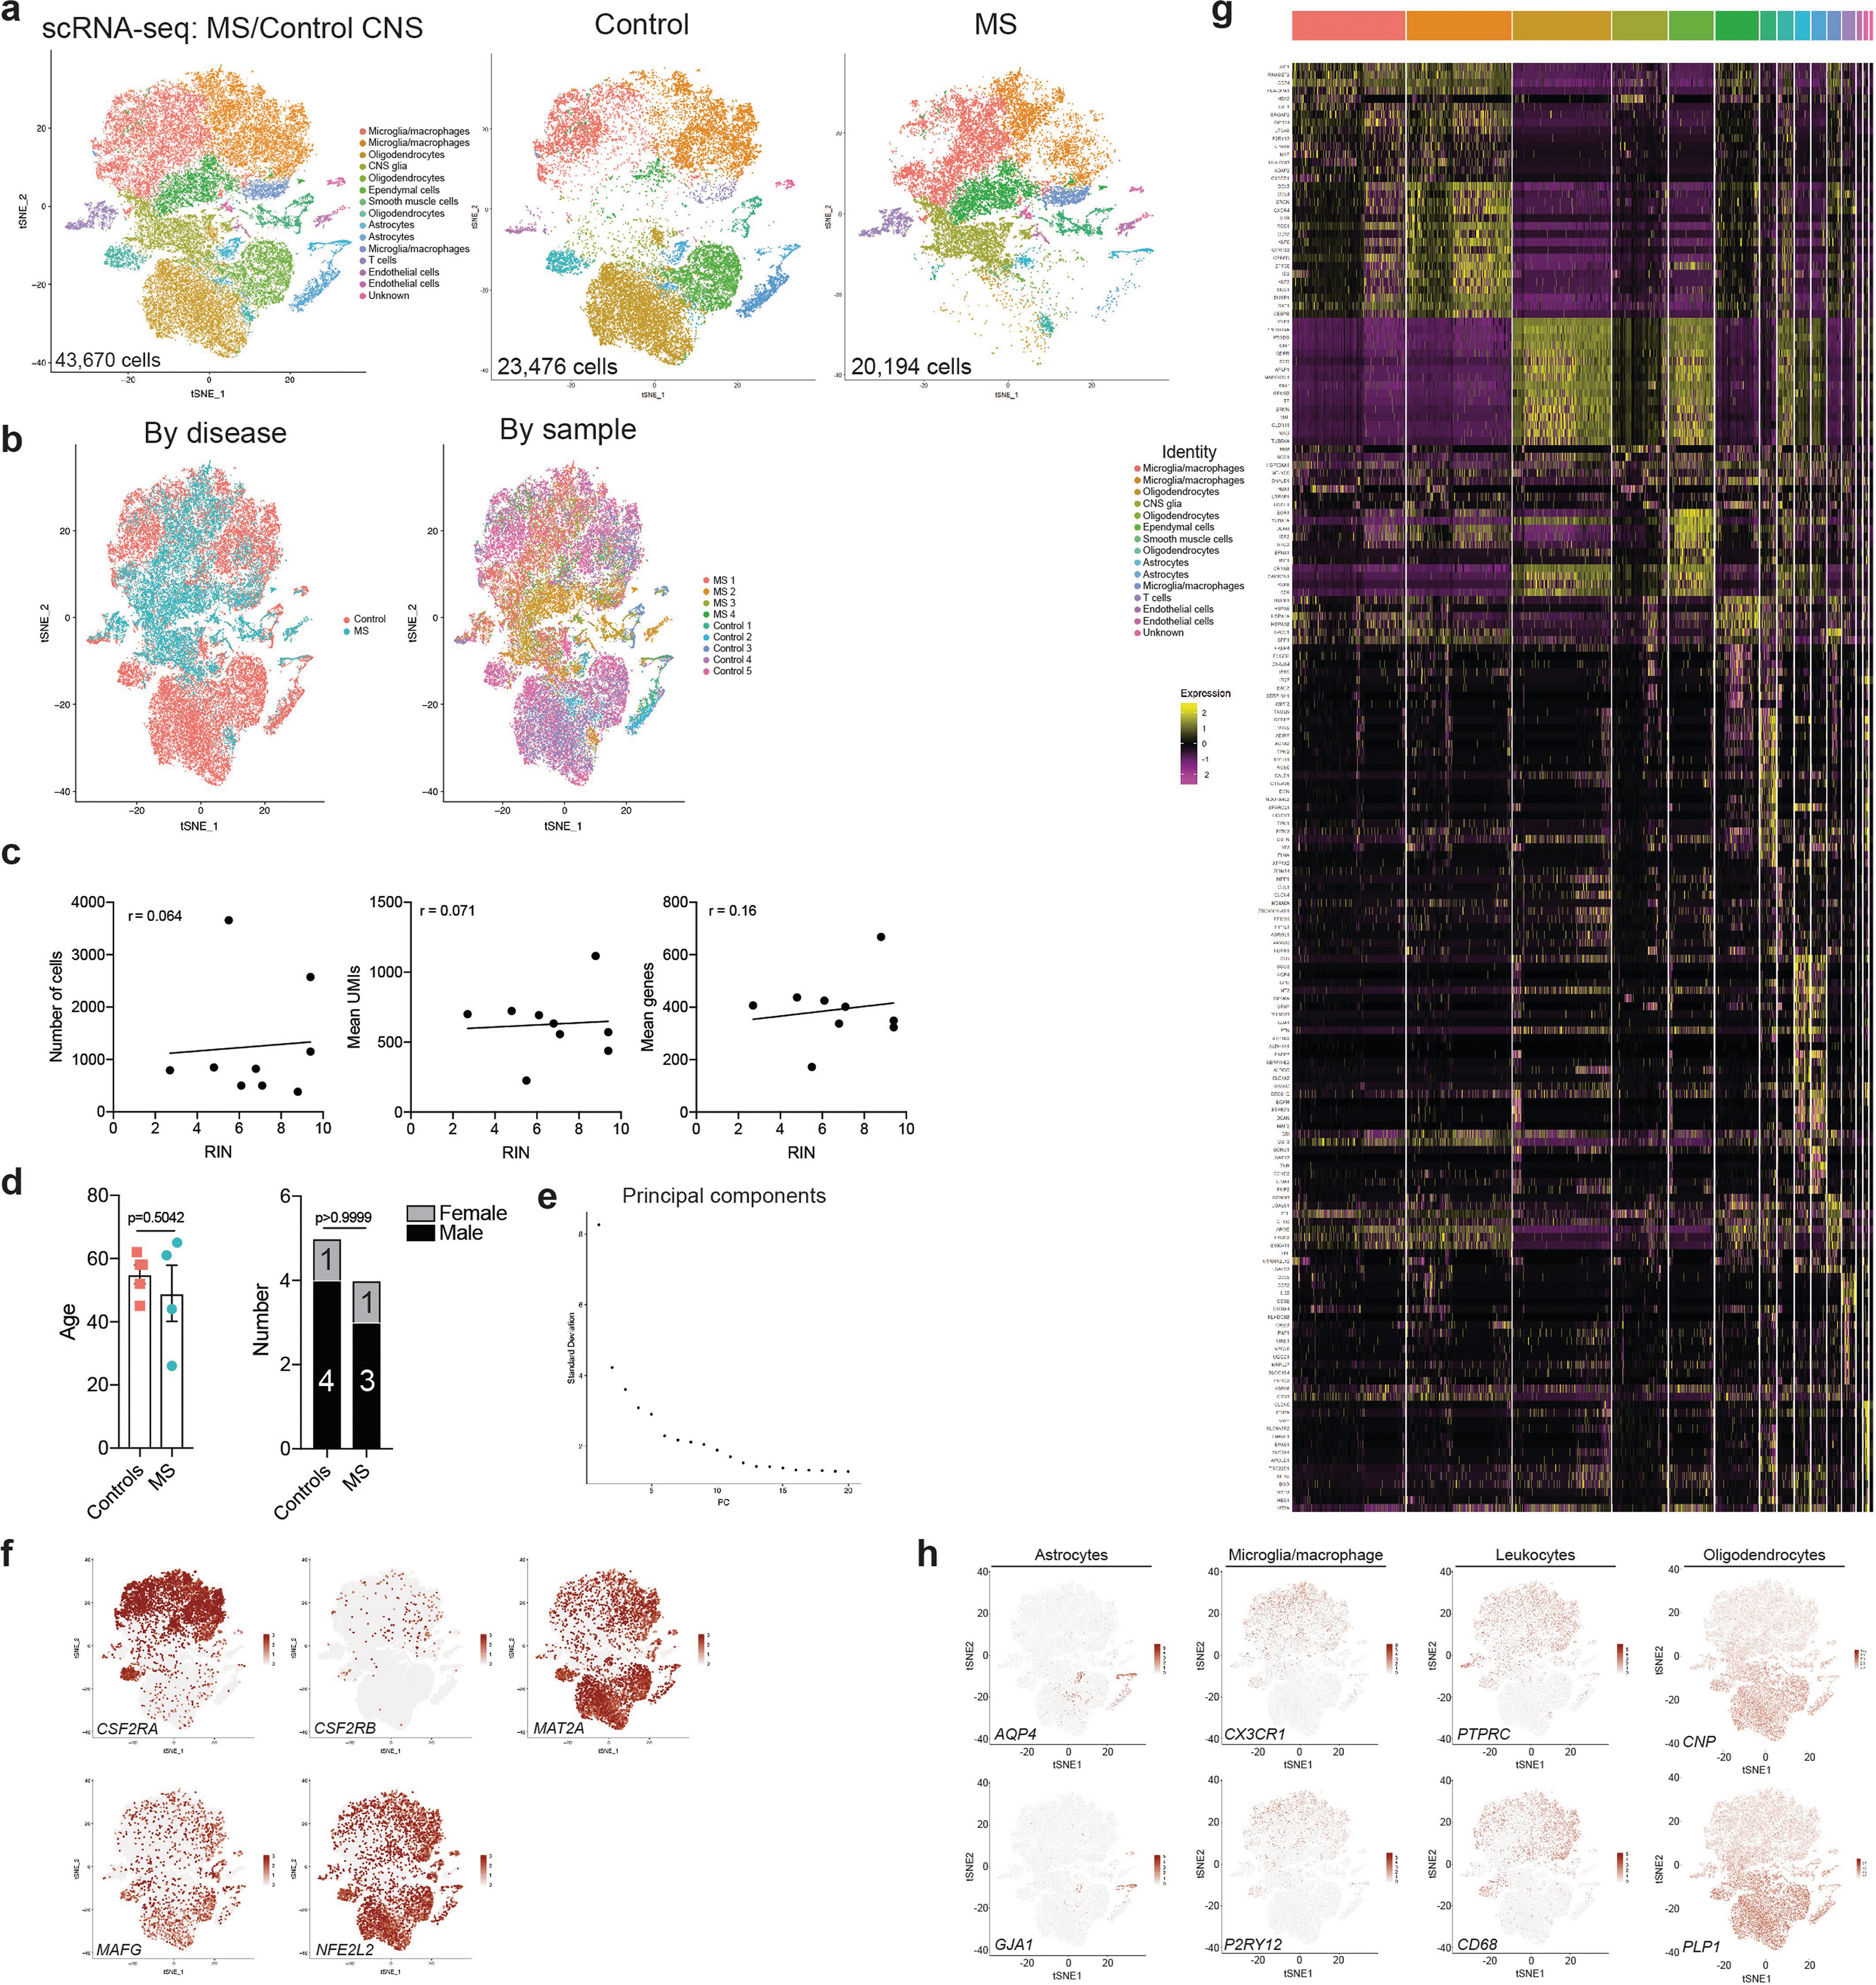
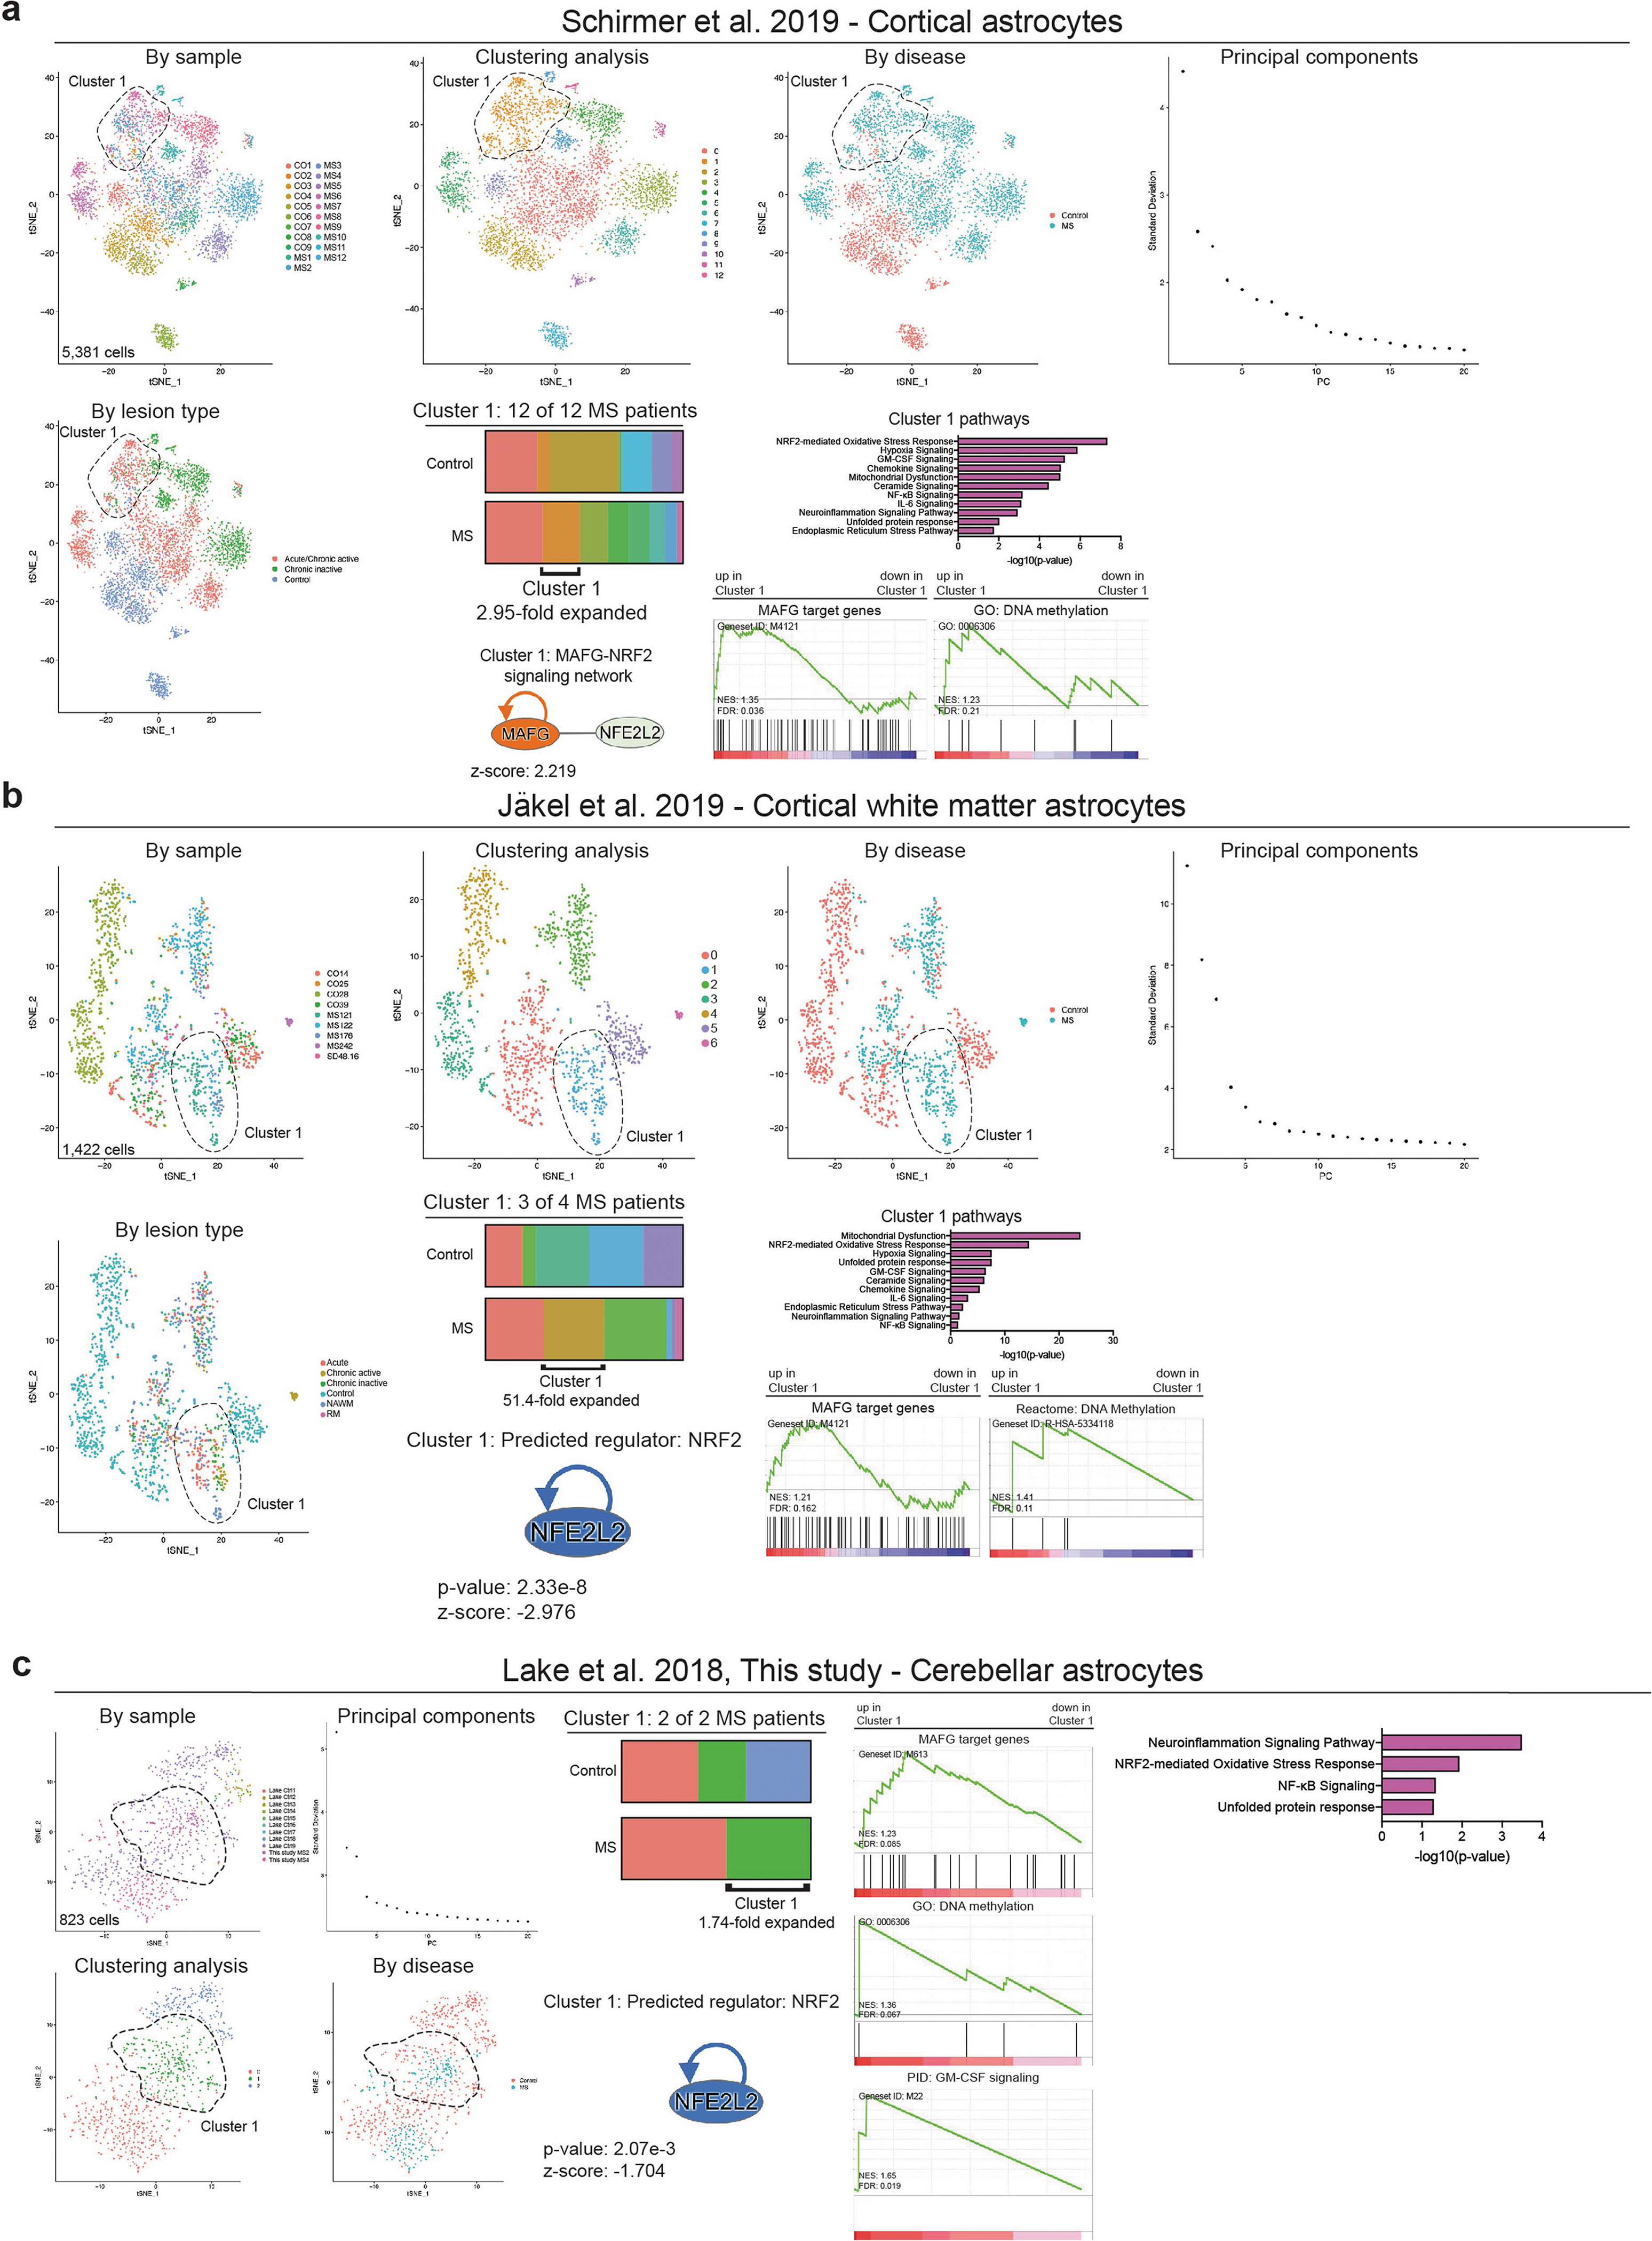
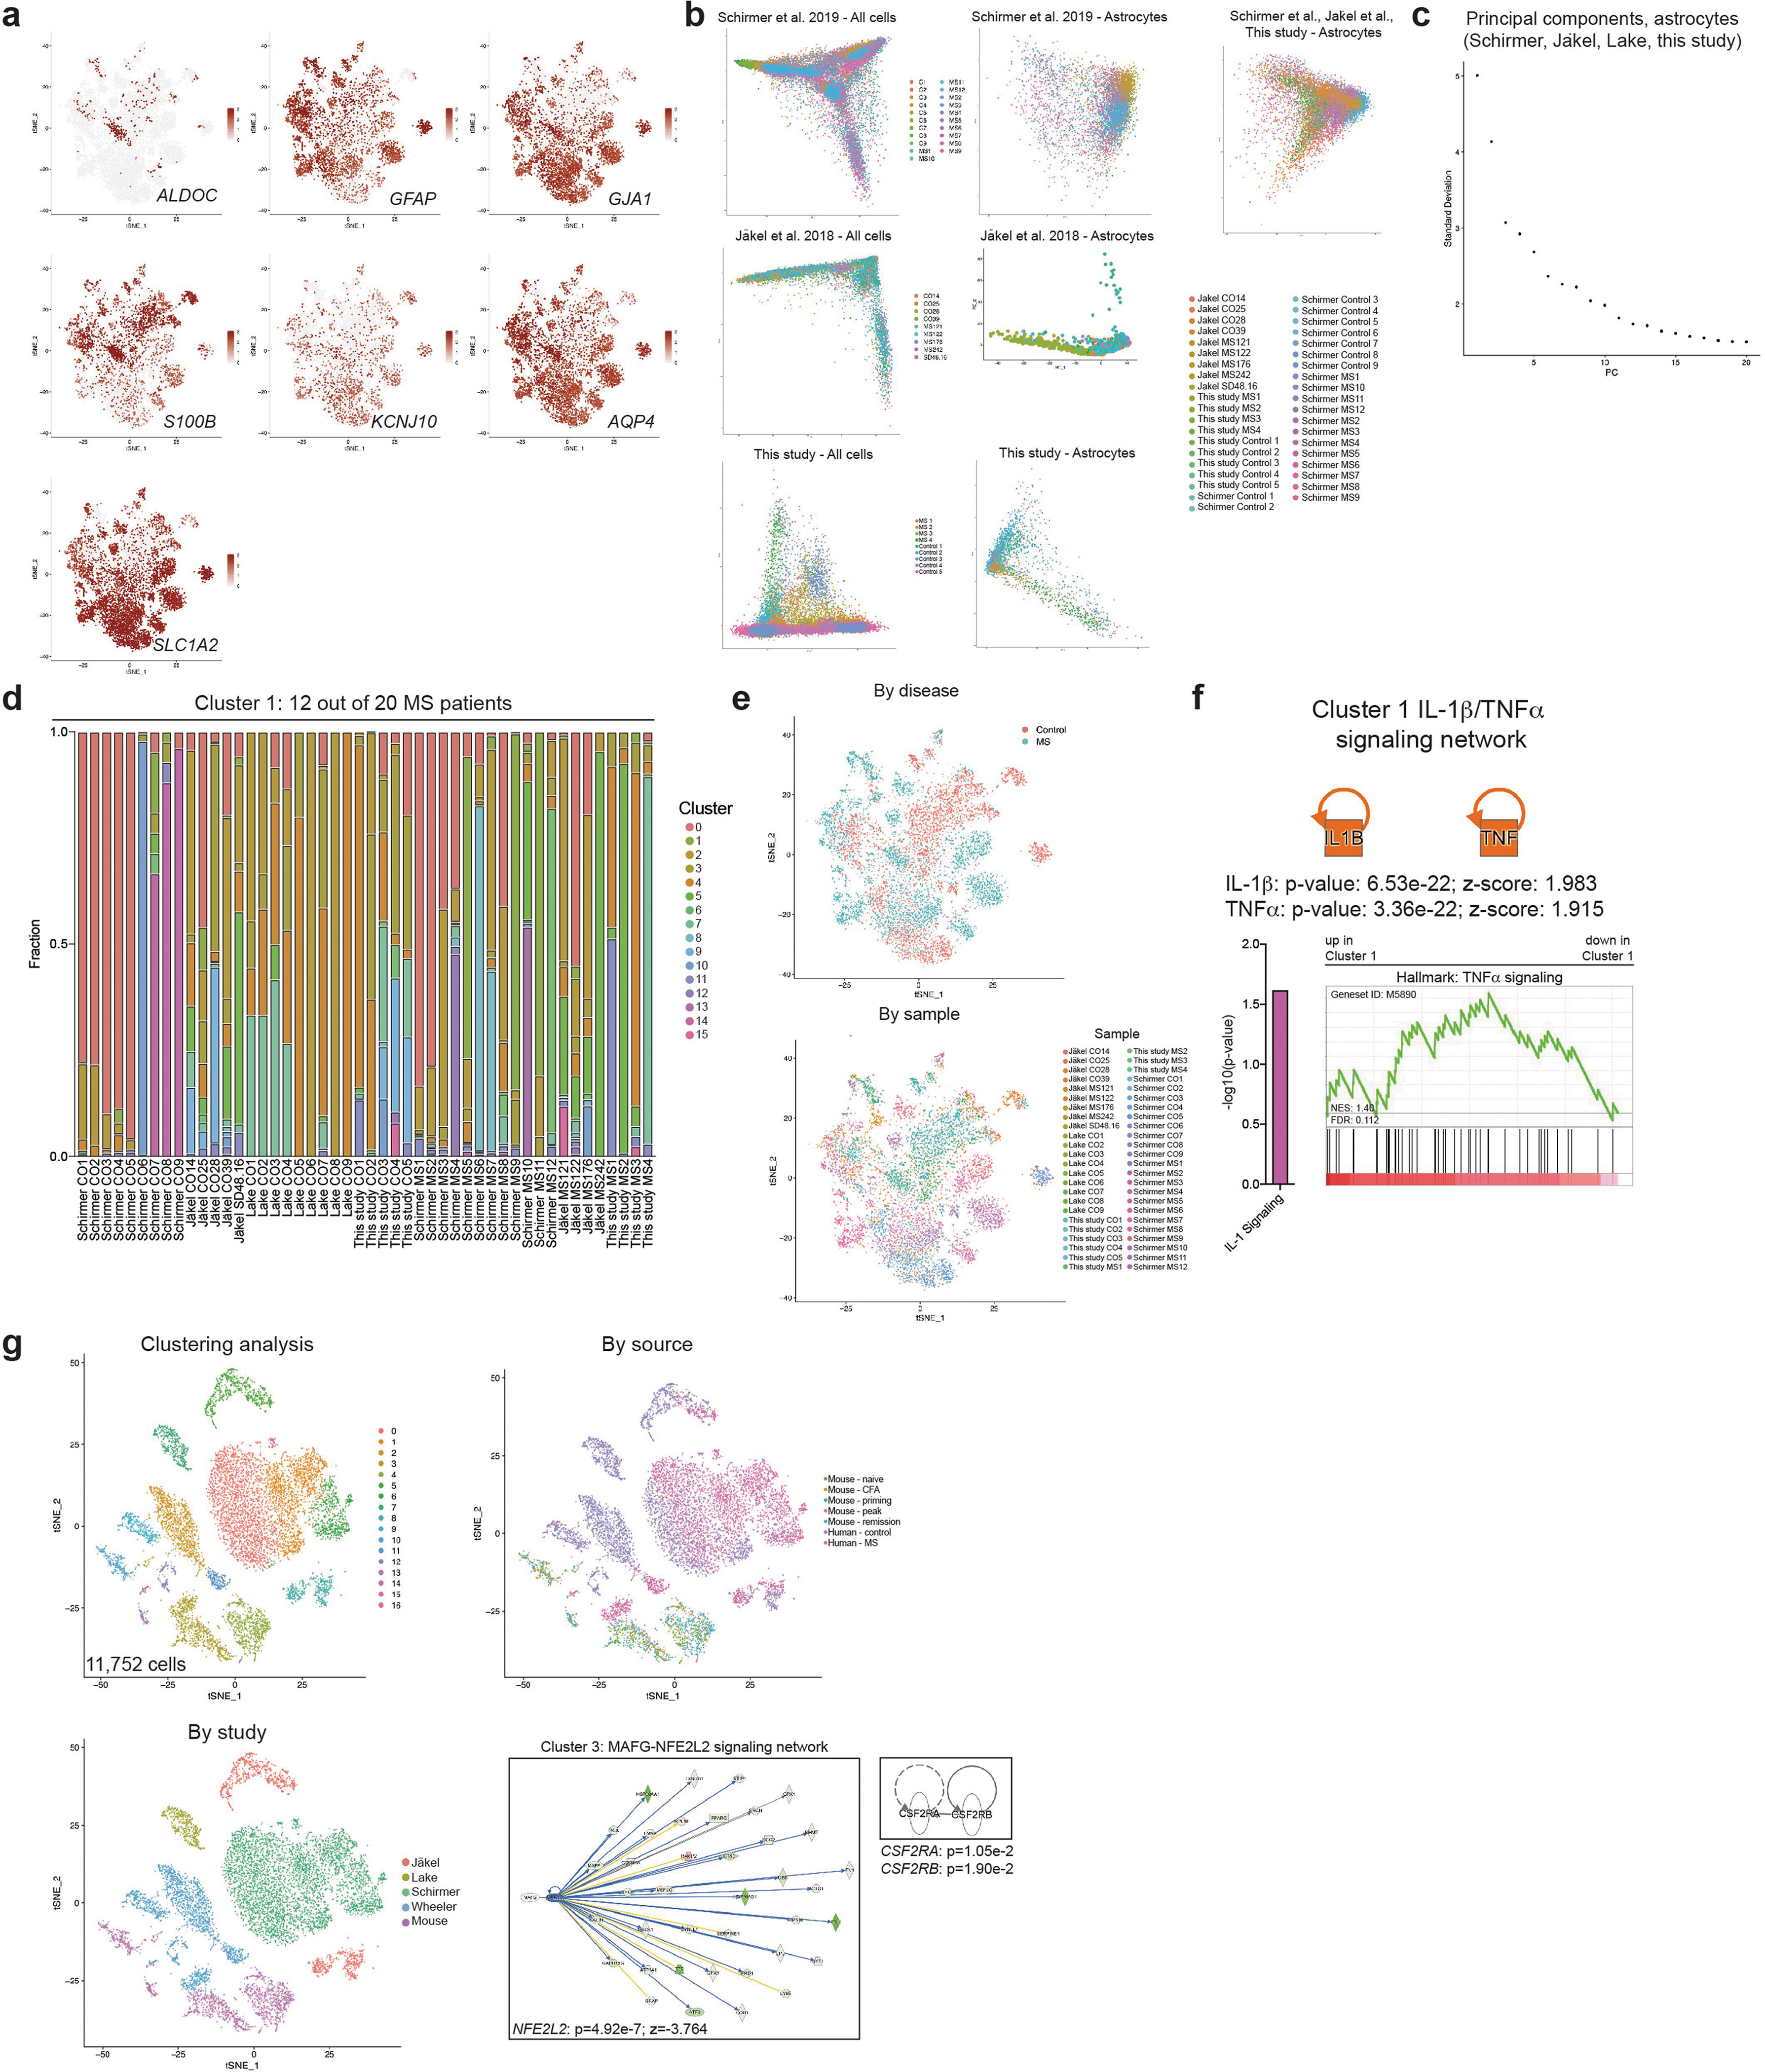
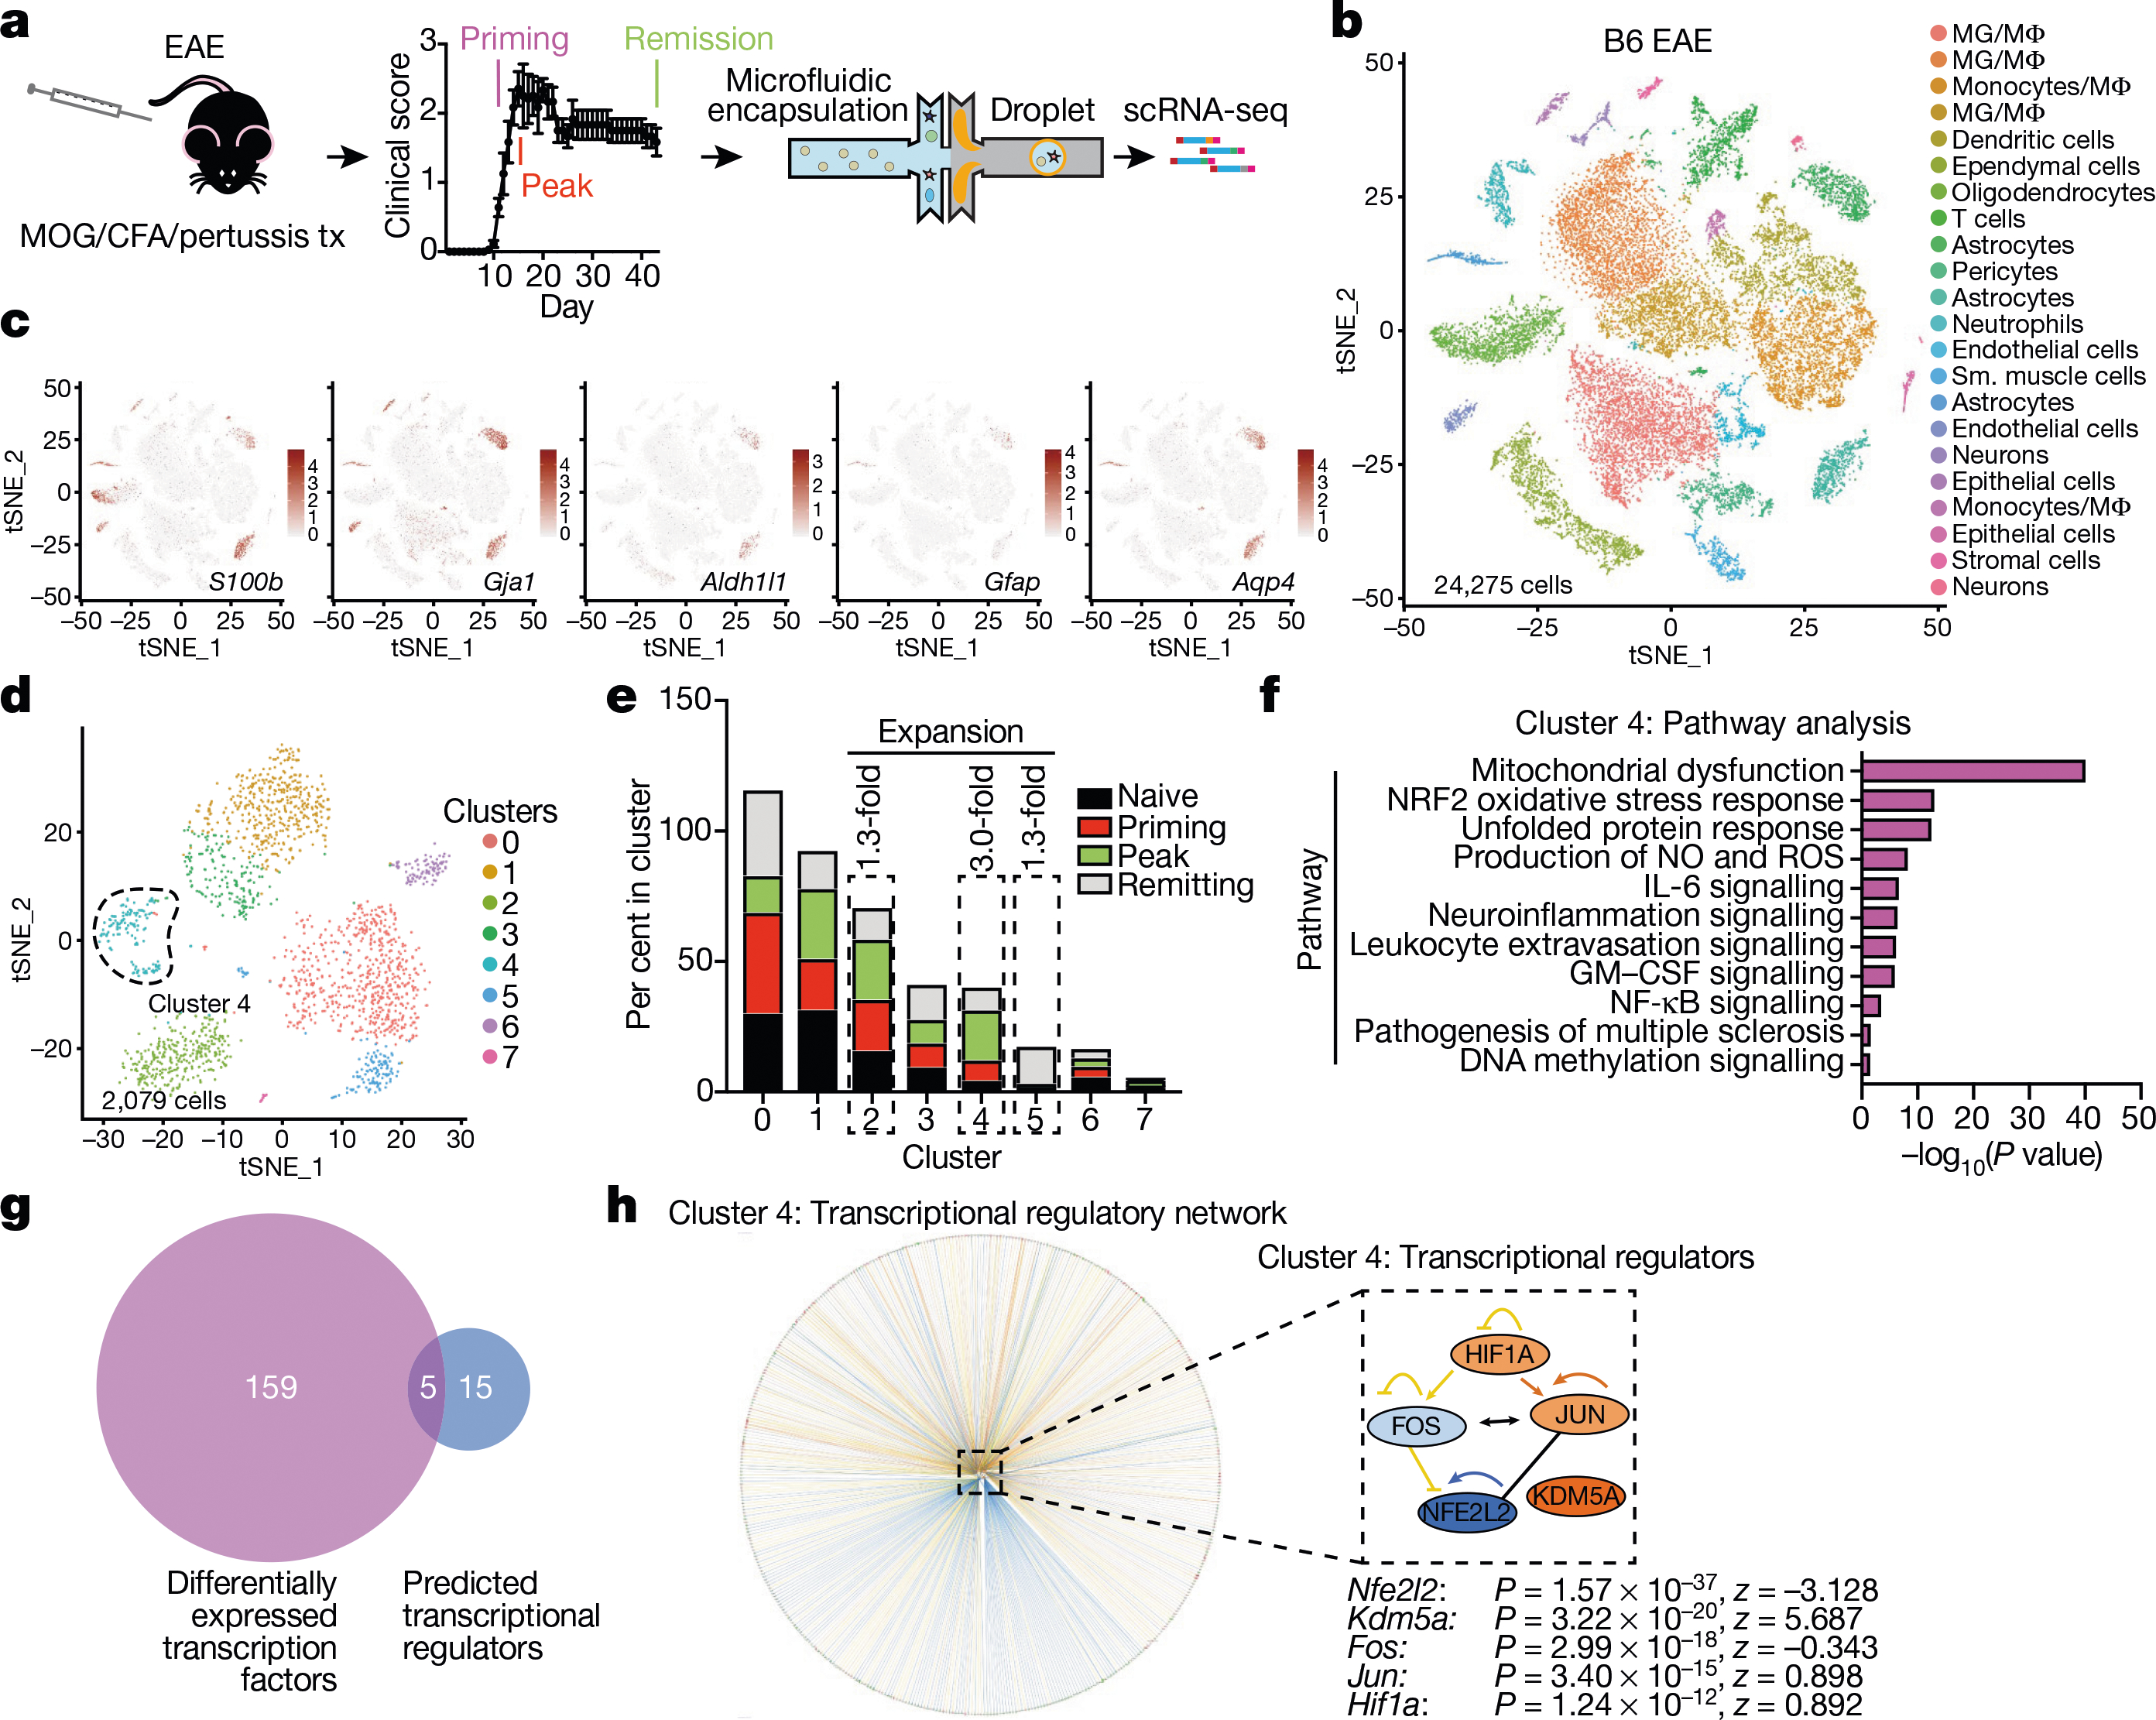
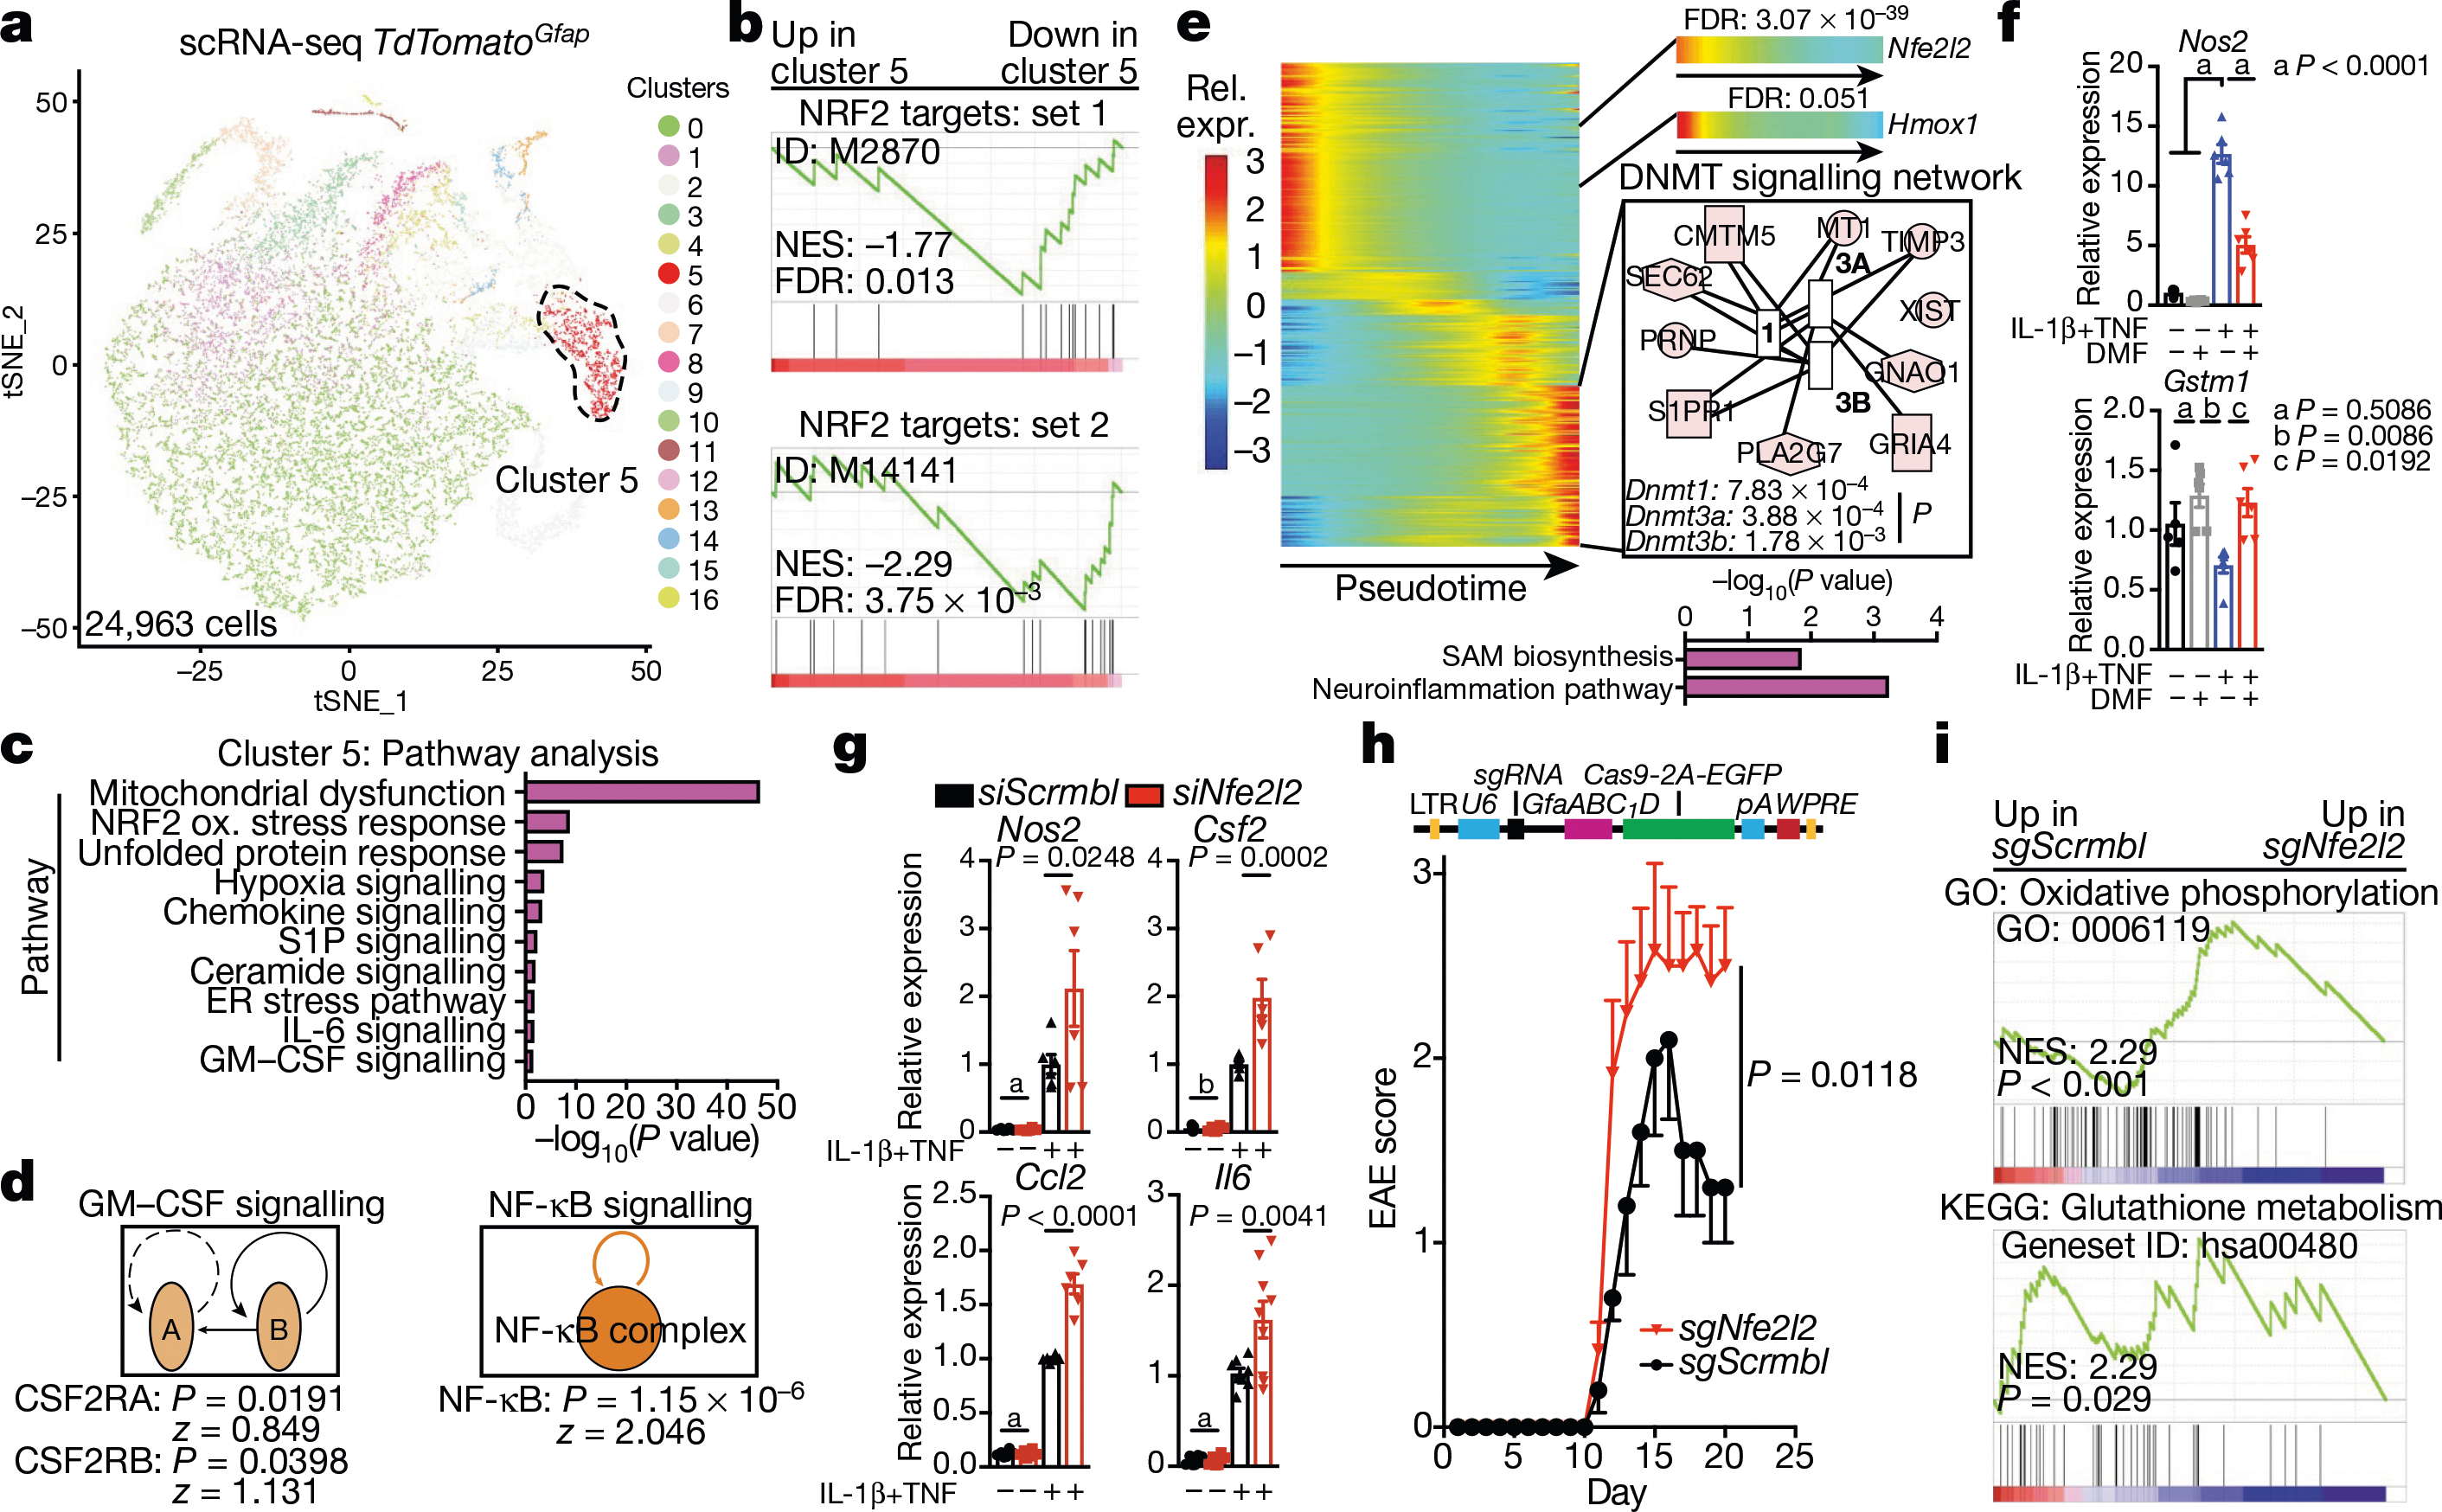
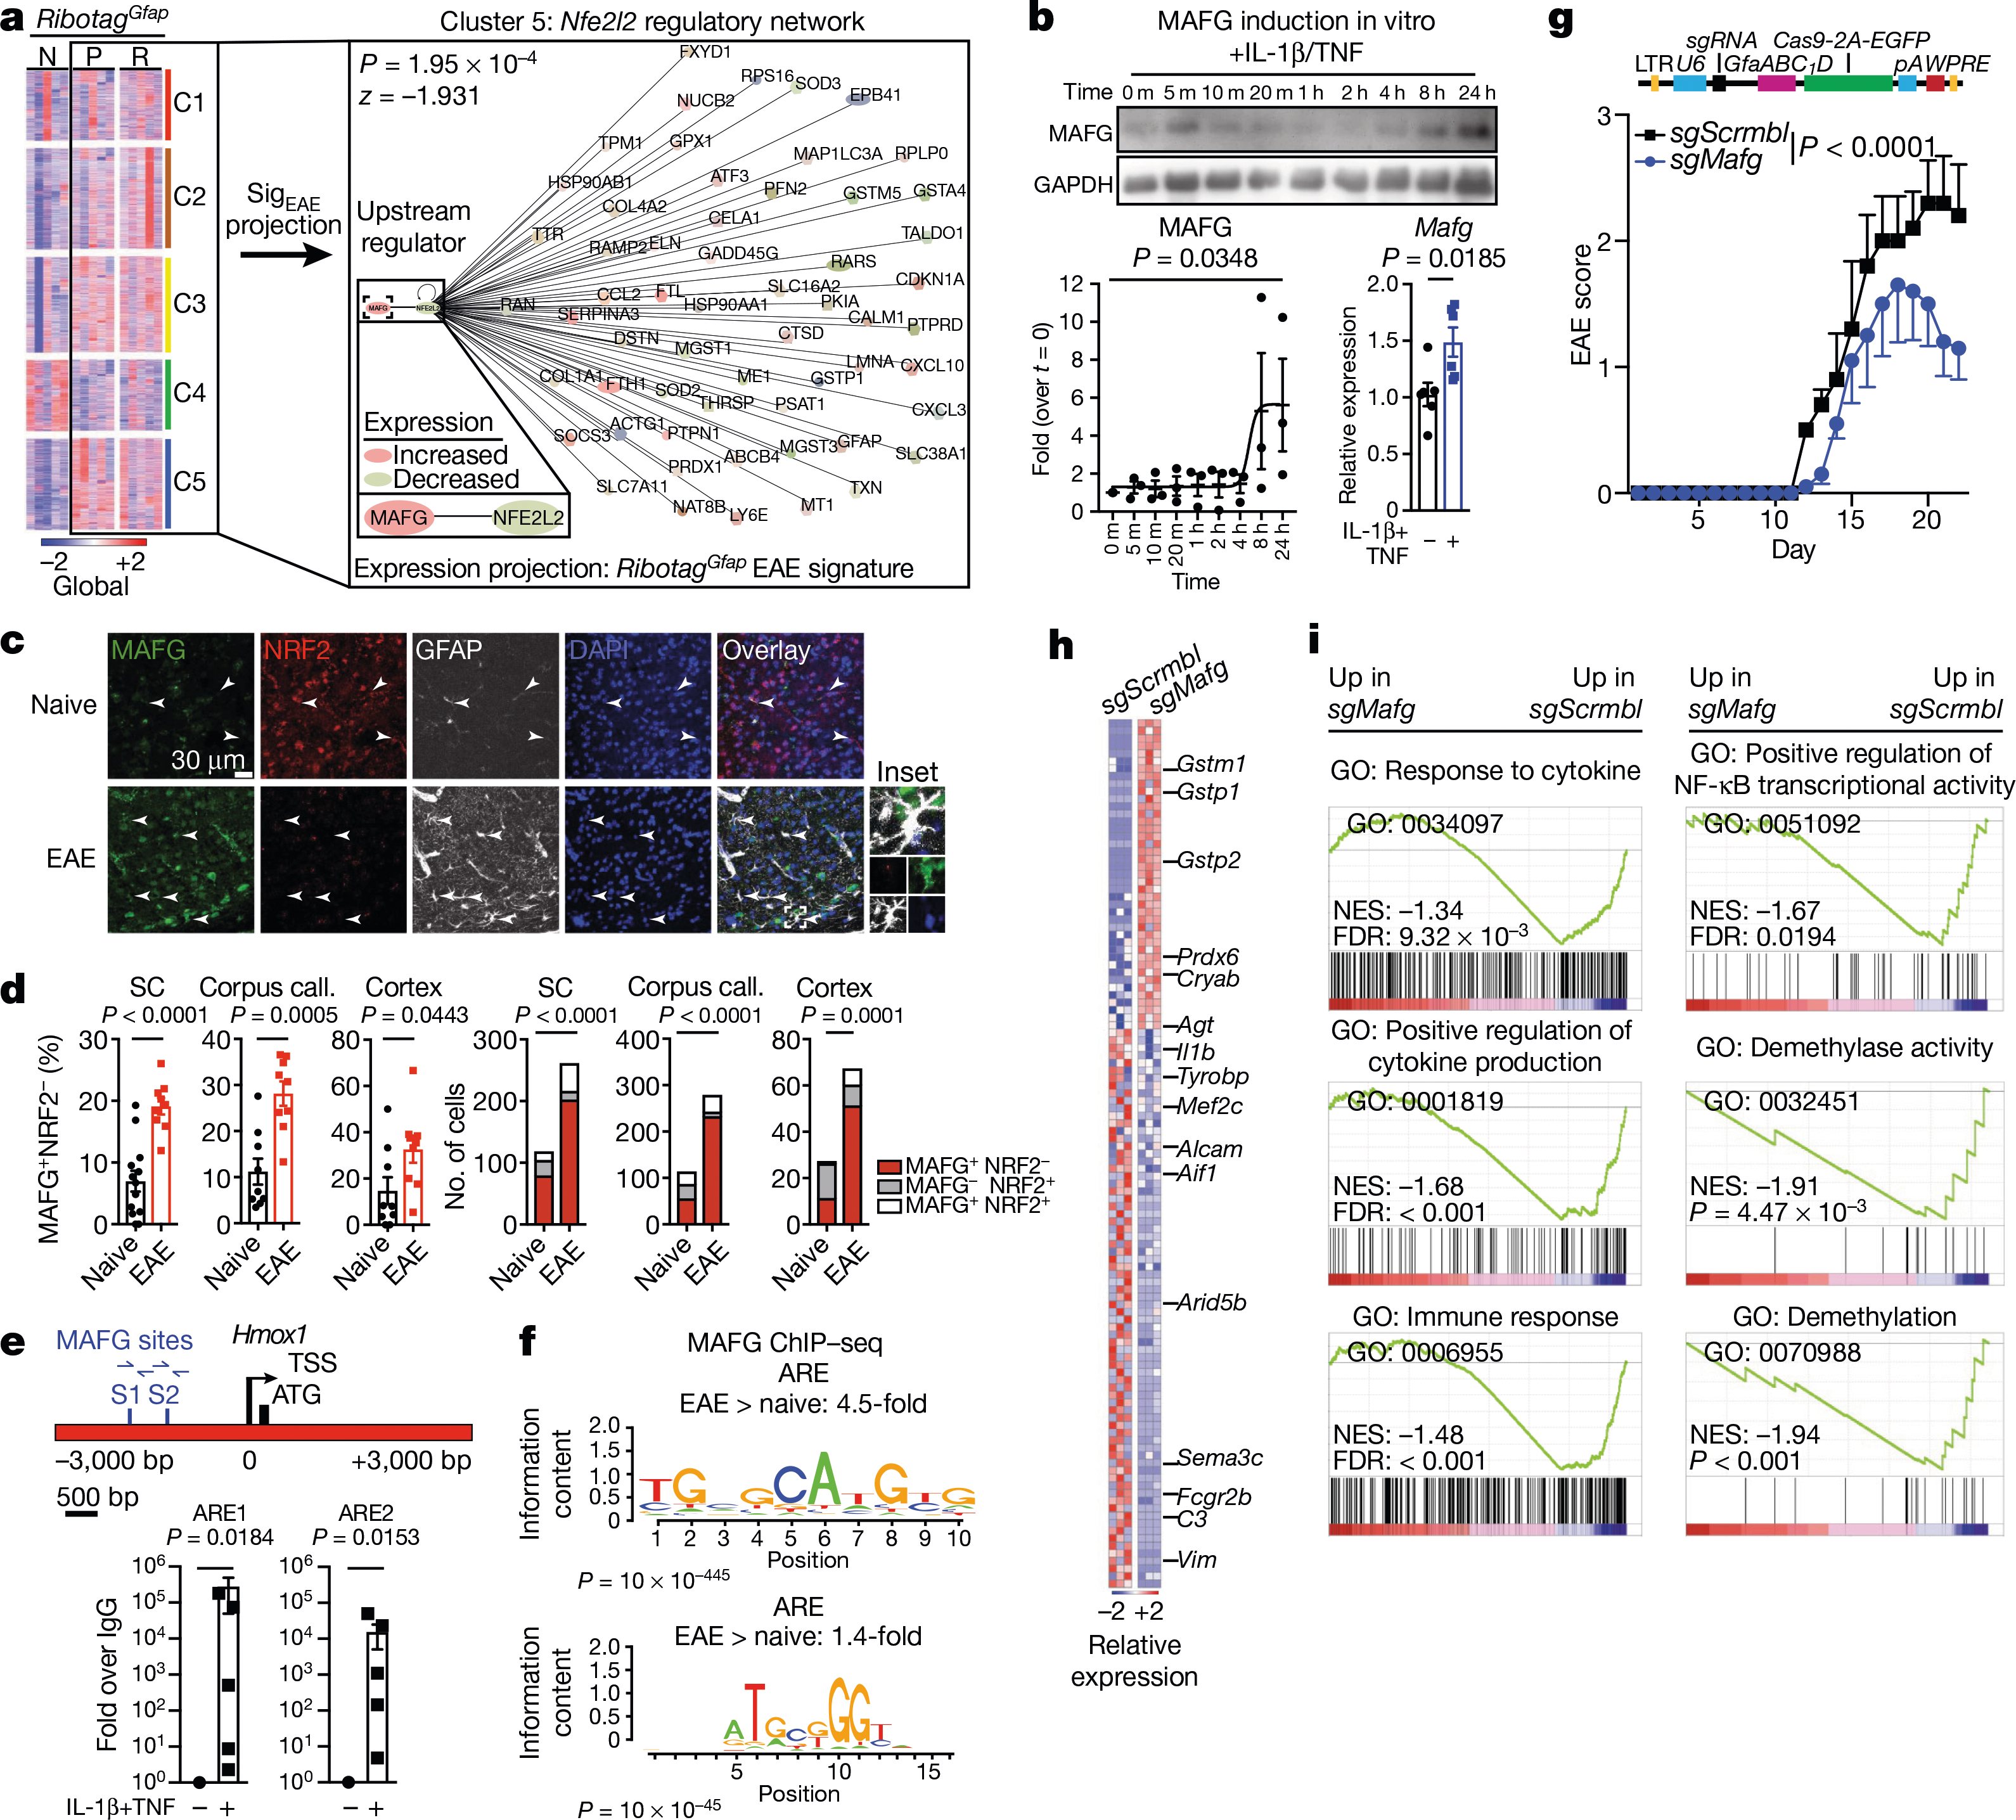
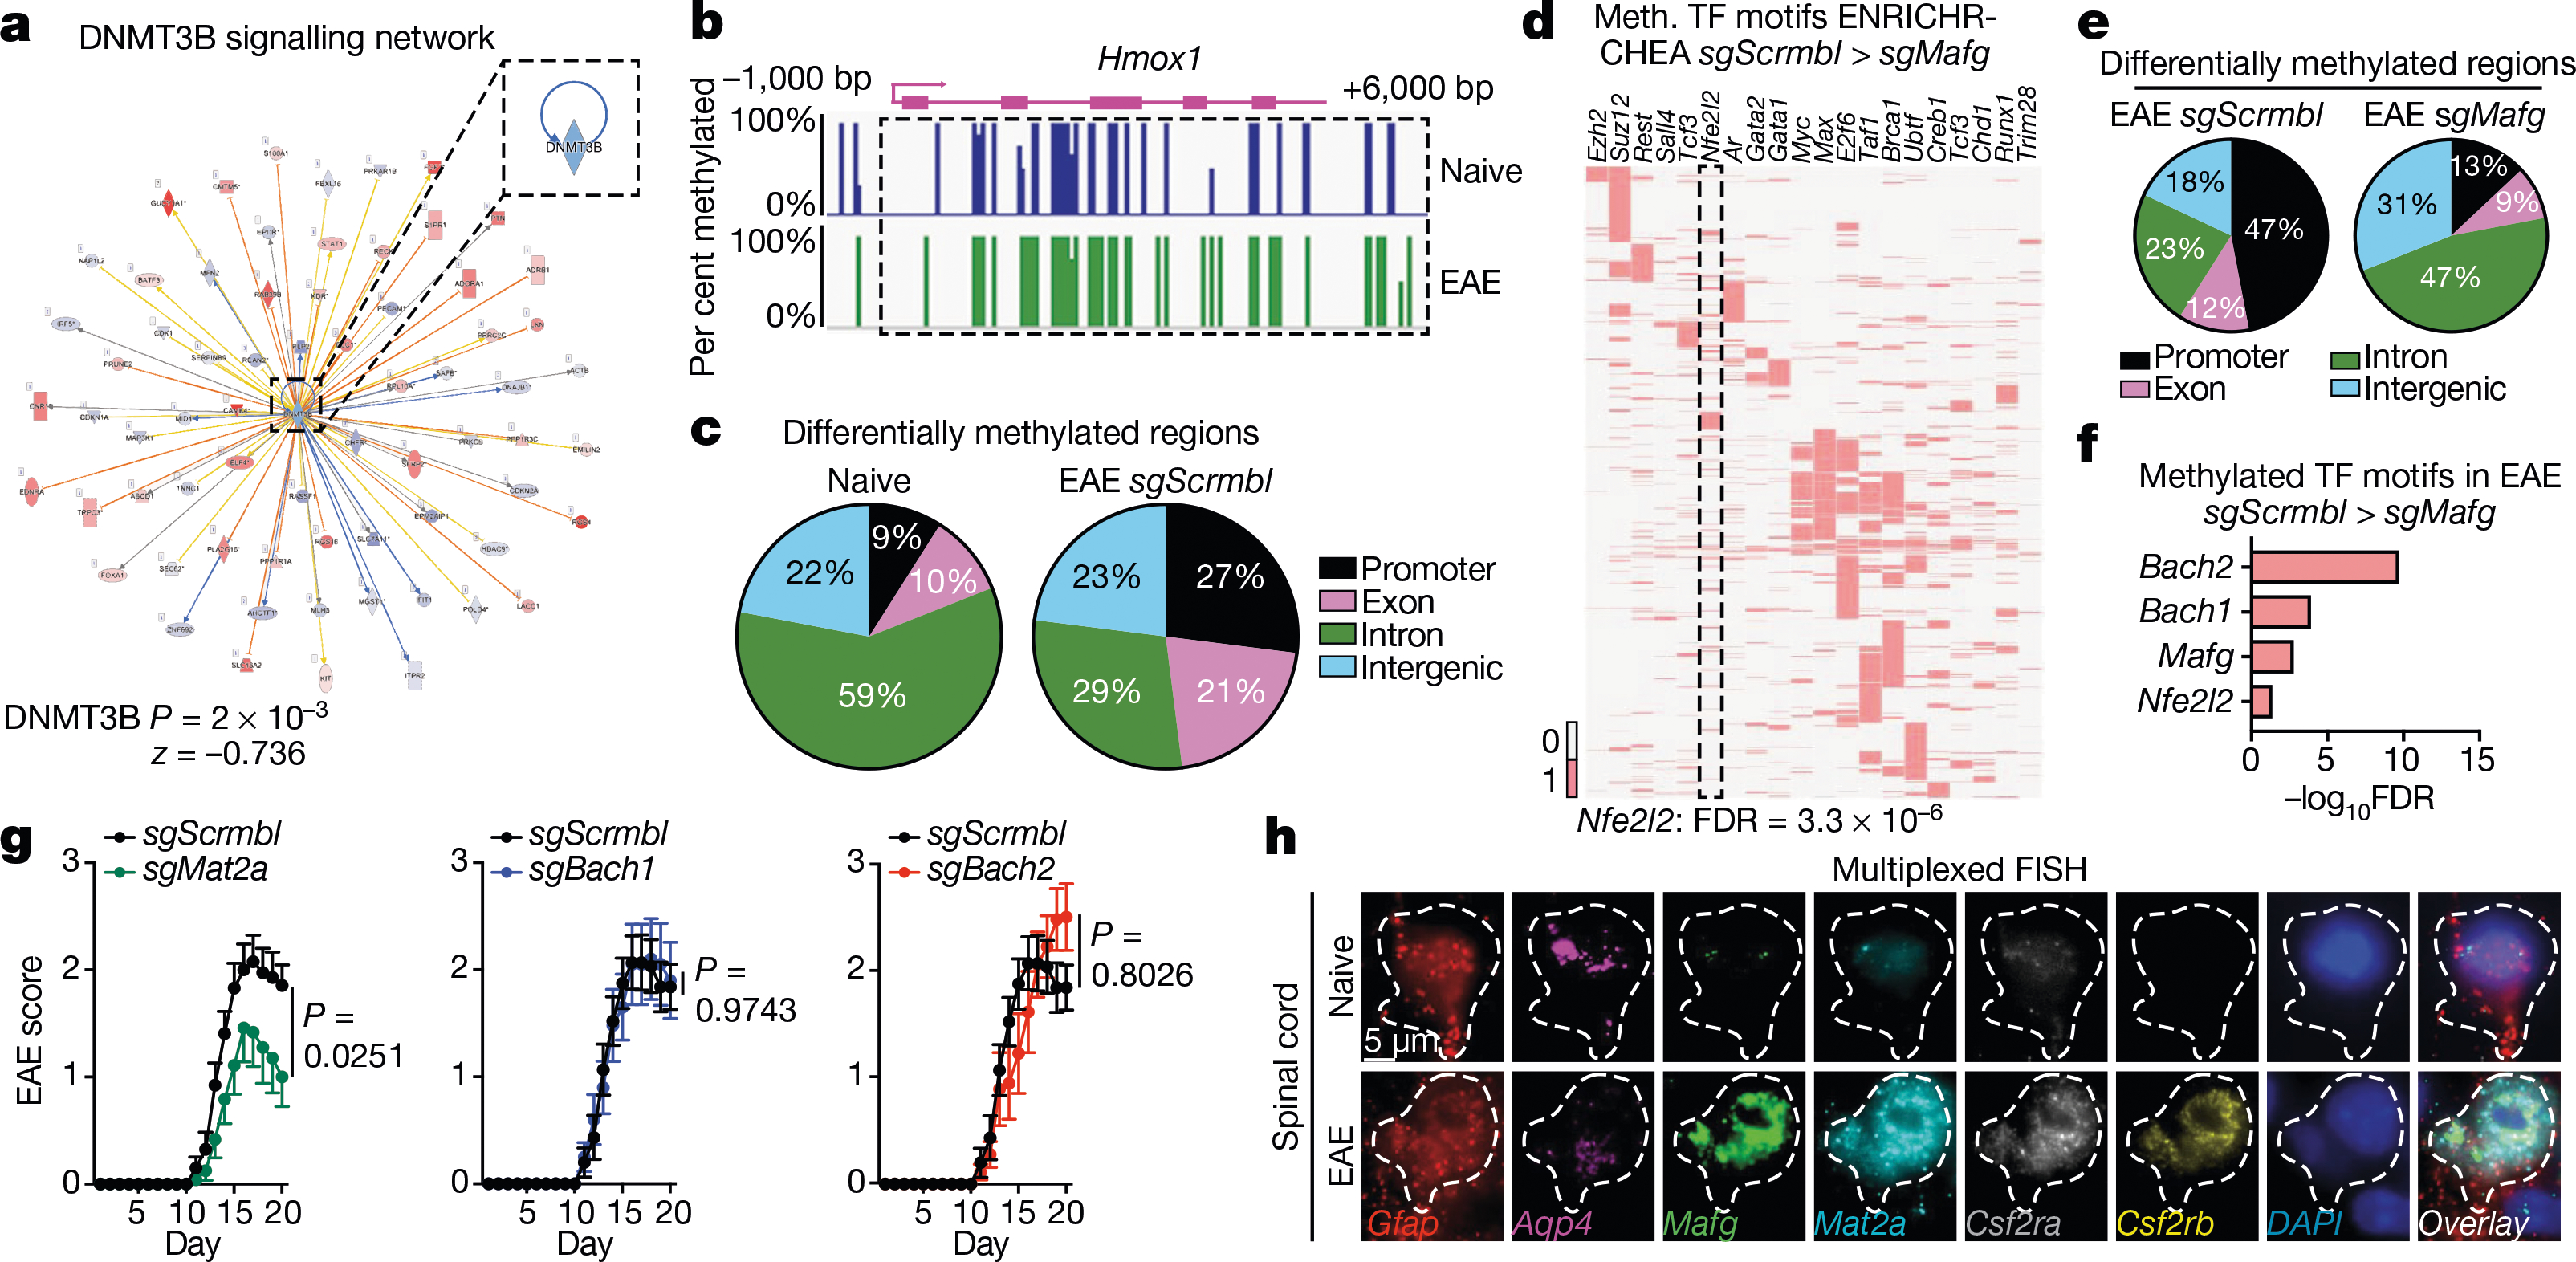
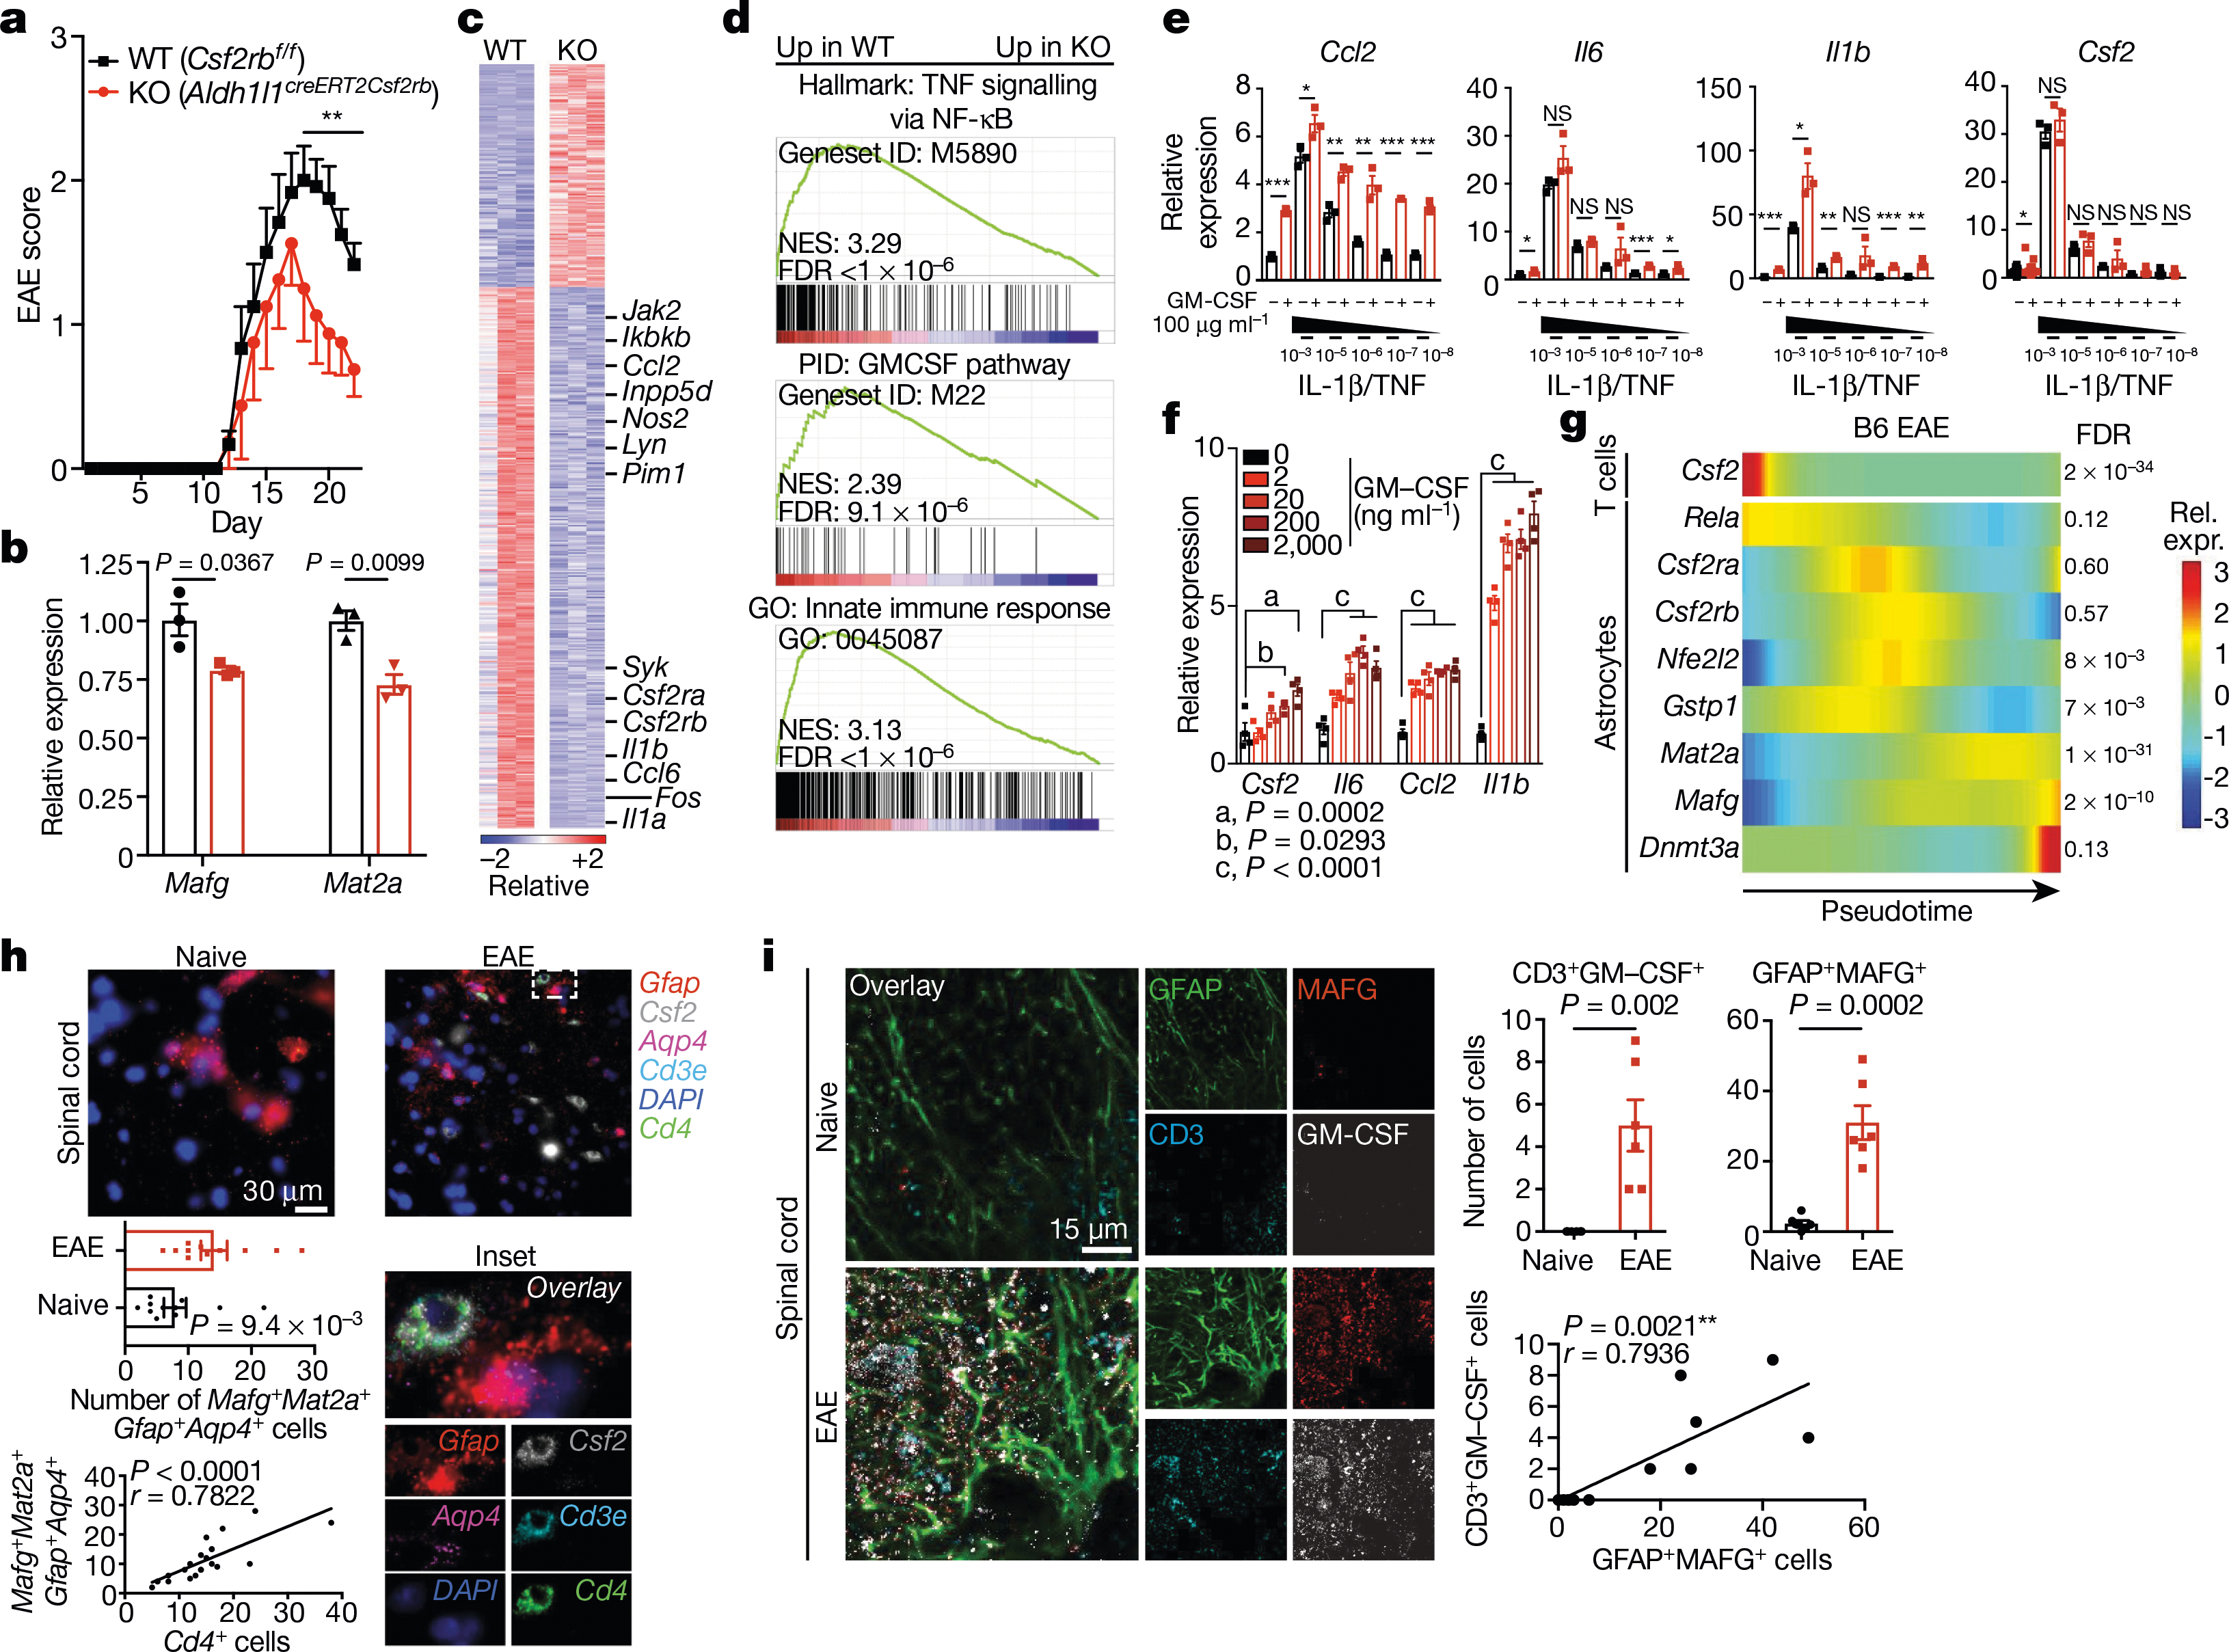
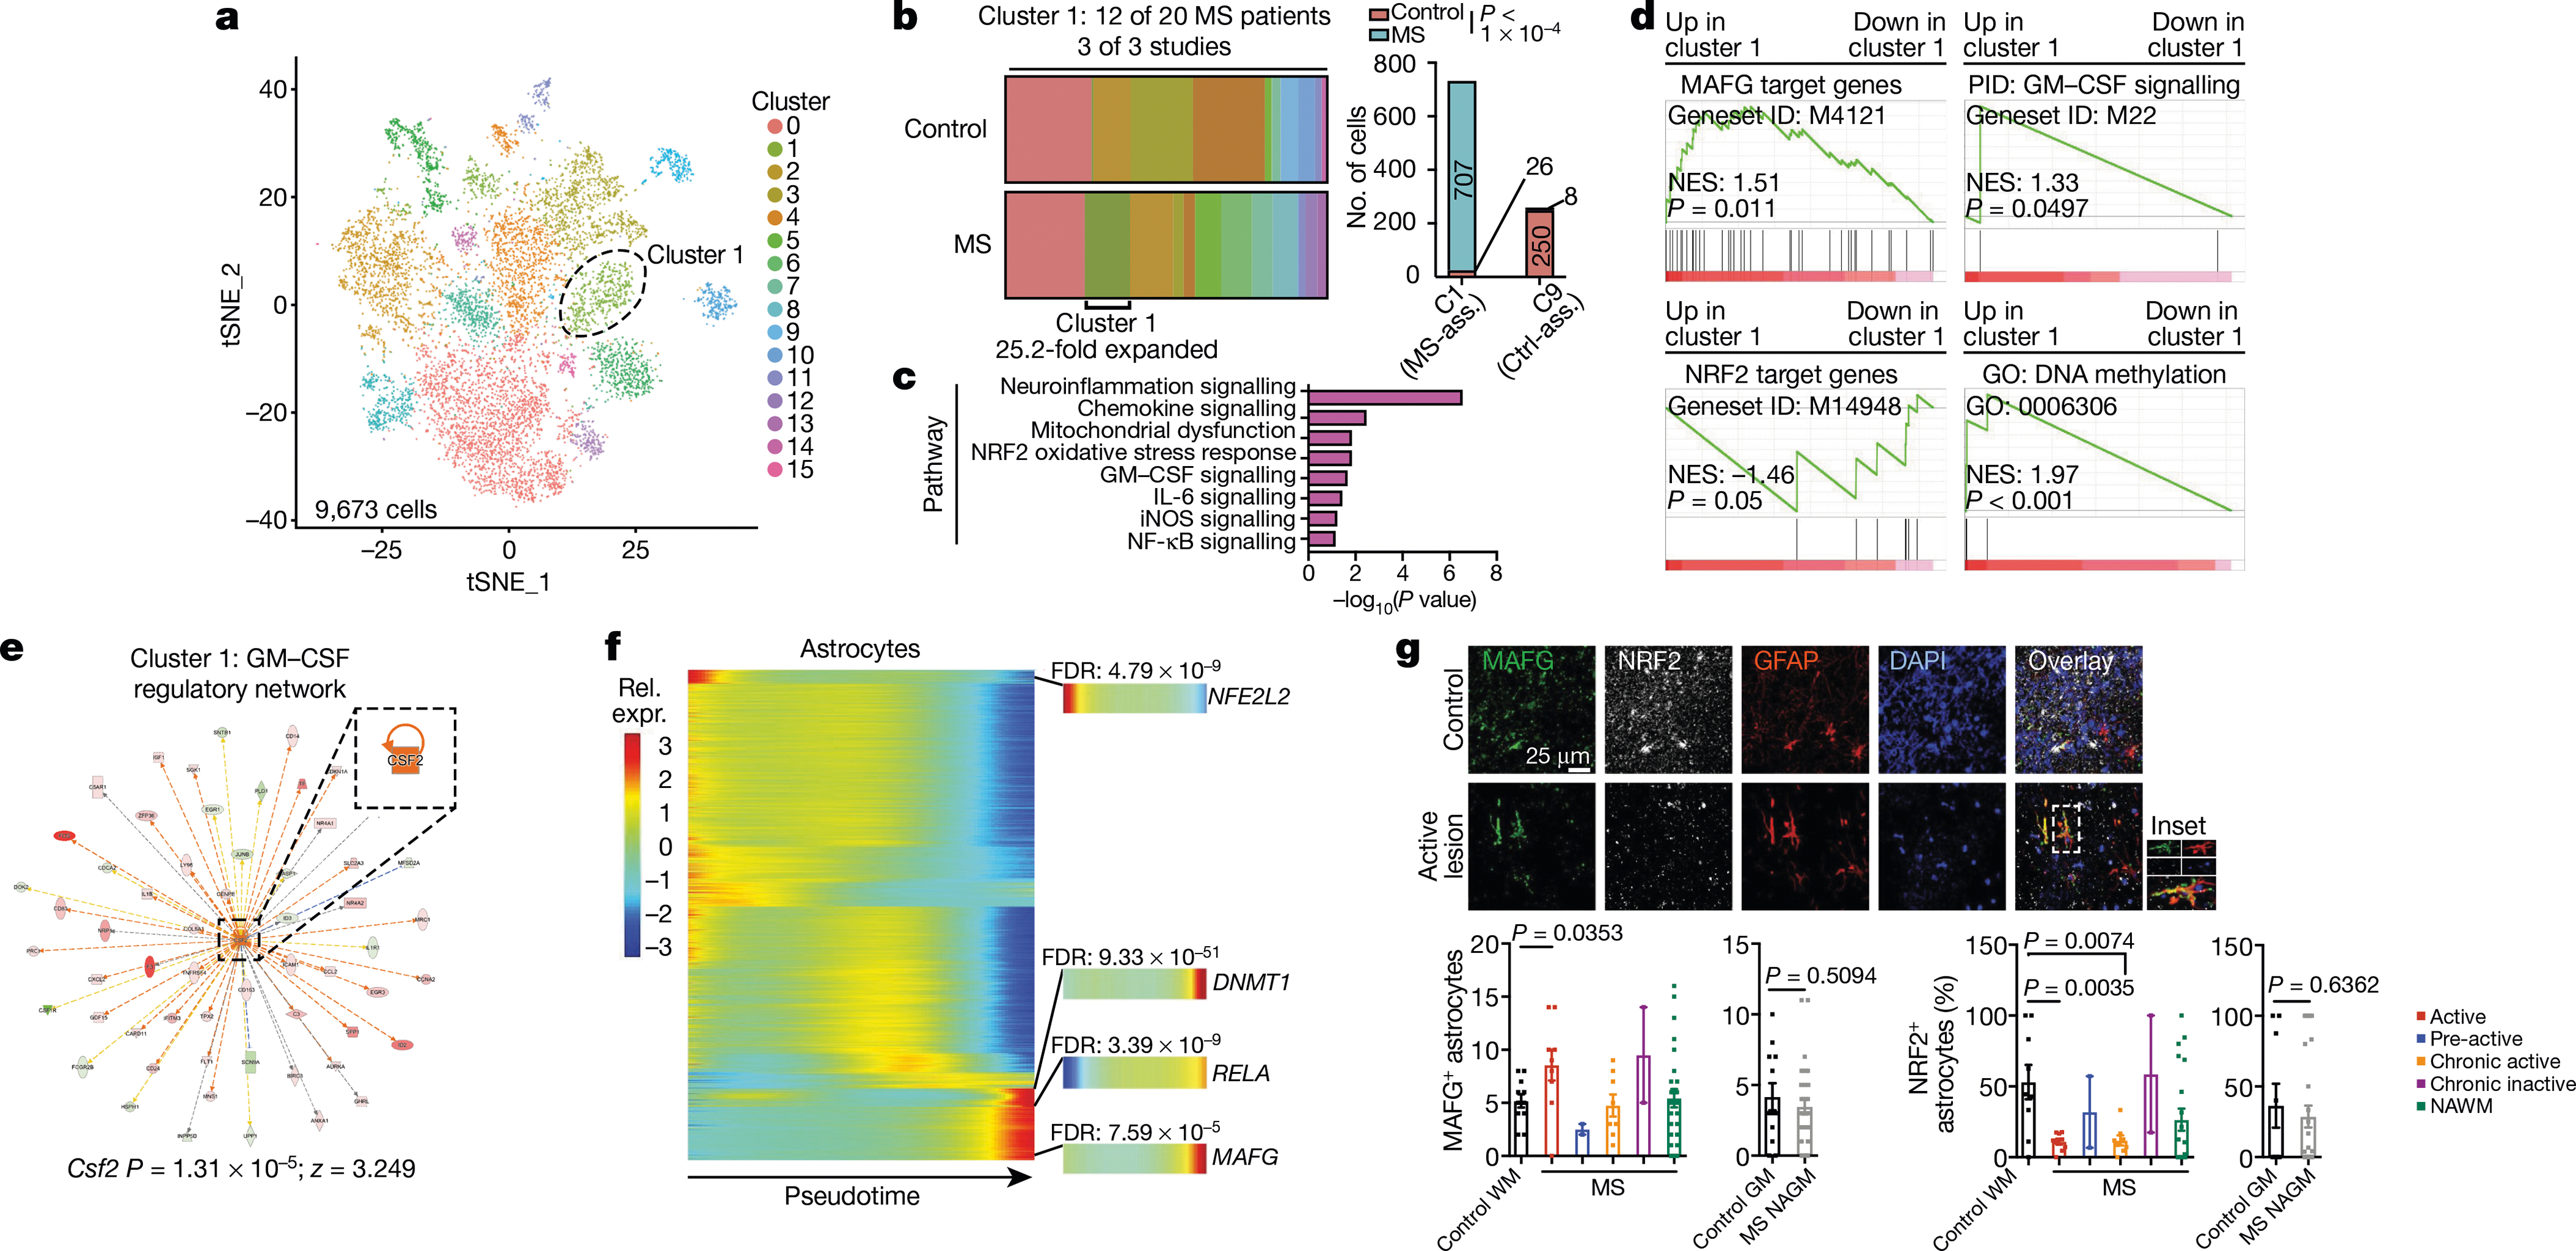
Multiple sclerosis is a chronic inflammatory disease of the CNS1. Astrocytes contribute to the pathogenesis of multiple sclerosis2, but little is known about the heterogeneity of astrocytes and its regulation. Here we report the analysis of astrocytes in multiple sclerosis and its preclinical model experimental autoimmune encephalomyelitis (EAE) by single-cell RNA sequencing in combination with cell-specific Ribotag RNA profiling, assay for transposase-accessible chromatin with sequencing (ATAC-seq), chromatin immunoprecipitation with sequencing (ChIP-seq), genome-wide analysis of DNA methylation and in vivo CRISPR-Cas9-based genetic perturbations. We identified astrocytes in EAE and multiple sclerosis that were characterized by decreased expression of NRF2 and increased expression of MAFG, which cooperates with MAT2α to promote DNA methylation and represses antioxidant and anti-inflammatory transcriptional programs. Granulocyte-macrophage colony-stimulating factor (GM-CSF) signalling in astrocytes drives the expression of MAFG and MAT2α and pro-inflammatory transcriptional modules, contributing to CNS pathology in EAE and, potentially, multiple sclerosis. Our results identify candidate therapeutic targets in multiple sclerosis.


Conflict of interest statement

Competing interests The authors declare no competing interests.

Figures

Extended Data Fig. 1 |
Extended Data Fig. 1 |. Control analyses for scRNA-seq of B6 EAE mice.
a, Cell type marker expression in mice with EAE. n = 24,275 cells. b, Unsupervised clustering tSNE plots of CNS cells from mice with EAE. n = 6 per group, n = 4 priming, n = 3 CFA. n = 24,275 cells. c, Analysis of cluster occupation by cells across EAE time points. d, Significantly enriched genes by cell type cluster. e, PCs used in study. n = 24,275 cells. f, Cluster distribution by replicates. g, Principal componentsC used in astrocyte subclustering. n = 2,079 cells. h, Gene scatterplots of astrocyte markers in the astrocyte tSNE analysis. n = 2,079 cells. i, Astrocyte marker gene expression by time point during EAE. n = 2,079 cells. j, Correlation of NRF2 target gene expression during priming and peak EAE phases compared to in naive mice. NRF2 target genes are marked in red. In total, 88 out of 123 genes were decreased at at least one time point, whereas 40 out of 123 were decreased at both time points. n = 69 cells from cluster 4.
Extended Data Fig. 2 |
Extended Data Fig. 2 |. Sorting of TdTomatoGfap astrocytes.
The forward versus side scatter (FSC versus SSC) gating strategy, followed by exclusion of FSC and SSC doublets, and TdTomato fluorescence in the phycoerythrin (PE) channel.
Extended Data Fig. 3 |
Extended Data Fig. 3 |. Expression of Mafg and Nfe2l2 in astrocytes.
a, EAE in TdTomatoGfap mice used for scRNA-seq. n = 4 mice per time point. b, Cluster composition by replicate. c, Cluster composition by EAE time point. d, Unsupervised clustering tSNE plot of TdTomatoGfap astrocytes from mice with EAE. n = 4 per group (peak, day 20 post-induction; remission, day 42 post-induction). e, Scatterplots of astrocyte markers. f, Scatterplots of genes of interest in this study. g, Principal components used in this analysis. n = 24,963 cells for all scRNA-seq experiments.
Extended Data Fig. 4 |
Extended Data Fig. 4 |. Nfe2l2 knockdown in astrocytes.
a, RNA-seq analysis of astrocytes following intracerebroventricular injection of IL-1β/TNF, EAE induction, or no treatment. n = 3 per group, n = 2 naive. b, siRNA-based knockdown of Nfe2l2 in primary astrocytes. n = 6 biologically independent samples per condition. Experiment repeated twice. Unpaired two-tailed t-test. c, Nfe2l2 expression determined by qPCR in flow cytometry-sorted astrocytes. n = 3 mice per group. One-sample t-test. d, Flow cytometry sorting strategy for astrocytes, microglia and pro-inflammatory monocytes. e, Quantification of astrocytes, microglia and pro-inflammatory monocytes. n = 3 mice per condition. One-way ANOVA, Tukey post-test. Data shown as mean ± s.e.m. ***P < 0.001, NS (not significant) P > 0.05.
Extended Data Fig. 5 |
Extended Data Fig. 5 |. Analysis of Nfe2l2Mafg signature by Ribotag and scRNA-seq.
a, EAE in mice used in RibotagGfap studies. n = 3 mice per time point. b, RINs for Ribotag preparation. IP, immunoprecipitated HA-tagged ribosomes. mRNA direct, enrichment of polyadenylated mRNA using mRNA direct kit (Thermo Fisher, #61011). n = 4 biologically independent samples per condition. c, K-means clustering of RibotagGfap RNA-seq data for five CNS regions. d, ENRICHR analysis of upregulated genes in EAE (top). Analysis of gene expression associated with the altered glutathione metabolism KEGG pathway by CNS region (bottom). Number of independent mouse samples studied: n = 7 cortex, n = 8 spinal cord, n = 7 parenchyma, n = 9 cerebellum, n = 8 cranial nerves. e, Gene expression scatterplots of genes of interest in B6 EAE scRNA-seq studies. n = 24,275 cells. Data shown as mean ± s.e.m.
Extended Data Fig. 6 |
Extended Data Fig. 6 |. Mafg knockdown in astrocytes.
a, Quantification of GFAP immunoreactivity in CNS samples from naive or EAE mice. Cortex: n = 8 naive, n = 9 EAE; spinal cord: n = 13 naive, n = 9 EAE. Kolmogorov–Smirnov test. b, Immunostaining (left) and quantification (right) of MAFG+ GFAP+ astrocytes in mice targeted with sgMafg-delivering or sgScrmbl-delivering lentiviruses. n = 6 images per group from n = 3 mice. Two-tailed Mann–Whitney test. c, T cell subsets, astrocytes, microglia and pro-inflammatory monocytes in sgMafg-targeted versus sgScrmbl-targeted mice. n = 3 per condition for T cells; n = 2 for sgScrmbl IL-10+ group. Unpaired two-tailed t-test. n = 6 per condition for astrocytes, microglia, and monocytes. Experiment repeated twice. Unpaired two-tailed t-test. Data shown as mean ± s.e.m.
Extended Data Fig. 7 |
Extended Data Fig. 7 |. Mat2a and Csf2rb knockdown in astrocytes.
a, Validation of Mat2a knockdown by western blot. n = 3 biologically independent samples per group. Single sample t-test. b, Quantification of Mafg expression by scRNA-seq in Csf2rb conditional knockout mice. n = 3 per condition. Unpaired two-tailed t-test. c, Quantification of cell populations in Csf2rb conditional knockout mice. n = 3 per condition. Unpaired two-tailed t-test. d, Large area scan of down-sampled stitched multiplexed FISH images. Arrowheads indicate T cells. Representative images from three independent experiments with n = 3 mice per group. Data shown as mean ± s.e.m.
Extended Data Fig. 8 |
Extended Data Fig. 8 |. Control analyses of scRNA-seq on human samples.
a, tSNE plots of MS and control cells. b, Cluster occupation by disease state and patient. c, RINs and scRNA-seq data quality. n = 9 per analysis. Pearson’s correlation. d, Age and sex corresponding to samples analysed. n = 5 control, n = 4 MS. Unpaired two-tailed t-test (age), Fisher’s exact test (sex). e, Principal components used in this analysis. f, Expression scatterplots of genes of interest. n = 43,670 cells. g, Cell type classification based on significantly enriched genes by cluster. h, Cell type marker scatterplots. n = 43,670 cells. Data shown as mean ± s.e.m.
Extended Data Fig. 9 |
Extended Data Fig. 9 |. Validation of GM-CSF–MAFG–NRF2 transcriptional signature in multiple human scRNA-seq datasets.
a, Analysis of regionally matched cortical astrocytes derived from patients with MS and control individuals analysed by Schirmer et al.. n = 9 controls, n = 12 patients. b, Analysis of regionally matched white matter cortical astrocytes derived from patients with MS and control individuals analysed by Jäkel et al.. n = 5 controls, n = 4 patients. c, Analysis of regionally matched cerebellar astrocytes derived from patients with MS analysed in this study and control individuals analysed by Lake et al.. n = 9 controls, n = 2 patients.
Extended Data Fig. 10 |
Extended Data Fig. 10 |. Control analyses of human astrocytes.
a, Gene scatterplots for astrocyte-specific markers in dataset representing control individuals and patients with MS compiled using data from Schirmer et al., Jäkel et al., Lake et al., and this study. n = 28 controls, n = 20 patients. n = 9,673 cells. b, Principal component analysis of all cells and astrocytes in each study. Number of cells analysed: Schirmer et al.: 48,919 (all), 5,831 (astrocytes); Jäkel et al.: 17,799 (all), 1,422 (astrocytes); this study: 43,670 cells (all), 2,332 (astrocytes). c, Principal components used in this study. d, Fraction occupation by cluster by patient. e, tSNE plot by condition and study (n = 9,673 cells). f, Analysis of IL-1β/TNF signalling in cluster 1 astrocytes from n = 28 controls and n = 20 patients with MS from the four studies. g, Canonical correlation analysis of mouse (Fig. 1, B6 EAE) and human (Fig. 6) astrocyte clusters and IPA analysis.
Fig. 1 |
Fig. 1 |. scRNA-seq analysis of astrocytes in EAE.
a, scRNA-seq analysis of CNS samples. Mice per group are n = 6 naive, n = 4 priming, n = 6 peak, n = 6 remission, n = 3 CFA. b, Unsupervised clustering t-distributed stochastic neighbour embedding (tSNE) plot of CNS cells from mice with EAE. MG, microglia; MΦ, macrophages. c, Expression scatterplots of astrocyte markers in population from b. n = 6 naive, n = 4 priming, n = 6 peak, n = 6 remission, n = 3 CFA. d, Unsupervised clustering tSNE plot of astrocytes. e, Cluster analysis of astrocytes based on per cent composition in EAE. f, Ingenuity pathway analysis (IPA) of cluster 4 astrocytes (n = 2,079 cells). g, Overlap between differentially expressed cluster 4 transcription factors and IPA predicted cluster 4 transcriptional regulators. h, Regulatory network of the intersection shown in g in cluster 4 astrocytes (n = 2,079 cells). Right-tailed Fisher’s exact test. Data shown as mean ± s.e.m.
Fig. 2 |
Fig. 2 |. NRF2 suppresses pro-inflammatory astrocyte responses in EAE.
a, Unsupervised clustering tSNE plot of TdTomatoGfap astrocytes. n = 4 naive, n = 4 peak, n = 4 remission. b, Pre-ranked gene set enrichment analysis (GSEA) of NRF2 pathways in cluster 5 astrocytes. FDR, false discovery rate. NES, normalized enrichment score. y-axis, enrichment score; x-axis, rank in ordered dataset. n = 804 cells. c, d, IPA analysis of cluster 5 astrocytes showing differentially modulated pathways (c) and predicted regulators (d). n = 804 cells. e, Pseudotime and IPA analysis of TdTomatoGfap astrocytes. Benjamini–Hochberg test. n = 24,963 cells. f, Quantitative PCR (qPCR) analysis of Nos2 and Gstm1 expression in activated astrocytes with or without DMF. n = 6 biologically independent samples per condition, n = 5 for vehicle, experiment repeated twice. One-way ANOVA, Tukey post-test. g, qPCR analysis of proinflammatory gene expression in astrocytes after short interfering RNA (siRNA)-mediated knockdown of Nfe2l2 (siNfe2l2). siScrmbl, scrambled control siRNA. n = 6 biologically independent samples per condition, n = 5 siScrmbl for vehicle Csf2, n = 8 siScrmbl for cytokines Il6, n = 9 for siNfe2l2 cytokines. Experiment repeated twice. Two-way ANOVA, Sidak post-test. a, P > 0.9999; b, P = 0.9992. h, EAE development in mice transduced with sgScrmbl (n = 19) or sgNfe2l2 (n = 10) single guide RNAs. Top, schematic of lentiviral vector. Experiment repeated twice. Two-way repeated measures ANOVA. i, GSEA of RNA-seq data for astrocytes from mice transfected with sgScrmbl or sgNfe2l2. n = 3 mice per group. GO, Gene Ontology; KEGG, Kyoto Encyclopedia of Genes and Genomes. Benjamini–Hochberg test. y-axis, enrichment score; x-axis, rank in ordered dataset. Data shown as mean ± s.e.m.
Fig. 3 |
Fig. 3 |. MAFG in astrocytes promotes CNS inflammation.
a, K-means clustering by region of expression data from RibotagGfap astrocytes projected onto cluster 5 (C5) TdTomatoGfap Nfe2l2 IPA network. Naive, n = 3; peak: n = 3 for fourth and fifth columns, n = 2 for first, second and third columns; remission: n = 3 for second, fourth and fifth columns, n = 2 for first and third columns. First column, cerebellum; second, cortex; third, cranial nerves; fourth, parenchyma; fifth, spinal cord. N, naive; P, peak; R, remission. b, Western blot (top) and quantification of induction (bottom left) of MAFG expression in activated astrocytes. Kruskal–Wallis test, uncorrected Dunn’s test. qPCR analysis (bottom right). n = 6 independent biological samples per condition, unpaired two-tailed t-test. c, d, Immunostaining (c) and quantification (d) of MAFG+NRF2 astrocytes in mice with and without EAE (naive). Left, per cent MAFG+NRF2 astrocytes. Spinal cord (SC), n = 117 cells from naive mice, n = 260 from mice with EAE; corpus callosum, n = 112 naive, n = 277 EAE; cortex, n = 27 naive, n = 67 EAE; χ2 test. Right, number of MAFG+NRF2 astrocytes. n = 13 sections for spinal cord naive, n = 9 sections otherwise, from n = 3 mice; unpaired two-tailed t-test. e, ChIP–qPCR analysis of MAFG recruitment to the Hmox1 promoter, n = 5 per group. One-sample t-test on log-normalized data. f, Antioxidant response element (ARE) motif analysis by ChIP–seq (day 23 after induction of EAE). Panels denote ARE motif sequences. n = 3 mice per group. g, EAE progression in mice transduced with sgScrmbl (n = 25) or sgMafg (n = 15). Top: schematic of lentiviral vector. Experiment repeated three times. Two-way repeated measures ANOVA. h, i, RNA-seq analysis (h) and GSEA (i) of gene expression in astrocytes from mice transduced with sgScrmbl or SgMafg. n = 3 mice per group (day 22). Data shown as mean ± s.e.m.
Fig. 4 |
Fig. 4 |. MAFG and MAT2α cooperate to promote pathogenic activity of astrocytes.
a, ATAC–seq analysis of DNMT3B network in sgMafg compared to sgScrmbl EAE mice (EAE day 22). b, WGBS of Hmox1 promoter. n = 3 mice per group. c, DNA methylation pattern in astrocytes during EAE. n = 3 mice per group. d, Transcription factor (TF) motif analysis of astrocytes from sgScrmbl compared to sgMafg EAE mice using CHEA TF motif analysis in ENRICHR. n = 3 mice per group. e, DNA methylation in astrocytes following Mafg inactivation. n = 3 mice per group. f, Methylated transcription factor motif analysis by WGBS (day 22). n = 3 mice per group. g, EAE in mice transduced with sgMat2a (n = 12), sgBach1 (n = 10), sgBach2 (n = 9) or sgScrmbl (n = 20) lentiviruses. Two-way repeated measures ANOVA. h, Multiplexed FISH showing gene coexpression in astrocytes from EAE and naive mice. Representative images from three independent experiments, n = 3 mice per group.
Fig. 5 |
Fig. 5 |. GM-CSF signalling promotes pathogenic activity in astrocytes.
a, EAE progression in wild-type (WT) mice and mice lacking Csf2rb (KO). n = 12 (WT), n = 8 (KO). Experiment repeated twice. Two-way repeated measures ANOVA. Statistical values by day (d) are: d18 (**P = 0.0078), d19 (**P = 0.0015), d20 (**P = 0.0009), d21 (**P = 0.0078), d22 (**P = 0.0097). b, qPCR analysis of expression of Mafg and Mat2a in astrocytes from WT and KO mice (EAE day 22). n = 3 per group; unpaired two-tailed t-test per gene. c, RNA-seq analysis of differential gene expression between astrocytes from WT and KO mice (EAE day 22). n = 3 per group. d, GSEA for genes differentially expressed in WT versus KO mice. n = 3 mice per condition. e, qPCR analysis of gene expression in primary astrocytes with or without different doses of GM-CSF or escalating doses of IL-1β/TNF. n = 3 per condition; n = 18 for Csf2–vehicle. Unpaired two-tailed t-test per grouping, Csf2 data log-normalized. f, qPCR of GM-CSF dose response in primary astrocytes. n = 4 biologically independent samples per condition. Experiment repeated twice. Two-way ANOVA, Dunnett post-test. g, Pseudotime analysis of scRNA-seq data from B6 mice with EAE. n = 9,629 cells. h, Multiplexed FISH analysis of gene co-expression in astrocytes from mice with or without EAE. n = 11 per group from n = 3 mice. Unpaired two-tailed Mann–Whitney test (top), Pearson’s correlation (bottom). i, Immunostaining (left) and quantification (right) of MAFG+ astrocytes in close proximity to GM-CSF+ T cells in spinal cord from mice with or without EAE. n = 6 images per group from n = 3 mice. Unpaired two-tailed t-test (top), Pearson’s correlation (bottom). ***P < 0.001, **P < 0.01, *P < 0.05, NS P > 0.05 (not significant). Data shown as mean ± s.e.m.
Fig. 6 |
Fig. 6 |. MAFG activation characterizes an astrocyte population associated with MS.
a, tSNE plot by cluster for astrocytes from patients with MS and control individuals from Schirmer et al., Jäkel et al., Lake et al., and this study (n = 9,673 cells). b, Fraction of cells per cluster overall (left) and by patient (right). MS-ass., MS-associated cluster; Ctrl-ass., control-associated cluster. Fisher’s exact test. c, IPA pathway chart of n = 733 cluster 1 astrocytes. d, Pre-ranked GSEA in n = 733 cluster 1 astrocytes. e, GM-CSF regulatory network in cluster 1 astrocytes. f, Pseudotime analysis of gene expression in human astrocytes (n = 9,673 cells). n = 20 MS patients and n = 28 controls by scRNA-seq. g, Immunostaining (top) and quantification (bottom) of MAFG+ astrocytes and NRF2+ astrocytes in tissue samples from patients with MS (n = 5) and control individuals (n = 4). WM, white matter; GM, grey matter; NAWM, normally appearing white matter; NAGM, normally appearing grey matter. Sample sizes from left to right: MAFG analysis: n = 11 sections, n = 9, n = 2, n = 8, n = 2, n = 27, n = 12, n = 30. NRF2 analysis: n = 9, n = 9, n = 2, n = 8, n = 2, n = 20, n = 9, n = 28. Unpaired two-tailed t-test. Data shown as mean ± s.e.m.

Comment in

References

    1. Reich DS, Lucchinetti CF & Calabresi PA Multiple sclerosis. N. Engl. J. Med 378, 169–180 (2018). - PMC - PubMed
    1. Baecher-Allan C, Kaskow BJ & Weiner HL Multiple sclerosis: mechanisms and immunotherapy. Neuron 97, 742–768 (2018). - PubMed
    1. Allen NJ & Lyons DA Glia as architects of central nervous system formation and function. Science 362, 181–185 (2018). - PMC - PubMed
    1. Sofroniew MV Astrocyte barriers to neurotoxic inflammation. Nat. Rev. Neurosci 16, 249–263 (2015). - PMC - PubMed
    1. Colonna M & Butovsky O Microglia function in the central nervous system during health and neurodegeneration. Annu. Rev. Immunol 35, 441–468 (2017). - PMC - PubMed

MeSH terms