

Serum hepatitis B virus RNA predicts response to peginterferon treatment in HBeAg-positive chronic hepatitis B
- PMID: 32052503
- PMCID: PMC7383601
- DOI: 10.1111/jvh.13272
Serum hepatitis B virus RNA predicts response to peginterferon treatment in HBeAg-positive chronic hepatitis B
Abstract
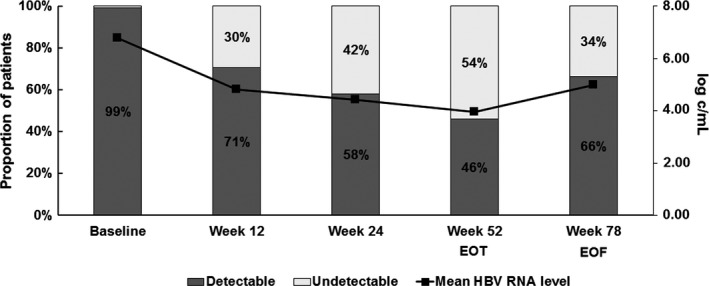
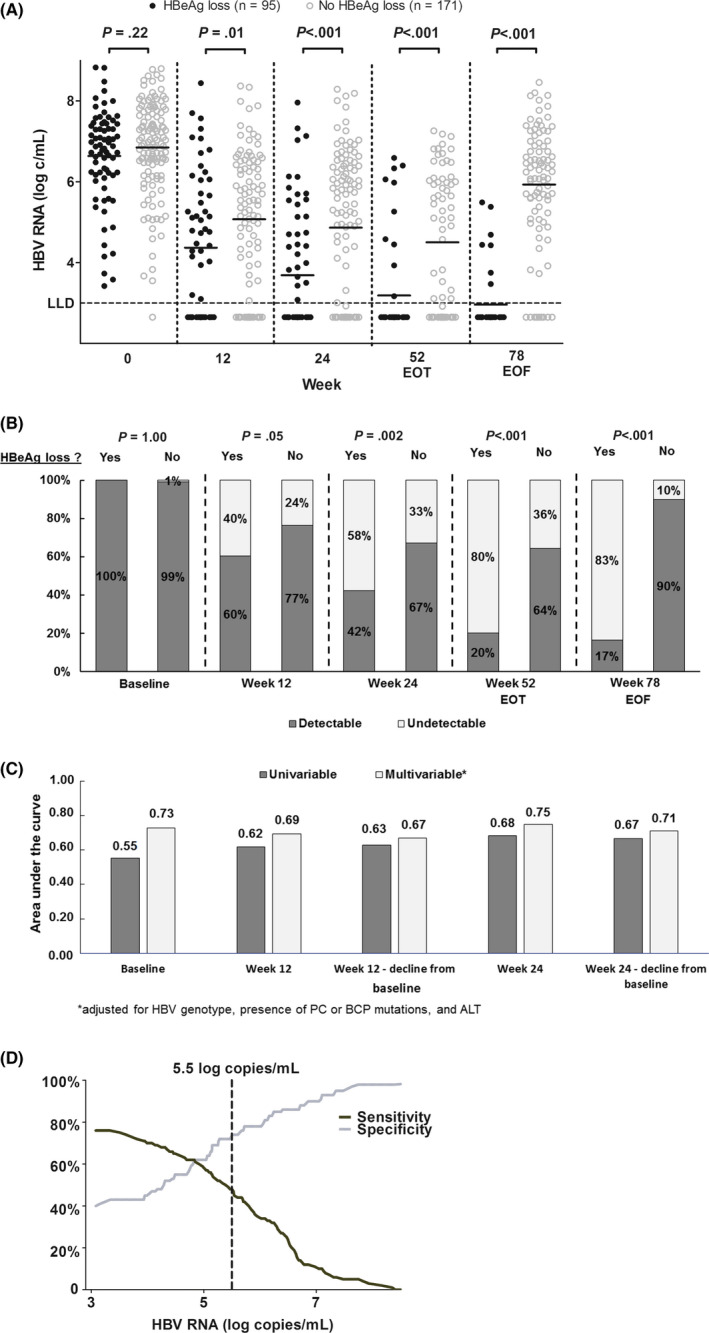
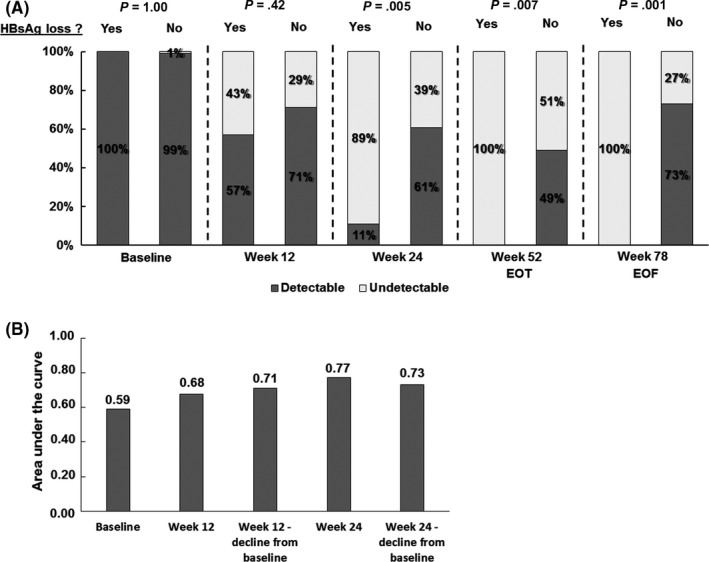
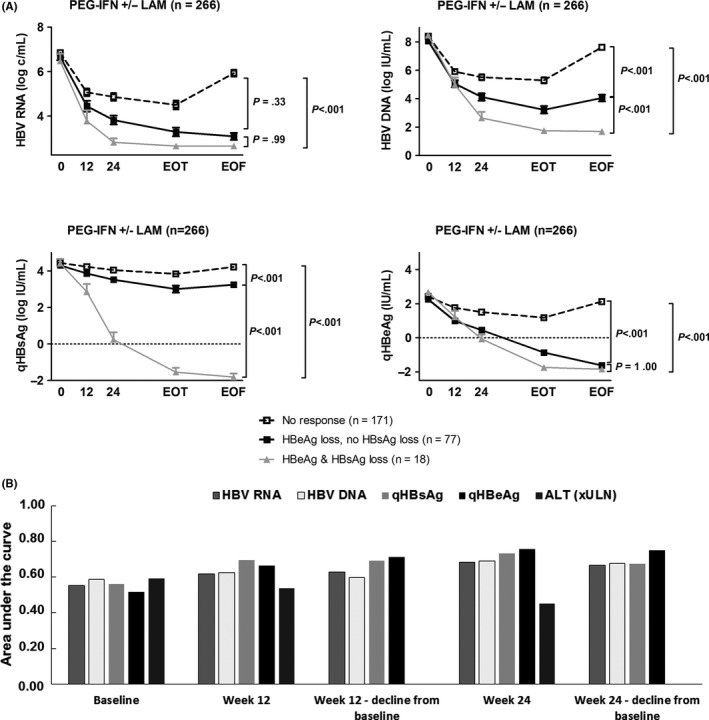
Hepatitis B virus (HBV) RNA in serum is a novel biomarker that reflects cccDNA activity. We investigated whether HBV RNA can predict serological response to peginterferon (PEG-IFN) treatment. Serum HBV RNA levels were retrospectively measured at weeks 0, 12, 24 and 52 of therapy and after treatment discontinuation (week 78) in 266 HBeAg-positive chronic HBV patients who had participated in a global randomized controlled trial (HBV99-01 study). Patients received 52 weeks PEG-IFN monotherapy (n = 136) or PEG-IFN and lamivudine (n = 130). The primary end point was HBeAg loss 24 weeks after PEG-IFN discontinuation. At baseline, the mean serum level of HBV RNA was 6.8 (SD 1.2) log c/mL. HBV RNA levels declined to 4.7 (1.7) log c/mL after one year of PEG-IFN therapy alone and to 3.3 (1.2)log c/mL after combination therapy. From week 12 onward, HBV RNA level was significantly lower in patients who achieved HBeAg loss at the end of follow-up as compared to those who did not, regardless of treatment allocation (week 12:4.4 vs 5.1 log c/mL, P = .01; week 24:3.7 vs 4.9 log c/mL, P < .001). The performance of a multivariable model based on HBV RNA level was comparable at week 12 (AUC 0.68) and 24 (AUC 0.72) of therapy. HBV RNA level above 5.5 log c/mL at week 12 showed negative predictive values of 93/67/90/64% for HBV genotypes A/B/C/D for the prediction of HBeAg loss. In conclusion, HBV RNA in serum declines profoundly during PEG-IFN treatment. Early on-treatment HBV RNA level may be used to predict nonresponse.
Keywords: chronic hepatitis B infection; functional cure; peginterferon treatment; serum marker; treatment response.
© 2020 The Authors. Journal of Viral Hepatitis published by John Wiley & Sons Ltd.
Conflict of interest statement
FvB has been in speaker's bureau and advisory boards for Gilead Sciences, Bristol‐Myers Squibb, Roche Pharma, Abbvie, MSA and has received research grants from Roche Pharmaceuticals, Gilead Sciences and Bristol‐Myers Squibb. AB has been in consulting or in advisory boards for Gilead Sciences and Bristol‐Myers Squibb and has received research grants from Roche, Gilead Sciences, Fujirebio and Janssen. TB received grants and personal fees from AbbVie, Bristol‐Myers Squibb, Gilead Sciences, Janssen, Bayer, Vertex, Tibotec, Intercept, Merck Sharp & Dohme and Roche. HLAJ received grants from AbbVie, Bristol Myers Squibb, Gilead Sciences, Innogenetics, Janssen, Medimmune, Medtronic, Merck and Roche and is consultant for AbbVie, Benitec, Bristol Myers Squibb, Gilead Sciences, Janssen, Medimmune, Merck, Roche and Arbutus. The other authors have nothing to disclose.
Figures

Similar articles
-
Peginterferon-α2a combined with response-guided short-term lamivudine improves response rate in hepatitis B e antigen-positive hepatitis B patients: a pilot study.Eur J Gastroenterol Hepatol. 2013 Oct;25(10):1165-9. doi: 10.1097/MEG.0b013e3283612e95. Eur J Gastroenterol Hepatol. 2013. PMID: 23571612 Clinical Trial.
-
Serum HBV RNA as a Predictor of Peginterferon Alfa-2a Response in Patients With HBeAg-Positive Chronic Hepatitis B.J Infect Dis. 2018 Aug 24;218(7):1066-1074. doi: 10.1093/infdis/jiy270. J Infect Dis. 2018. PMID: 29741634 Clinical Trial.
-
[Quantifiable changes in HBeAg expression predict therapeutic efficacy of peg-interferon alfa-2a in patients with HBeAg-positive chronic hepatitis B].Zhonghua Gan Zang Bing Za Zhi. 2013 May;21(5):335-9. doi: 10.3760/cma.j.issn.1007-3418.2013.05.006. Zhonghua Gan Zang Bing Za Zhi. 2013. PMID: 24025132 Chinese.
-
Peginterferon α in the treatment of chronic hepatitis B.Expert Opin Biol Ther. 2014 Jul;14(7):995-1006. doi: 10.1517/14712598.2014.907784. Epub 2014 Apr 16. Expert Opin Biol Ther. 2014. PMID: 24738850 Review.
-
Peginterferon alfa-2a (40 kD) stopping rules in chronic hepatitis B: a systematic review and meta-analysis of individual participant data.Antivir Ther. 2019;24(2):133-140. doi: 10.3851/IMP3304. Antivir Ther. 2019. PMID: 30865588
Cited by
-
Selective detection of HBV pre-genomic RNA in chronic hepatitis B patients using a novel RT-PCR assay.Clin Exp Med. 2023 Dec;23(8):5281-5289. doi: 10.1007/s10238-023-01162-6. Epub 2023 Aug 12. Clin Exp Med. 2023. PMID: 37572154
-
Hepatitis B virus RNA decline without concomitant viral antigen decrease is associated with a low probability of sustained response and hepatitis B surface antigen loss.Aliment Pharmacol Ther. 2021 Jan;53(2):314-320. doi: 10.1111/apt.16172. Epub 2020 Nov 21. Aliment Pharmacol Ther. 2021. PMID: 33222190 Free PMC article.
-
A standardized assay for the quantitative detection of serum HBV RNA in chronic hepatitis B patients.Emerg Microbes Infect. 2022 Dec;11(1):775-785. doi: 10.1080/22221751.2022.2045874. Emerg Microbes Infect. 2022. PMID: 35220917 Free PMC article.
-
Diversity of the nucleic acid forms of circulating HBV in chronically infected patients and its impact on viral cycle.Hepatol Int. 2022 Dec;16(6):1259-1272. doi: 10.1007/s12072-022-10389-6. Epub 2022 Aug 4. Hepatol Int. 2022. PMID: 35927368
-
Standardized Hepatitis B Virus RNA Quantification in Untreated and Treated Chronic Patients: a Promising Marker of Infection Follow-Up.Microbiol Spectr. 2022 Apr 27;10(2):e0214921. doi: 10.1128/spectrum.02149-21. Epub 2022 Apr 4. Microbiol Spectr. 2022. PMID: 35377229 Free PMC article.
References
-
- World Health Organization . Hepatitis B. World Health Organization Fact Sheet 204 (Updated July 2017). 2017.
-
- Liver. EAftSot . EASL 2017 Clinical Practice Guidelines on the management of hepatitis B virus infection. J Hepatol 2017;67(2):370‐398. - PubMed
-
- Lucifora J, Protzer U. Attacking hepatitis B virus cccDNA–The holy grail to hepatitis B cure. J Hepatol. 2016;64(1 Suppl):S41‐S48. - PubMed
-
- Su TH, Kao JH. Unmet needs in clinical and basic hepatitis B virus research. J Infect Dis. 2017;216(suppl_8):S750‐S756. - PubMed
Publication types
MeSH terms
Substances
LinkOut - more resources
Full Text Sources
