

GC bias affects genomic and metagenomic reconstructions, underrepresenting GC-poor organisms
- PMID: 32052832
- PMCID: PMC7016772
- DOI: 10.1093/gigascience/giaa008
GC bias affects genomic and metagenomic reconstructions, underrepresenting GC-poor organisms
Abstract
Background: Metagenomic sequencing is a well-established tool in the modern biosciences. While it promises unparalleled insights into the genetic content of the biological samples studied, conclusions drawn are at risk from biases inherent to the DNA sequencing methods, including inaccurate abundance estimates as a function of genomic guanine-cytosine (GC) contents.
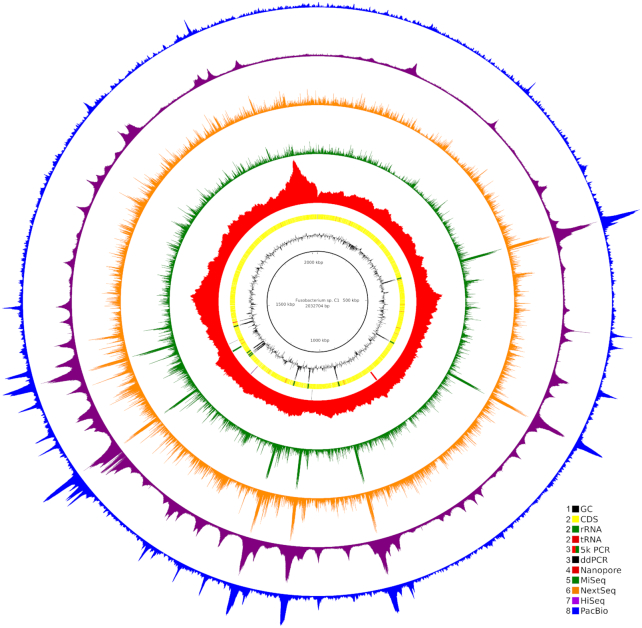
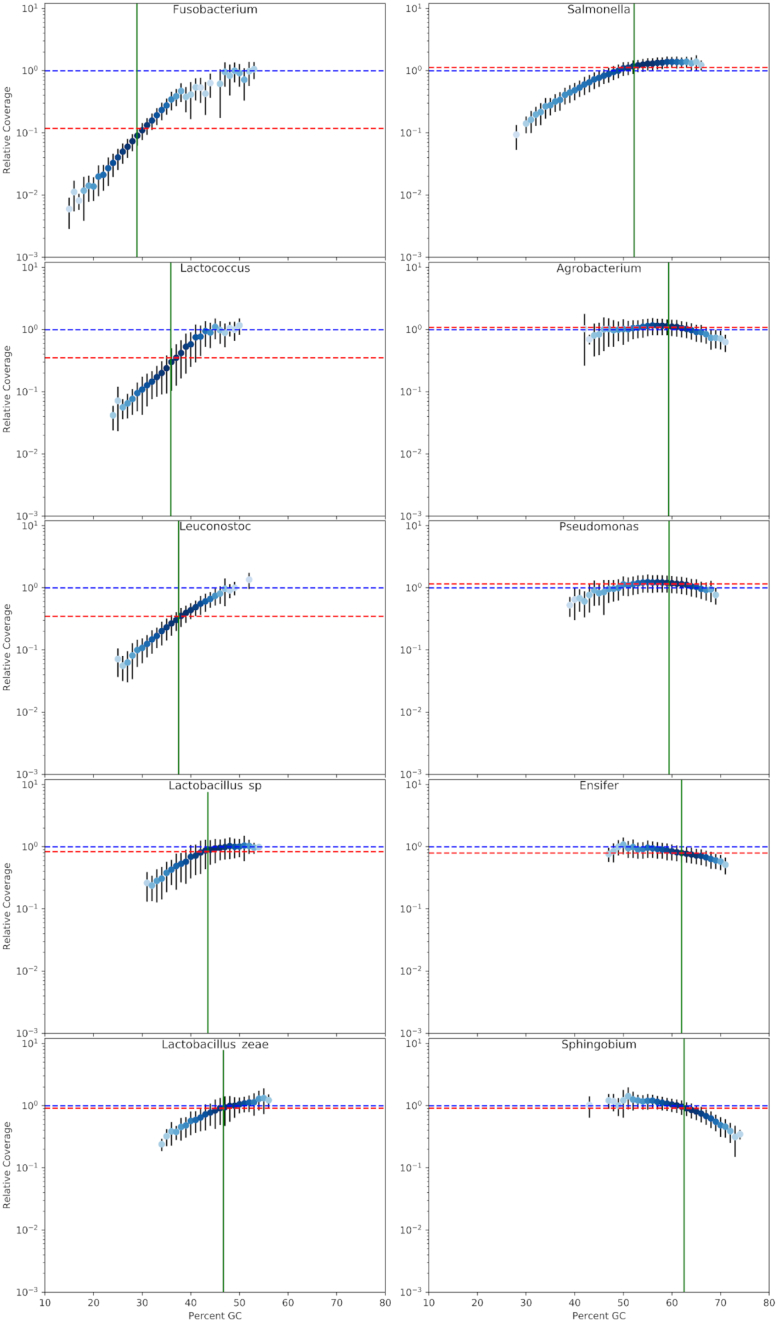
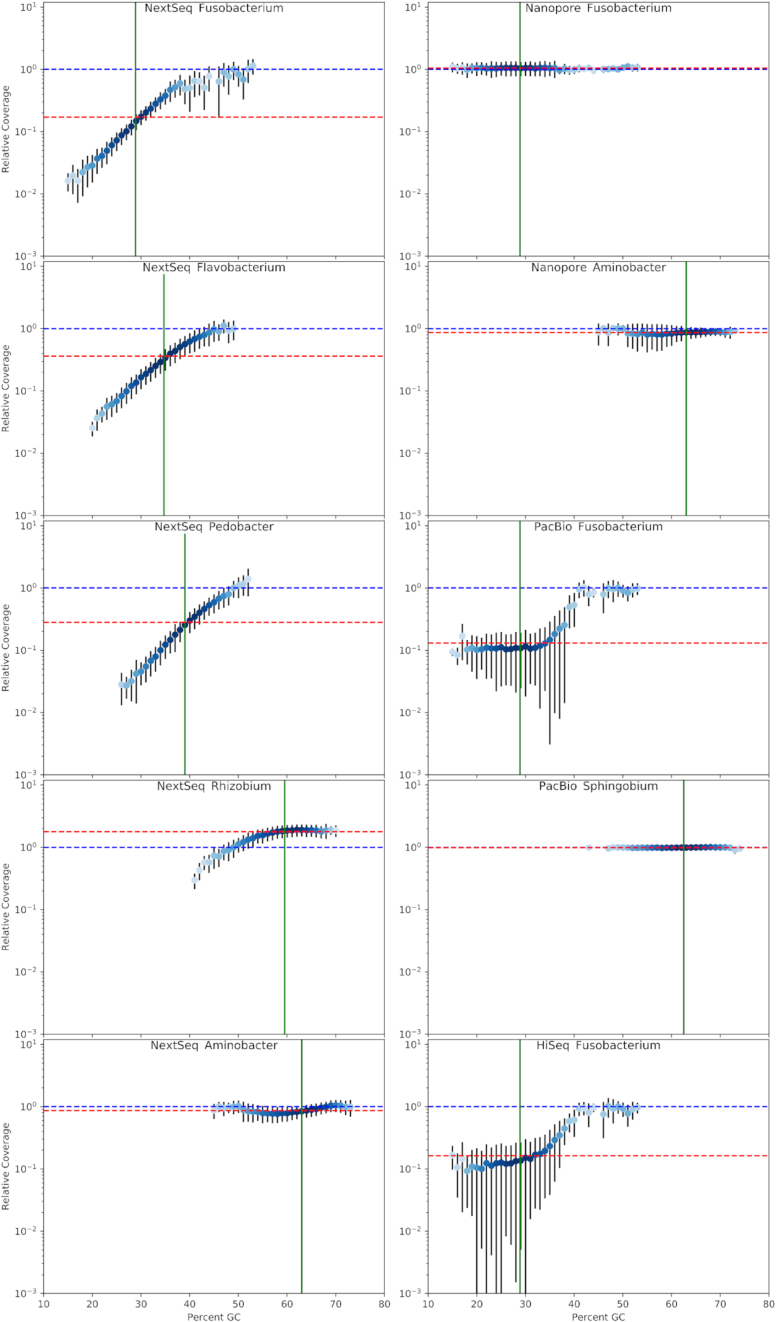
Results: We explored such GC biases across many commonly used platforms in experiments sequencing multiple genomes (with mean GC contents ranging from 28.9% to 62.4%) and metagenomes. GC bias profiles varied among different library preparation protocols and sequencing platforms. We found that our workflows using MiSeq and NextSeq were hindered by major GC biases, with problems becoming increasingly severe outside the 45-65% GC range, leading to a falsely low coverage in GC-rich and especially GC-poor sequences, where genomic windows with 30% GC content had >10-fold less coverage than windows close to 50% GC content. We also showed that GC content correlates tightly with coverage biases. The PacBio and HiSeq platforms also evidenced similar profiles of GC biases to each other, which were distinct from those seen in the MiSeq and NextSeq workflows. The Oxford Nanopore workflow was not afflicted by GC bias.
Conclusions: These findings indicate potential sources of difficulty, arising from GC biases, in genome sequencing that could be pre-emptively addressed with methodological optimizations provided that the GC biases inherent to the relevant workflow are understood. Furthermore, it is recommended that a more critical approach be taken in quantitative abundance estimates in metagenomic studies. In the future, metagenomic studies should take steps to account for the effects of GC bias before drawing conclusions, or they should use a demonstrably unbiased workflow.
Keywords: GC bias; Illumina; Oxford Nanopore; PacBio; high-throughput sequencing; metagenomics.
© The Author(s) 2020. Published by Oxford University Press.
Figures
References
Publication types
MeSH terms
LinkOut - more resources
Full Text Sources
Miscellaneous
