

Elevated M2 Macrophage Markers in Epiretinal Membranes With Ectopic Inner Foveal Layers
- PMID: 32053728
- PMCID: PMC7326506
- DOI: 10.1167/iovs.61.2.19
Elevated M2 Macrophage Markers in Epiretinal Membranes With Ectopic Inner Foveal Layers
Abstract
Purpose: To analyze the differences in the vitreous cytokine profiles in epiretinal membrane eyes with and without an ectopic inner foveal layer (EIFL).
Methods: Sixty eyes with epiretinal membrane (32 eyes without EIFL and 28 eyes with EIFL) were included. The vitreous samples were collected during surgery for epiretinal membrane. The cytokine levels of the vitreous were measured using a multiplex bead analysis.
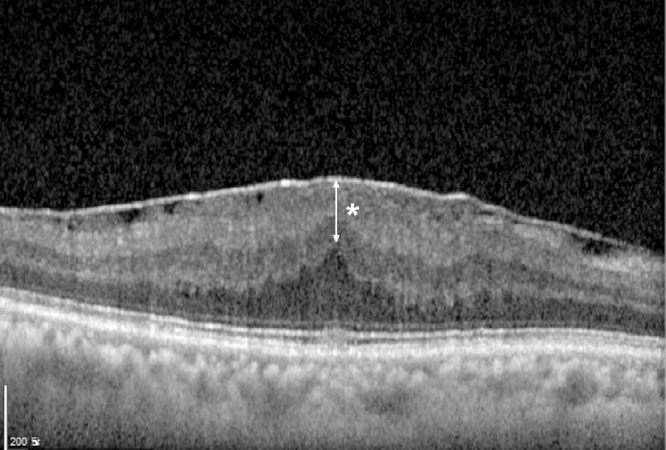
Results: The mean logMAR visual acuity was worse (0.42 vs. 0.37; P = 0.331) and the central foveal thickness was higher in the EIFL group (496.9 µm vs. 434.2 µm; P = 0.007) than they were in the group without EIFL. The mean EIFL thickness was 164.1 ± 67.7 µm in the EIFL group. On multiplex analysis of the vitreous cytokines, the levels of CD163 (21529 pg/dL vs. 10877 pg/dL; P = 0.002) and macrophage colony-stimulating factor (206 pg/dL vs. 159 pg/dL, P = 0.004) were significantly higher in the EIFL group than they were in the group without EIFL.
Conclusions: Eyes with EIFL had increased vitreous levels of M2 macrophage markers. The activation of glial cell proliferation by M2 macrophages may contribute to EIFL formation.
Conflict of interest statement
Disclosure:
Figures

References
-
- McCarty DJ, Mukesh BN, Chikani V, et al. .. Prevalence and associations of epiretinal membranes in the visual impairment project. Am J Ophthalmol. 2005; 140: 288–294. - PubMed
-
- You Q, Xu L, Jonas JB. Prevalence and associations of epiretinal membranes in adult Chinese: the Beijing eye study. Eye (Lond). 2008; 22: 874–879. - PubMed
-
- Schumann RG, Gandorfer A, Ziada J, et al. .. Hyalocytes in idiopathic epiretinal membranes: a correlative light and electron microscopic study. Graefes Arch Clin Exp Ophthalmol. 2014; 252: 1887–1894. - PubMed
-
- Gass J. Stereoscopic Atlas of Macular Diseases: Diagnosis and Treatment. St Louis, MO: Mosby; 1997.
Publication types
MeSH terms
Substances
LinkOut - more resources
Full Text Sources
Research Materials
