. 2020 Feb 12;27(2):199-212.e5.
doi: 10.1016/j.chom.2020.01.004.

Bacteriophages Isolated from Stunted Children Can Regulate Gut Bacterial Communities in an Age-Specific Manner

Affiliations

Bacteriophages Isolated from Stunted Children Can Regulate Gut Bacterial Communities in an Age-Specific Manner

Mohammadali Khan Mirzaei et al. Cell Host Microbe. .

Abstract

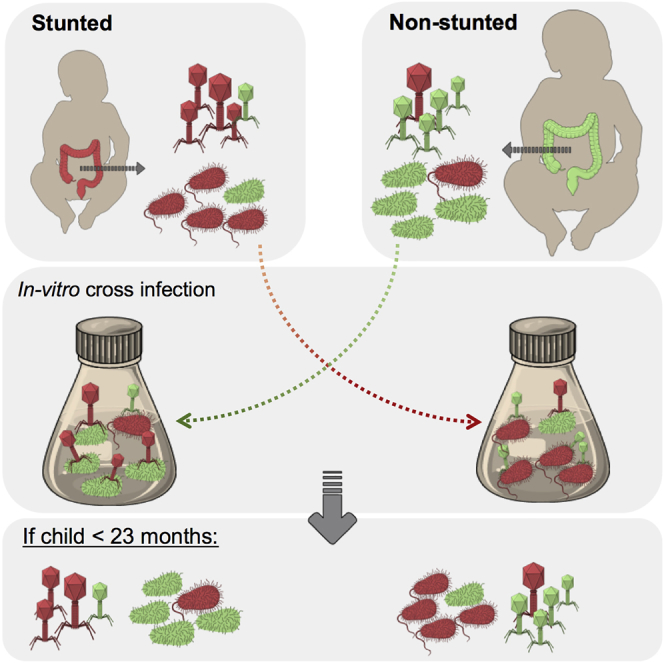
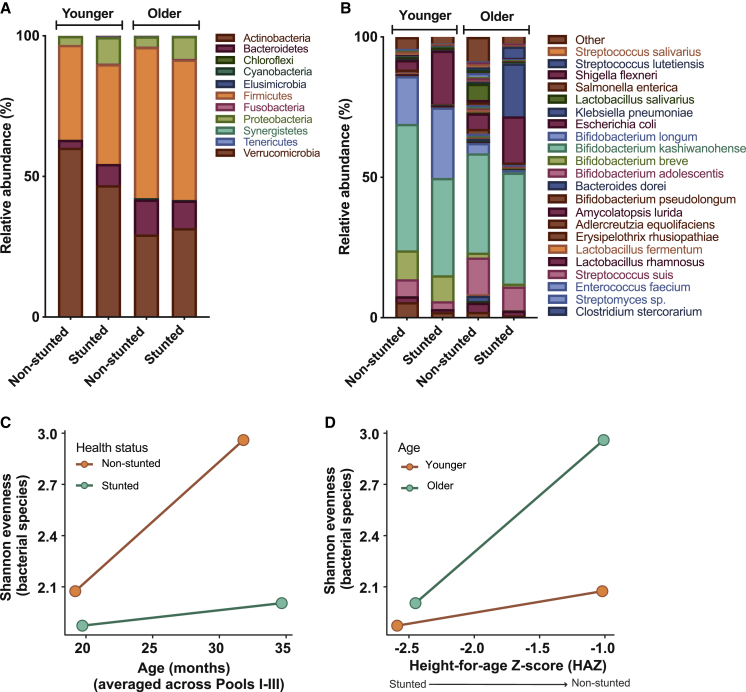
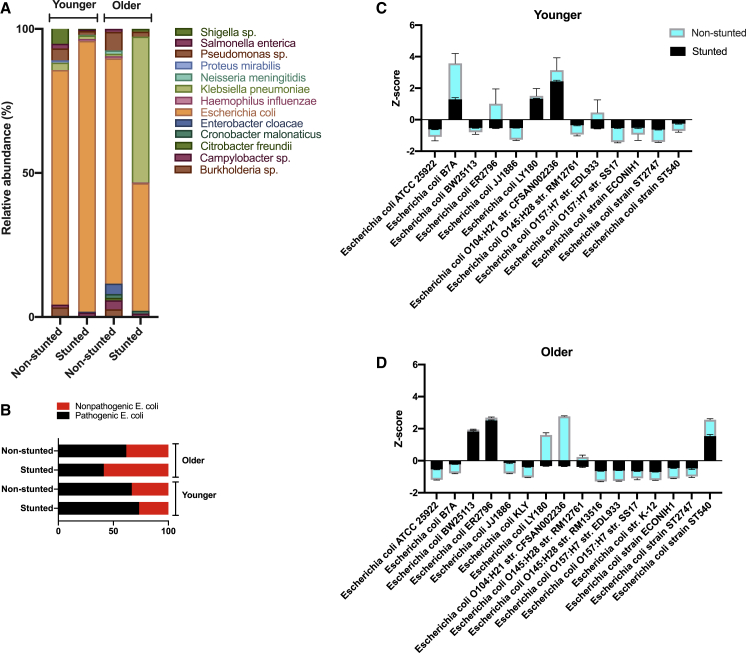
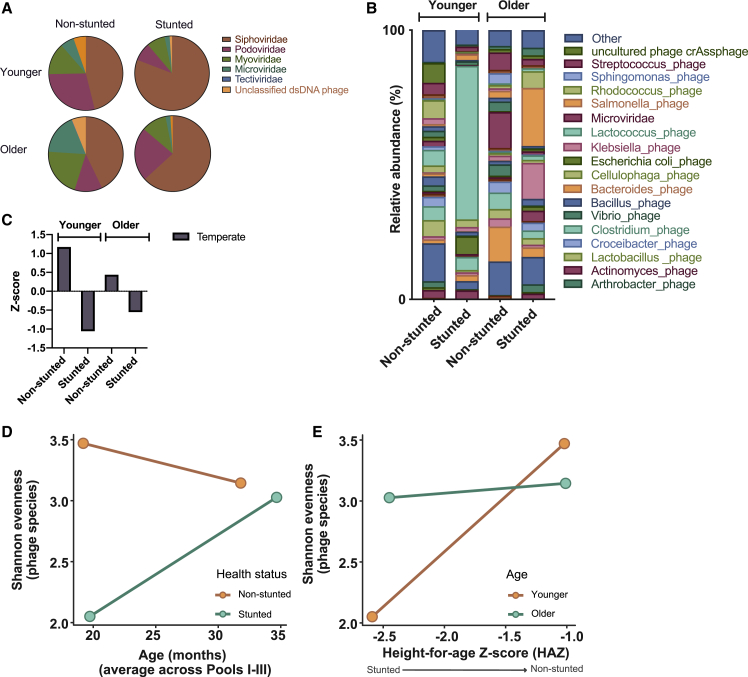
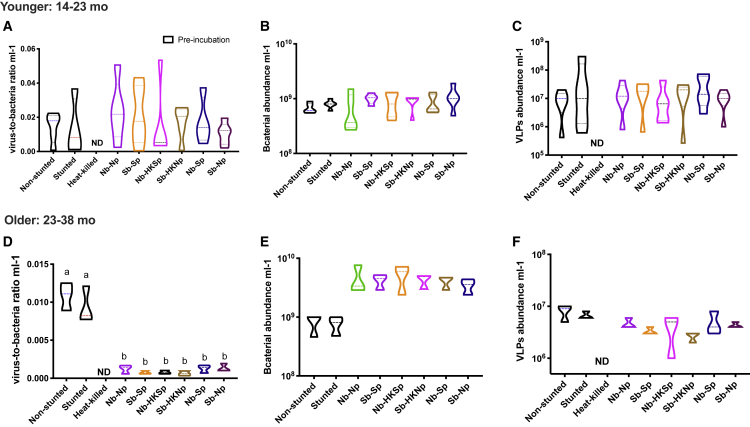
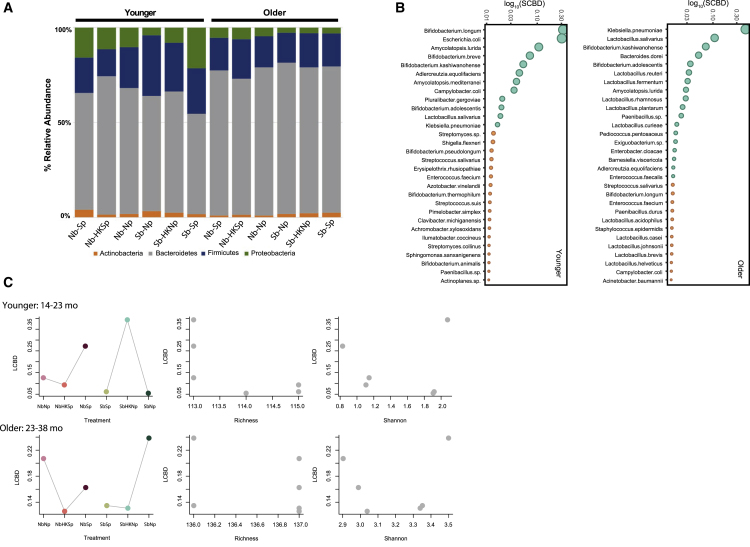
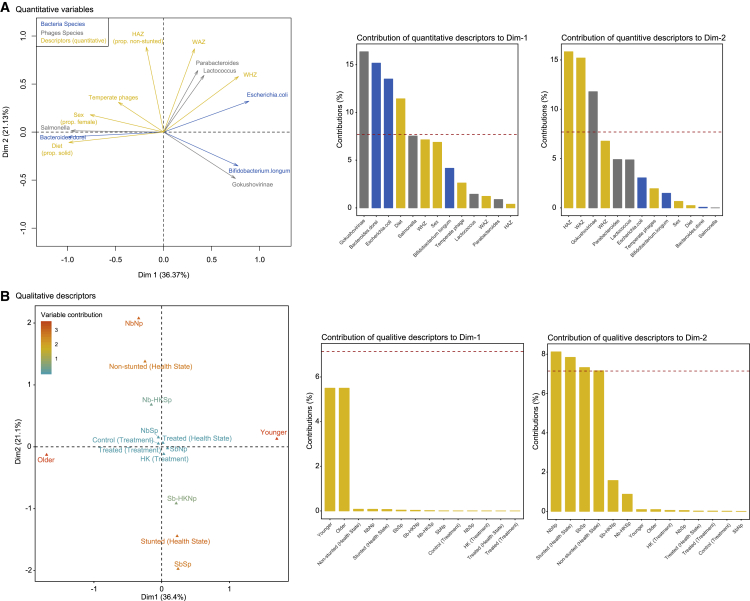
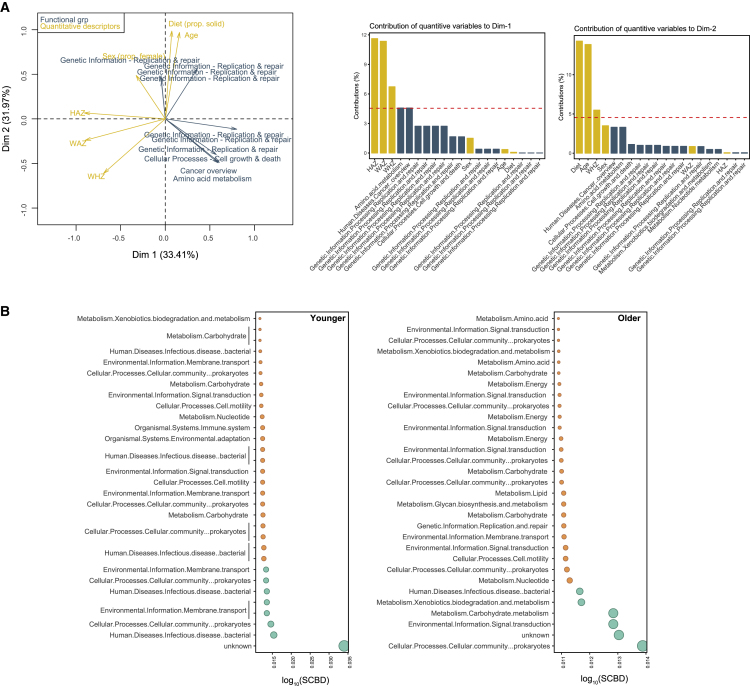
Stunting, a severe and multigenerational growth impairment, globally affects 22% of children under the age of 5 years. Stunted children have altered gut bacterial communities with higher proportions of Proteobacteria, a phylum with several known human pathogens. Despite the links between an altered gut microbiota and stunting, the role of bacteriophages, highly abundant bacterial viruses, is unknown. Here, we describe the gut bacterial and bacteriophage communities of Bangladeshi stunted children younger than 38 months. We show that these children harbor distinct gut bacteriophages relative to their non-stunted counterparts. In vitro, these gut bacteriophages are infectious and can regulate bacterial abundance and composition in an age-specific manner, highlighting their possible role in the pathophysiology of child stunting. Specifically, Proteobacteria from non-stunted children increased in the presence of phages from younger stunted children, suggesting that phages could contribute to the bacterial community changes observed in child stunting.

Keywords: bacteria-phage interactions; bacteriophages; child stunting; gut microbiome; metagenomics; phage infection.


Conflict of interest statement

Declaration of Interests The authors declare no competing interests.

Figures

None
Graphical abstract
Figure 1
Figure 1
Bacterial Communities Are Less Diversified in Younger, Stunted Children Relative abundance of bacterial phyla based on 16S analysis (A) and species based on shotgun metagenomics (B) in children’s fecal samples (n = 60). Samples were pooled for sequencing (see STAR Methods). Children in the younger age group were aged between 14 and 23 months; children in the older age group were aged between 23 and 38 months. Shannon Diversity Index was compared among (C) age groups according to health status, and (D) HAZ scores according to age groups. See also Figures S2 and S3.
Figure 2
Figure 2
Non-stunted and Stunted Children Harbor Many Pathogenic E. coli Strains (A) Relative abundance of known pathogenic species of Proteobacteria. (B) Relative abundance of pathogenic and non-pathogenic E. coli strains. (C and D) Z scores of the abundance of E. coli strains in children from the younger (C) and older (D) age groups. When present, error bars correspond to the standard deviation of bacterial abundances.
Figure 3
Figure 3
Phage Community Composition and Diversity Indices Change with Age and Health Relative abundance of phage species in all fecal samples. Samples were pooled for sequencing (see STAR Methods). Relative abundance of (A) phage families, (B) phage species, and (C) abundance of temperate phages presented as Z score. Shannon diversity in fecal samples of children was compared among (D) age groups according to health status, and (E) HAZ scores according to age groups. See also Figure S2.
Figure 4
Figure 4
Virus-to-Bacteria Ratios Change after Cross-Infections in an Age-Specific Manner Violin plots of whole community bacterial and VLP abundances in children from the younger (A–C) and older (D–F) age groups prior and post cross-infections. (A and D) Virus-to-bacteria ratios; (B and E) bacterial abundances by epifluorescence microscopy; (C and F) abundance of VLPs by epifluorescence microscopy. Bars connected by the same letter are not significantly different (p < 0.05, one-way ANOVA, Holm-Sidak’s multiple comparisons test). ND, not detected; N, non-stunted; S, stunted; b, bacteria; p, phage; HK, heat killed. The width of the plots reflects the data frequency distribution; dotted lines show the median and lower and upper quartiles.
Figure 5
Figure 5
Phage Communities Alter Bacterial Diversity in an Age-Specific Manner (A) Relative abundance of bacterial phyla after cross-infections in both age groups (B) Bacterial species contribution to β-diversity (SCBD) in younger (left) and older (right) children. Shown are the top 30 species with greatest SCBD values for each age group, where green points correspond to species with SCBD values greater than the mean SCBD values of all species (n = 179 species total). (C) Relationship between local contribution of samples to bacterial β-diversity (LCBD) and diversity indices after cross-infections for the younger (top) and the older age groups (bottom). Graphs 1 and 4 correspond to LCBD versus treatment type, where cross-infection samples with non-stunted bacteria are shown in red, and those with stunted bacteria are in green. Graphs 2 and 5 correspond to LCBD versus species richness. Graphs 3 and 6 correspond to LCBD versus Shannon evenness. See also Figures S4 and S5.
Figure 6
Figure 6
Multiple Factor Analysis of the Dominant Bacterial Species, Phage Species, Phage Replication Cycle, and Children Metadata for Both Age Groups Dominant bacterial and phage species shown were selected using a PCA and the contribution circle from the cleanplot.pca() function. (A) MFA ordination of quantitative variables, with the contribution of each qualitative variable to dimensions 1 and 2 of the MFA as insets. (B) MFA ordination of qualitative variables. Quantitative variables include milk feed, age, sex, HAZ, WAZ, and WHZ; qualitative variables include health status, treatment type, and treatment factor. The Hellinger transformation of the bacterial and phage data, and the standardized values for the temperate replication cycle are presented. Quantitative children metadata was scaled. See also Figures S6 and S7.
Figure 7
Figure 7
MFA of the Interactions between Bacterial Functional Traits and Metadata (A) MFA ordination of dominant quantitative variables, with the contribution of each quantitative variable to dimensions 1 and 2 of the MFA as insets. Quantitative variables are as in Figure 6. Functional traits are expressed as relative abundances to normalize for the total number of reads per sample. (B) Functional trait contribution to β-diversity (SCBD), based on KEGG metabolic pathway abundances, for younger (left) and older (right) children. Shown are the top 30 traits with greatest SCBD values for each age group, where green points correspond to traits with SCBD values that are greater than the mean SCBD values of all traits (n = 8 and 6 for younger and older children, respectively). See also Figure S8.

Comment in

Similar articles

Cited by

References

    1. Abedon S.T., Herschler T.D., Stopar D. Bacteriophage latent-period evolution as a response to resource availability. Appl. Environ. Microbiol. 2001;67:4233–4241. - PMC - PubMed
    1. Ahmed T., Mahfuz M., Islam M.M., Mondal D., Hossain M.I., Ahmed A.S., Tofail F., Gaffar S.A., Haque R., Guerrant R.L., Petri W.A. The MAL-ED cohort study in Mirpur, Bangladesh. Clin. Infect. Dis. 2014;59:S280–S286. - PubMed
    1. Bhowmik K.R., Das S. On exploring and ranking risk factors of child malnutrition in Bangladesh using multiple classification analysis. BMC Nutr. 2017;3:73. - PMC - PubMed
    1. Blanton L.V., Charbonneau M.R., Salih T., Barratt M.J., Venkatesh S., Ilkaveya O., Subramanian S., Manary M.J., Trehan I., Jorgensen J.M. Gut bacteria that prevent growth impairments transmitted by microbiota from malnourished children. Science. 2016;351:aad3311. - PMC - PubMed
    1. Borcard D., Gillet F., Legendre P. Second Edition. Springer; 2018. Numerical Ecology with R (Use R!) pp. 1–300.

Publication types

MeSH terms

Substances