. 2020 Apr 15;80(8):1748-1761.
doi: 10.1158/0008-5472.CAN-19-1999. Epub 2020 Feb 13.

Adipocyte-Induced FABP4 Expression in Ovarian Cancer Cells Promotes Metastasis and Mediates Carboplatin Resistance

Affiliations

Adipocyte-Induced FABP4 Expression in Ovarian Cancer Cells Promotes Metastasis and Mediates Carboplatin Resistance

Abir Mukherjee et al. Cancer Res. .

Abstract

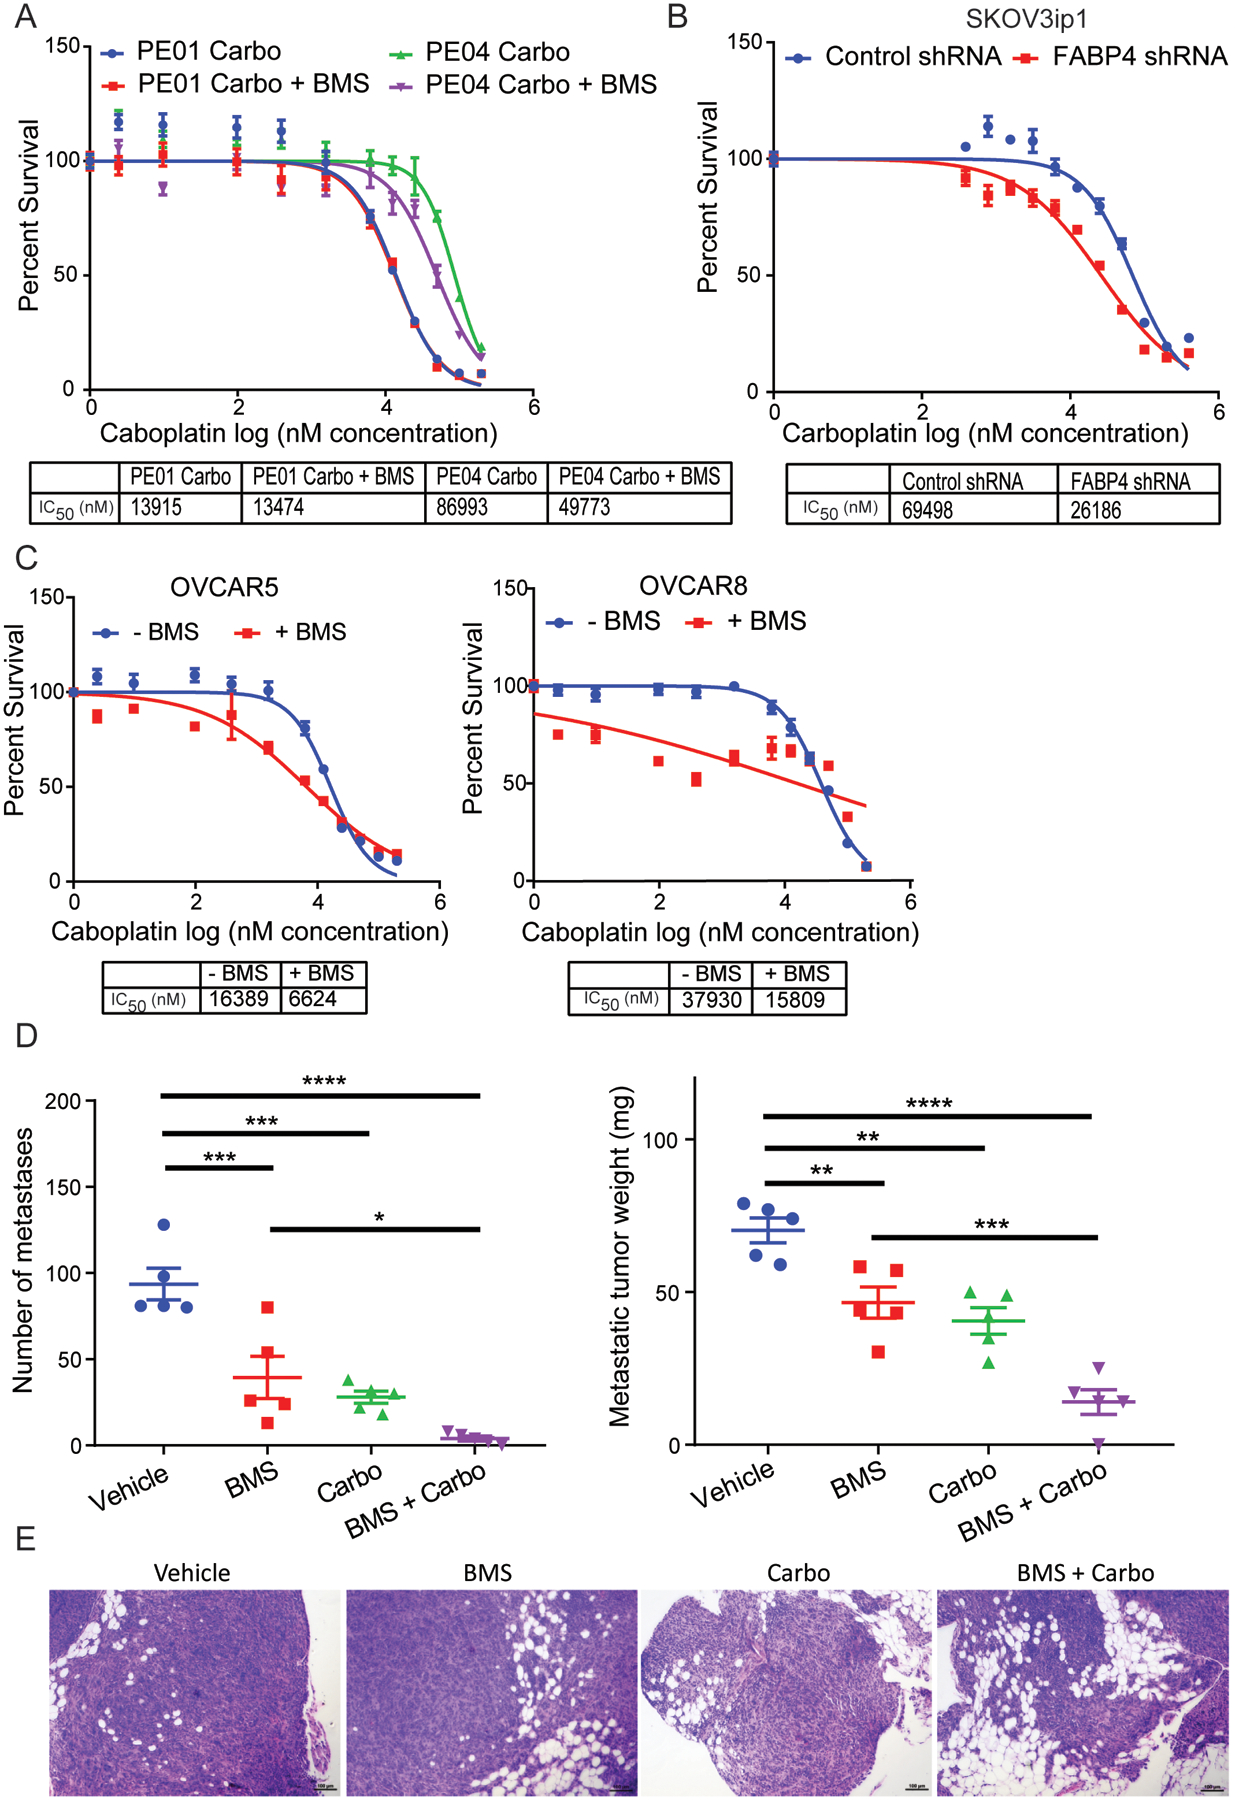
Adipocytes are critical for ovarian cancer cells to home to the omentum, but the metabolic changes initiated by this interaction are unknown. To this end, we carried out unbiased mass spectrometry-based metabolomic and proteomic profiling of cancer cells cocultured with primary human omental adipocytes. Cancer cells underwent significant proteo-metabolomic alteration(s), typified by changes in the lipidome with corresponding upregulation of lipid metabolism proteins. FABP4, a lipid chaperone protein, was identified as the critical regulator of lipid responses in ovarian cancer cells cocultured with adipocytes. Subsequently, knockdown of FABP4 resulted in increased 5-hydroxymethylcytosine levels in the DNA, downregulation of gene signatures associated with ovarian cancer metastasis, and reduced clonogenic cancer cell survival. In addition, clustered regularly interspaced short palindromic repeats (CRISPR)-mediated knockout of FABP4 in high-grade serous ovarian cancer cells reduced metastatic tumor burden in mice. Consequently, a small-molecule inhibitor of FABP4 (BMS309403) not only significantly reduced tumor burden in a syngeneic orthotopic mouse model but also increased the sensitivity of cancer cells toward carboplatin both in vitro and in vivo. Taken together, these results show that targeting FABP4 in ovarian cancer cells can inhibit their ability to adapt and colonize lipid-rich tumor microenvironments, providing an opportunity for specific metabolic targeting of ovarian cancer metastasis. SIGNIFICANCE: Ovarian cancer metastatic progression can be restricted by targeting a critical regulator of lipid responses, FABP4.


Conflict of interest statement

Conflict of interest statement: The authors declare the following potential conflicts of interest. Kristin Nieman and Ernst Lengyel hold a patent for treating ovarian cancer by inhibiting fatty acid binding proteins.

Figures

Figure 1.
Figure 1.. Adipocytes changes global cancer cell metabolism
Untargeted metabolomics of cancer cells co-cultured with human primary adipocytes (HPA) using GC-MS and LC-MS. The bar graphs show scaled intensity values of altered fatty acids (A) and oxylipins (B) in SKOV3ip1 cells alone (- Adi) or with adipocyte co-culture (+ Adi) for 4hr (left) and 18hr (right). (C) Reactive oxygen species. Flow cytometry analysis of SKOV3ip1 cells stained with CellROX Deep Red reagent after treatment with adipocyte-conditioned media (Adi CM). (D) Relative malondialdehyde (MDA) levels in cancer cells co-cultured with HPA. For A-D a paired t-test was performed. Bar graphs depict mean +/− SEM (* p < 0.05, ** p < 0.01, *** p < 0.001, **** p< 0.0001). (E) Immunohistochemistry for 4- hydroxynonenal (4HNE) adducts. Human omental metastasis from patients with high-grade serous ovarian cancer were stained. Adipocytes in the section are labeled as “A”. Scale bar = 100 μm.
Figure 2.
Figure 2.. Proteomics identifies FABP4 and CD36 upregulation after co-culture with adipocytes
Mass spectrometry-based proteomic analysis of SKOV3ip1 cells co-cultured with HPA. (A) Volcano plot of pairwise comparison between cancer cells alone or in co-culture with HPA (4hr). Fold changes (t-test difference, log2) were calculated and plotted against t-test p-value (-log10). Upregulated proteins are labeled in red while downregulated proteins are labeled in green. (B) Immunohistochemistry for CD36, FABP4, and ADH1B proteins using serial sections of human omental metastasis from 4 patients with high grade serous ovarian cancer. Scale bar = 100 μm. (C) Western blot. SKOV3ip1 cells were co-cultured with adipocytes and expression of CD36, and FABP4 detected by immunoblotting. (D-E) Cells with stable knockdown of CD36 (D), and FABP4 (E) were treated with adipocyte conditioned media (Adi CM) for 24hr, and western blot carried out for the indicated proteins. Scale bar = 100 μm.
Figure 3.
Figure 3.. FABP4 regulates global lipid metabolism
(A) Global metabolomics. SKOV3ip1 cells with stable knocked down of FABP4 were cultured ± adipocytes. After 18 hr metabolites were extracted and global untargeted metabolomics performed using GC-MS and LC-MS. Increased metabolites are represented in red while reduced are green. PC- phosphatidylcholine, PE- phosphatidylethanolamine, SM- sphingomyelin, TG- triacylglycerol. (B-D) SKOV3ip1 FABP4 knock down cells were cultured ± adipocytes and (B) fatty acid oxidation determined by generation of 3H2O, (C) Reactive oxygen species (ROS) estimated using flow cytometry, and (D) lipid peroxidation determined by measuring malondialdehyde (MDA) levels. (E) MTT assay. Proliferation of OvCa cells cultured ± adipocytes and concomitant treatment of N-acetyl cysteine (0.5mM), and etomoxir (50μM) for 72hr (** p < 0.01, *** p < 0.001, **** p < 0.0001).
Figure 4.
Figure 4.. Loss of FABP4 increases glucose oxidation
(A) TCA cycle metabolites. Relative levels of glycolytic and TCA cycle metabolites were pulled out from the untargeted metabolomics data in Fig. 3A, where SKOV3ip1 FABP4 knock down cells, were cultured with adipocytes. (B, D) Oxygen consumption rate (OCR) as a measure of mitochondrial glucose oxidation, (Seahorse XFe96), in cells with ectopic expression (B) and stable knock down (D) of FABP4. (C, E) Extracellular acidification rate (ECAR), as a measure of glycolysis after ectopic expression (C) and knock down (E) of FABP4. (F) Estimation of glycolysis-derived versus mitochondrial-derived ATP generation in FABP4 knock down cells co-cultured with adipocytes (Seahorse XFe96). (G) Cell cycle analysis. SKOV3ip1 with stable knockdown of FABP4 was cultured with adipocytes for 48hr, stained with propidium iodide and the cell cycle profile determined by flow cytometry. Percent of cells in each phase of the cell cycle were quantitated and plotted. (H) DNA dot blot to determine changes in 5-hydroxymethylcytosine (5-hmc) levels in FABP4 knockdown SKOV3ip1 cultured with adipocytes for 48hr. Bars are means ± SEM (* p < 0.05, ** p < 0.01, *** p < 0.0005, **** p < 0.0001).
Figure 5.
Figure 5.. FABP4 promotes proliferation and in vivo metastasis
(A) Ingenuity Pathway Analysis. Microarray analysis of FABP4 knock down SKOV3ip1 cells (control, scrambled shRNA) was performed (Illumina) and differentially expressed genes entered into pathway analysis software. Shown is the regulator effect analysis describing upstream signaling and downstream processes. (B) Colony formation assays after stable knock down of FABP4 in SKOV3ip1, and OVCAR5, parental cells. (C) Intraperitoneal xenograft tumor formation in nude mice using CRISPR knockout clones of FABP4 in OVCAR8 cells. Yellow lines highlight omental tumor, while black and green rectangles represent peritoneal and mesenteric metastasis, respectively. Number of metastasis and total weight of all metastases are shown (mean ± SEM). (D) Immunohistochemistry for 5-hydroxymethylcytosine (5-hmc) carried out on omental mouse tumors represented in panel C (mean ± SEM). Scale bar 100 μm (** p < .005, *** p ≤ 0.001, **** p < 0.0001).
Figure 6.
Figure 6.. A small molecule inhibitor of FABP4 reduces ovarian cancer metastasis
(A) Cell cycle analysis. Skov3ip1 cells were treated with the FABP4 inhibitor (BMS309403) for 24hr, stained using propidium iodide solution and cell cycle analysis carried out using flow cytometry. A representative cell cycle profile and percent cells in each phase of the cell cycle were quantitated and plotted. (B) Ex-vivo omental assay. GFP labeled HeyA8 and SKOV3ip1 cells were cultured with fresh human omental tissue in the presence or absence of 50 μM of the FABP4 inhibitor BMS309403 (72hr). Representative images of omental explants per treatment groups shown (left) and fluorescence intensity quantitated (right). (C) Syngeneic orthotopic mouse model. ID8 mouse ovarian cancer cells were injected intra-bursally and treated with BMS309403 (15 mice) or vehicle control (16 mice). The number of metastasis and tumor weights were measured and plotted as mean ± SEM. (D) Representative H&E stained mouse omental tumors from each group. Adipocyte labelled as “A”, and cancer regions as “C”. Scale bar 500 μm (* p < 0.05, ** p < 0.005 and *** p < 0.001).
Figure 7.
Figure 7.. FABP4 sensitizes cancer cells to carboplatin chemotherapy
MTT assay and subsequent IC50 analysis were carried out for the following: (A) paired ovarian cancer cell lines PE01 (platinum sensitive) and PE04 (platinum resistant) treated once with different concentrations of carboplatin ± 20 μM BMS309403 and measured 72 hr later. (B) FABP4 shRNA transduced SKOV3ip1 cells and control shRNA were treated with serial dilutions of carboplatin. (C) The indicated ovarian cancer cell lines were treated once with serial dilutions of carboplatin ± 20 μM BMS309403 (D) Xenograft mouse model. Female mice (n=20) were injected intraperitoneally (IP) with 5 million ID8 mouse ovarian cancer cells and mice randomly assigned into 4 groups (n=5/group). After 40 days mice were treated with either carboplatin (30 mg/kg) or BMS309403 (20 mg/kg) or with both drugs for an additional 26 days (66 days total) and metastatic burden compared with the BMS vehicle group. Total number of metastasis (left) and metastatic weight (right) were recorded (mean ± SEM). ANOVA analysis was carried out to determine statistical significance between the groups (BMS – BMS309403, Carbo – Carboplatin, **** p ≤ 0.0001, ***p ≤ 0.001, **p ≤ 0.01, *p ≤ 0.05). (E) Representative H&E stained omental tumors from each group from (D). Scale bar 100 μm.

References

    1. Lengyel E Ovarian cancer development and metastasis. Am J Pathol 2010;177:1053–64 - PMC - PubMed
    1. Bowtell DD, Bohm S, Ahmed AA, Aspuria PJ, Bast RC Jr., Beral V, et al. Rethinking ovarian cancer II: Reducing mortality from high-grade serous ovarian cancer. Nat Rev Cancer 2015;15:668–79 - PMC - PubMed
    1. Nieman KM, Kenny HA, Penicka CV, Ladanyi A, Buell-Gutbrod R, Zillhardt MR, et al. Adipocytes promote ovarian cancer metastasis and provide energy for rapid tumor growth. Nat Med 2011;17:1498–503 - PMC - PubMed
    1. Pradeep S, Kim SW, Wu SY, Nishimura M, Chaluvally-Raghavan P, Miyake T, et al. Hematogenous metastasis of ovarian cancer: Rethinking mode of spread. Cancer Cell 2014;26:77–91 - PMC - PubMed
    1. Eckert MA, Pan S, Hernandez KM, Loth RM, Andrade J, Volchenboum SL, et al. Genomics of ovarian cancer progression reveals diverse metastatic trajectories including intraepithelial metastasis to the fallopian tube. Cancer Discov 2016;6:1342–51 - PMC - PubMed

Publication types

MeSH terms