. 2020 Feb 13;11(1):866.
doi: 10.1038/s41467-020-14667-5.

Inference and effects of barcode multiplets in droplet-based single-cell assays

Affiliations

Inference and effects of barcode multiplets in droplet-based single-cell assays

Caleb A Lareau et al. Nat Commun. .

Abstract

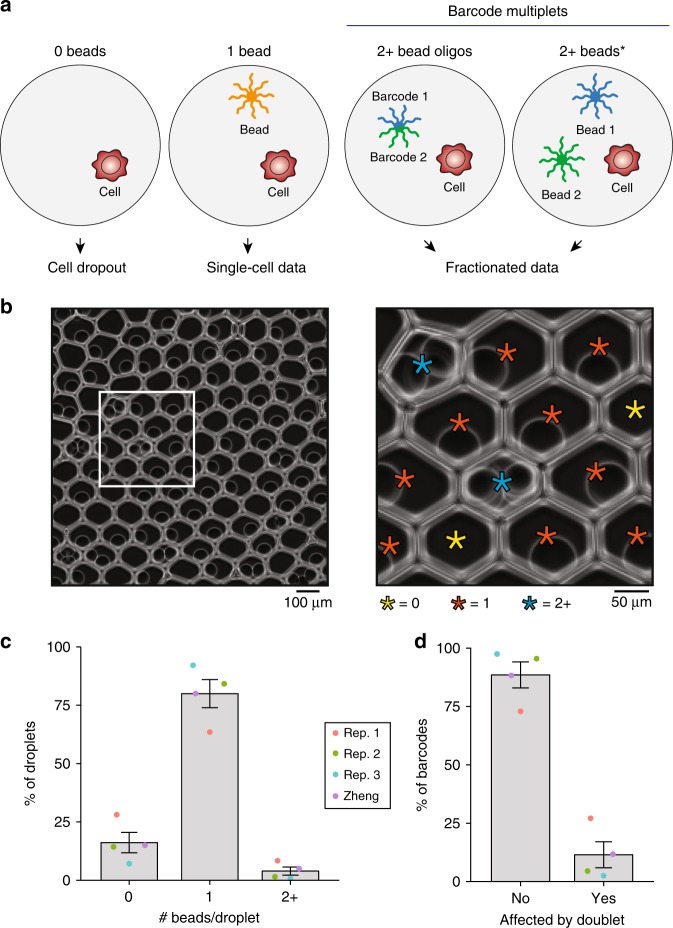
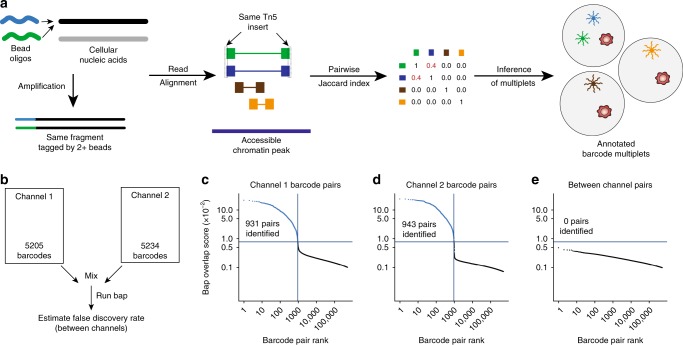
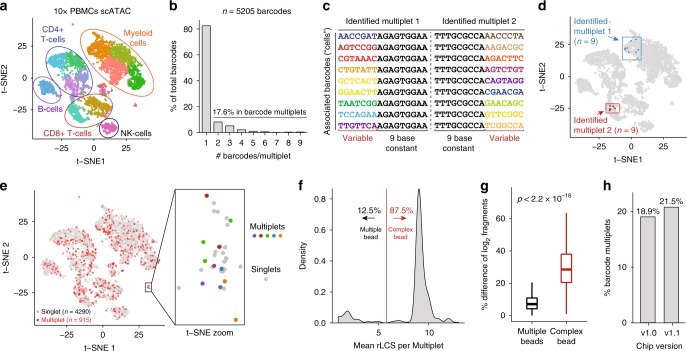
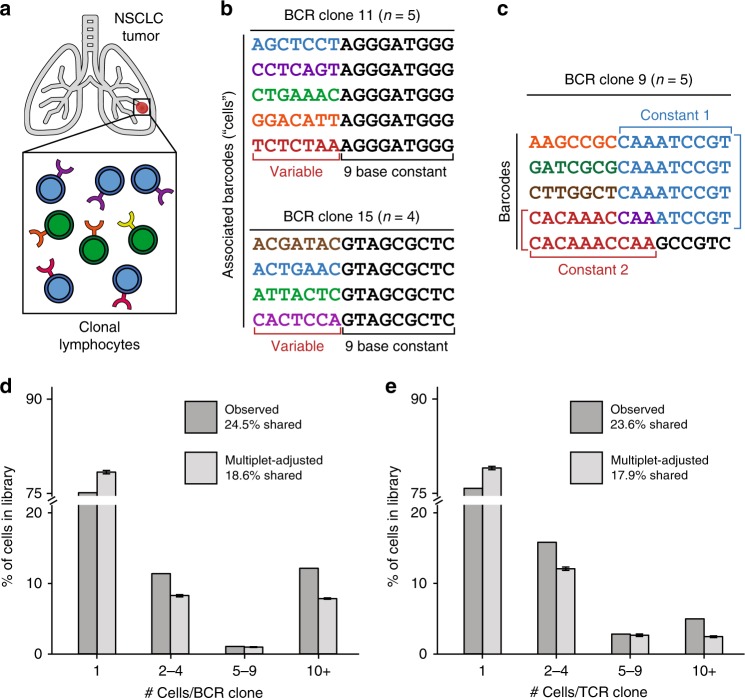
A widespread assumption for single-cell analyses specifies that one cell's nucleic acids are predominantly captured by one oligonucleotide barcode. Here, we show that ~13-21% of cell barcodes from the 10x Chromium scATAC-seq assay may have been derived from a droplet with more than one oligonucleotide sequence, which we call "barcode multiplets". We demonstrate that barcode multiplets can be derived from at least two different sources. First, we confirm that approximately 4% of droplets from the 10x platform may contain multiple beads. Additionally, we find that approximately 5% of beads may contain detectable levels of multiple oligonucleotide barcodes. We show that this artifact can confound single-cell analyses, including the interpretation of clonal diversity and proliferation of intra-tumor lymphocytes. Overall, our work provides a conceptual and computational framework to identify and assess the impacts of barcode multiplets in single-cell data.


Conflict of interest statement

The authors declare the following competing interests: J.D.B. holds patents related to ATAC-seq. All other authors declare no competing interests.

Figures

Fig. 1
Fig. 1. Quantification of barcode multiplets from multiple beads in 10× Chromium platform.
a Schematic of bead loading variation and phenotypic consequences. Droplets with 0 beads fail to profile nucleic acid from the loaded cell (“dropout”) whereas barcode multiplets fractionate the single-cell data. Barcode multiplets can be generated by either heterogeneous barcodes on an individual bead or two or more beads loaded into the same droplet. The * indicates the bead multiplet that can be quantified via imaging. b Representative example of beads loaded into droplets from the 10× Chromium platform. The white box is magnified 3× for the panel on the right, revealing multiple beads loaded into droplets. Stars indicate beads (except 0) and are colored by the number of beads contained in the droplet. The image is representative of a total of 30 fields of view taken from three independent experiments. c Empirical quantification of number of bead barcodes based on image analysis over 3 replicates with previously published data (Zheng et al.). d Percent of barcodes associated with multiplets under the distribution observed in c. Error bars represent standard error of mean over the experimental replicates. Source data are available in the Source Data file.
Fig. 2
Fig. 2. Verification of bap to identify barcode multiplets using 10× scATAC-seq data.
a Schematics of methodology to detect barcode multiplets whereby cellular nucleic acids are tagged by two different oligonucleotide sequences and later inferred from sequencing a scATAC-seq library from the same Tn5 insertions per fragment. b Schematic of mixing experiment. Two channels were combined and the resulting merged files were analyzed with bap. ce Knee plots comparing the top 500,000 barcode pairs from c only channel 1, d only channel 2, and e between channels. The number of pairs calls is indicated by the number of points above the blue horizontal line (see Methods section).
Fig. 3
Fig. 3. Inference and effect of barcode multiplets in single-cell ATAC-seq data.
a Default t-SNE depiction of public scATAC-seq PBMC 5k dataset. Colors represent cluster annotations from the automated CellRanger output. b Quantification of barcodes affected by barcode multiplets for the same dataset (identified by bap). c Depiction of two multiplets each composed of 9 oligonucleotide barcodes. Barcodes in each multiplet share a long common subsequence, denoted in black. d Visualization of two barcode multiplets from c in t-SNE coordinates. e Visualization of all implicated barcode multiplets from this dataset. The zoomed panel shows a small group of cells affected by five multiplets, indicated by color. f Empirical distribution of the mean restricted longest common subsequence (rLCS) per multiplet. A cutoff of 6 was used to determine either of the two classes of barcode multiplets. g Percent difference of the mean log2 fragments between pairs of barcodes within a multiplet. The reported p-value is from a two-sided Kolmogorov–Smirnov test. The exact p-value is lower than machine precision. Analysis represents n = 5205 barcodes over 1 experimental replicate. Boxplots: center line, median; box limits, first and third quartiles; whiskers, 1.5× interquartile range. h Overall rates of barcode multiplets from additional scATAC-seq data comparing v1.0 and v1.1 (NextGEM) chip designs. Source data are available in the Source Data file.
Fig. 4
Fig. 4. Confounding of intratumor clonal lymphocytes inference from barcode multiplets.
a Schematic of intra-tumor lymphocytes identified from single-cell V(D)J sequencing on the 10× platform. b Identification of two presumed clonotypes composed of five and four barcodes. These clonotypes are likely to have been derived from one cell observed multiple times via barcode multiplets. c Example of a presumed clone composed of five barcodes with multiple constant sequences. d, e Overall summary of prevalence of d B-cell and e T-cell clone size before and after adjusting for observed rates of barcode multiplets in single-cell data. Error bars represent standard errors of the mean across n = 100 independent permutations from one experimental dataset per receptor sequence. Source data are available in the Source Data file.

References

    1. Klein AM, Macosko E. InDrops and Drop-seq technologies for single-cell sequencing. Lab Chip. 2017;17:2540–2541. doi: 10.1039/C7LC90070H. - DOI - PubMed
    1. Zheng GXY, et al. Massively parallel digital transcriptional profiling of single cells. Nat. Commun. 2017;8:14049. doi: 10.1038/ncomms14049. - DOI - PMC - PubMed
    1. Lareau CA, et al. Droplet-based combinatorial indexing for massive-scale single-cell chromatin accessibility. Nat. Biotechnol. 2019;8:916–924. doi: 10.1038/s41587-019-0147-6. - DOI - PMC - PubMed
    1. Satpathy AT, Granja JM, Yost KE, Qi Y, Meschi F. Massively parallel single-cell chromatin landscapes of human immune cell development and intratumoral T cell exhaustion. Nat. Biotechnol. 2019;8:925–936. doi: 10.1038/s41587-019-0206-z. - DOI - PMC - PubMed
    1. Abate AR, Chen C-H, Agresti JJ, Weitz DA. Beating Poisson encapsulation statistics using close-packed ordering. Lab Chip. 2009;9:2628–2631. doi: 10.1039/b909386a. - DOI - PubMed

Publication types

MeSH terms