. 2020 Feb 13;10(1):2527.
doi: 10.1038/s41598-020-59221-x.

Modeling membrane nanotube morphology: the role of heterogeneity in composition and material properties

Affiliations

Modeling membrane nanotube morphology: the role of heterogeneity in composition and material properties

Haleh Alimohamadi et al. Sci Rep. .

Abstract

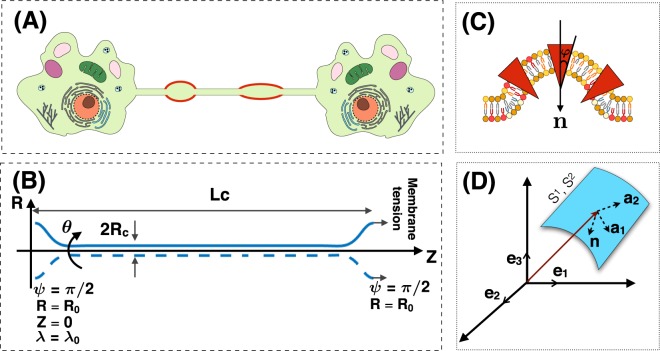
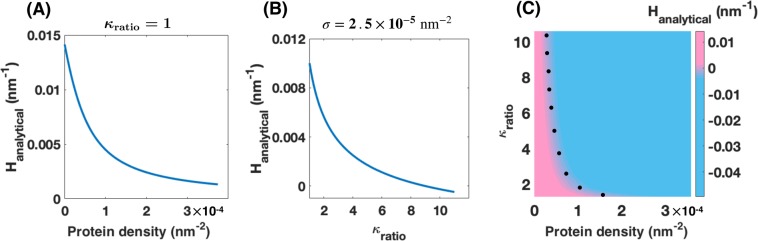
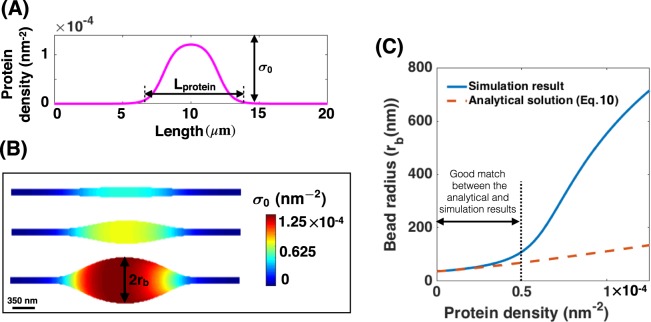
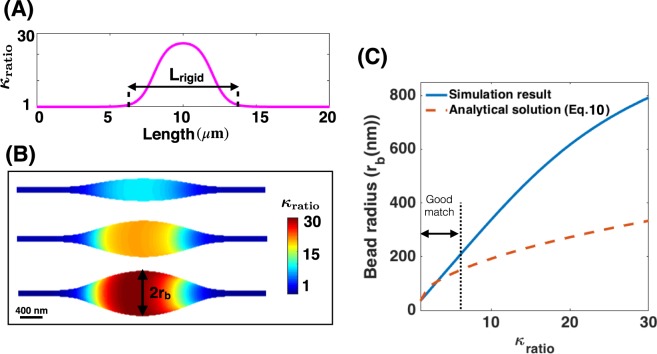
Membrane nanotubes are dynamic structures that may connect cells over long distances. Nanotubes are typically thin cylindrical tubes, but they may occasionally have a beaded architecture along the tube. In this paper, we study the role of membrane mechanics in governing the architecture of these tubes and show that the formation of bead-like structures along the nanotubes can result from local heterogeneities in the membrane either due to protein aggregation or due to membrane composition. We present numerical results that predict how membrane properties, protein density, and local tension compete to create a phase space that governs the morphology of a nanotube. We also find that there exists a discontinuity in the energy that impedes two beads from fusing. These results suggest that the membrane-protein interaction, membrane composition, and membrane tension closely govern the tube radius, number of beads, and the bead morphology.


Conflict of interest statement

The authors declare no competing interests.

Figures

Figure 1
Figure 1
(A) A cartoon showing an intercellular membrane nanotube with local bead-shaped deformations due to membrane-protein interactions (red domain). (B) Axisymmetric coordinates along the membrane nanotube and the boundary conditions used in simulations. Lc represents the length and Rc represents the radius of the nanotube. (C) A schematic depicting membrane-protein interactions that could lead to the formation of beads along a nanotube. Proteins (shown in red) can aggregate along the membrane to induce local curvature and heterogeneous tension. We assume these proteins are cone-shaped such that their meridian makes an angle φ (φ < 0) with the normal vector (n) to the surface. (D) The coordinate system used to define a surface by the tangent basis a1, a2 and the normal vector n. Note that the normal is pointing downwards in this case.
Figure 2
Figure 2
Analytical mean curvature along the protein-enriched (Eq. 7) domain as a function of the protein density (σ) and bending rigidity ratio (κratio). (A) With increasing the protein density, the mean curvature along the protein aggregation domain decreases (κratio=1). (B) Decrease in the mean curvature of the protein-enriched domain as the bending rigidity ratio increases (σ=2.5×10⁵nm5). (C) Heat map shows the analytical mean curvature along the protein-enriched domain (Eq. 8) as a function of the protein density and bending rigidity ratio. The sign of the analytical mean curvature changes from positive to negative along the dotted black line.
Figure 3
Figure 3
Protein-mediated bead formation along a membrane nanotube. (A) Protein density distribution on the membrane surface in which Lprotein=8μm shows the length of the protein-enriched domain and σ0 represents the number of the proteins per unit area. (B) The formation of a large bead-shaped structure along the membrane nanotube as the density of proteins (σ0) increases for λ0=0.064pN/nm and uniform bending rigidity. The scale bar in panel (B) is 350 nm. (C) Bead radius (rb) increases as a function of the protein density for both the analytical solution (Eq. 10) (dashed red line) and the simulation result (solid blue line).
Figure 4
Figure 4
Heterogeneous membrane properties result in the formation of local bead-shaped structures. (A) Bending modulus variation along the length of the nanotube. κratio is the bending rigidity ratio of the rigid protein domain compared to that of the bare lipid membrane (κratio=κrigid/κlipid) and Lrigid represents the length of the rigid protein domain (Lrigid=8μm). (B) Membrane deformation in the region of large bending rigidity resembles a local bead formation phenomenon; the tension at the boundary is set as λ0=0.064pN/nm and the protein density is fixed to be constant as σ0=1.25×10⁴nm2 and C = 0. The scale bar in panel (B) is 400 nm. (C) Increase in the radius of the bead as a function of κratio for both the derived analytical solution in Eq. 10 (dashed red line) and the simulation result (solid blue line).
Figure 5
Figure 5
Three different possible shapes of a bead-like structure resulting from the presence of a rigid protein domain. (A) Formation of (i) an ellipsoidal bead (top) at low protein density, (ii) a cylindrical bead (middle) at average protein density, and (iii) an unduloid-shaped bead (bottom) at high protein density; κratio=11. The scale bar in panel A is 2 μm. (B) The mean curvature (H) distribution along the nanotube length for ellipsoidal (blue line), cylindrical (red), and unduloid-shape (green) beads in panel (A). See Fig. S6 for details of the change in the second derivative of H.
Figure 6
Figure 6
Bead morphology depends on the protein density (σ0), the bending rigidity ratio of the protein-enriched domain compared to the lipid membrane (κratio), and the edge membrane tension λ0. (A) Phase diagram for bending rigidity ratio versus the number of proteins per unit area, λ0=0.064pN/nm. The background of the phase diagram shows the log of the ratio of the two induced length scales (lσ1κ). The three different bead shapes can be distinguished by the dominant length scale: (i) ellipsoidal beads when log(lσ1κ)>0 (blue domain), (ii) cylindrical beads when log(lσ1κ)~0 (pink domain), and (iii) unduloid-shaped beads when log(lσ1κ)<0 (green domain). (B) The protein density versus the edge membrane tension λ0 phase diagram for κratio=2. The background of the phase diagram of the log of the lσ1κ for a range of the membrane tension and the protein density. (C) The bending rigidity ratio versus the edge membrane tension λ0 phase diagram for σ0=1.5×10⁴nm2. The background of the phase diagram of the log of the lσ1κ for a range of the membrane tension and the bending rigidity ratio. The colors in panels (B,C) represent the same bead shapes as panel (A).
Figure 7
Figure 7
Multiple beads along a nanotube. (A, top) Protein density distribution with two domains of protein accumulation. The covered length by each protein-enriched domain is Lprotein=8μm and the domains are far from each other (Lseparation=4μm). The number of proteins within each domain increases by the same amount. (A, bottom) Two beads form corresponding to each protein-enriched domain, λ0=0.064pN/nm. (B) The distance between two beads versus the bending rigidity ratio phase diagram with C = 0 and σ0=1.25×10⁴nm2. There are two possible shapes, (i) two separated beads denoted with the color blue, and (ii) one single bead marked by the color red. The transition from two to one bead is smooth everywhere in this parameter space and occurs when Lseparation<2rb (purple line). (C) Membrane profiles for the marked points along the dotted black line in panel (B). (D) Membrane profiles for the black dotted line in panel (E) show the smooth evolution of membrane shape from two beads to one bead at σ0=8.25×10⁵nm2 with decreasing Lseparation (κratio=1). (E) Phase diagram for the distance between two beads versus the protein density at κratio=1. The colors represent the same morphologies as panel (B). When Lseparation<2rb, there is a smooth transition from two beads to one bead at low protein density and a snap-through instability in the transition from two beads to one bead for large protein densities. (F) Membrane profiles show the snap-through transition from two kissing beads to one large bead at σ0=3×10⁴nm2 corresponding to the marked points along the green dashed line in panel (E). (G) Membrane profiles for the black dotted line in panel (H) show the smooth evolution of membrane shape from two beads to one bead at σ0=1.875×10⁵nm2 with decreasing Lseparation setting κratio=4. (H) Phase diagram for the distance between two beads versus the protein density at κratio=4. The colors represent the same morphologies as panel (B). (I) Membrane profiles show the snap-through transition from two kissing beads to one large bead at σ0=3×10⁴nm2 for the green dashed line in panel (H).

References

    1. Rustom A, Saffrich R, Markovic I, Walther P, Gerdes H-H. Nanotubular highways for intercellular organelle transport. Sci. 2004;303:1007–1010. doi: 10.1126/science.1093133. - DOI - PubMed
    1. Davis DM, Sowinski S. Membrane nanotubes: dynamic long-distance connections between animal cells. Nat. Rev. Mol. Cell. Biol. 2008;9:431. doi: 10.1038/nrm2399. - DOI - PubMed
    1. Gerdes H-H, Carvalho RN. Intercellular transfer mediated by tunneling nanotubes. Curr. Opin. Cell. Biol. 2008;20:470–475. doi: 10.1016/j.ceb.2008.03.005. - DOI - PubMed
    1. Onfelt B, Nedvetzki S, Yanagi K, Davis DM. Cutting edge: Membrane nanotubes connect immune cells. J. Immunol. 2004;173:1511–1513. doi: 10.4049/jimmunol.173.3.1511. - DOI - PubMed
    1. Sowinski S, et al. Membrane nanotubes physically connect t cells over long distances presenting a novel route for hiv-1 transmission. Nat. Cell. Biol. 2008;10:211. doi: 10.1038/ncb1682. - DOI - PubMed

Publication types