

Waterfowl occurrence and residence time as indicators of H5 and H7 avian influenza in North American Poultry
- PMID: 32054908
- PMCID: PMC7018751
- DOI: 10.1038/s41598-020-59077-1
Waterfowl occurrence and residence time as indicators of H5 and H7 avian influenza in North American Poultry
Abstract
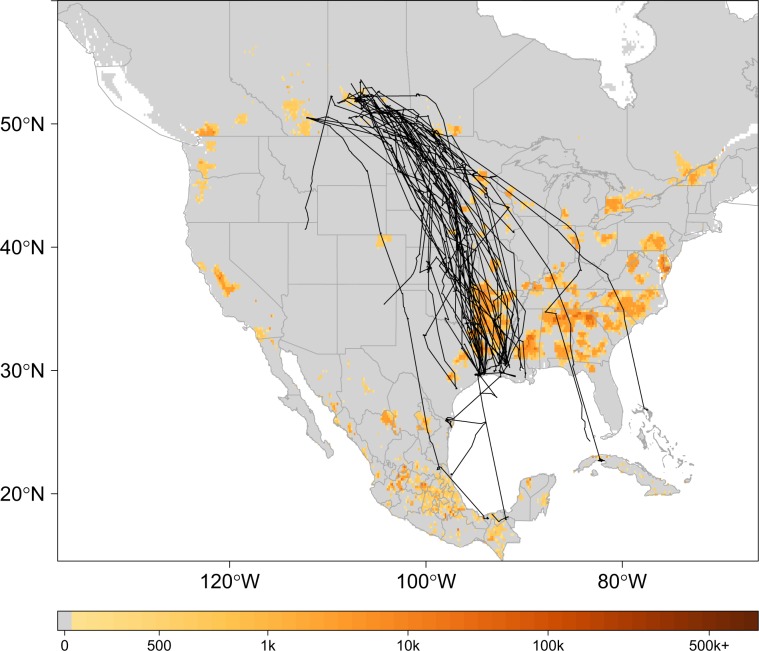
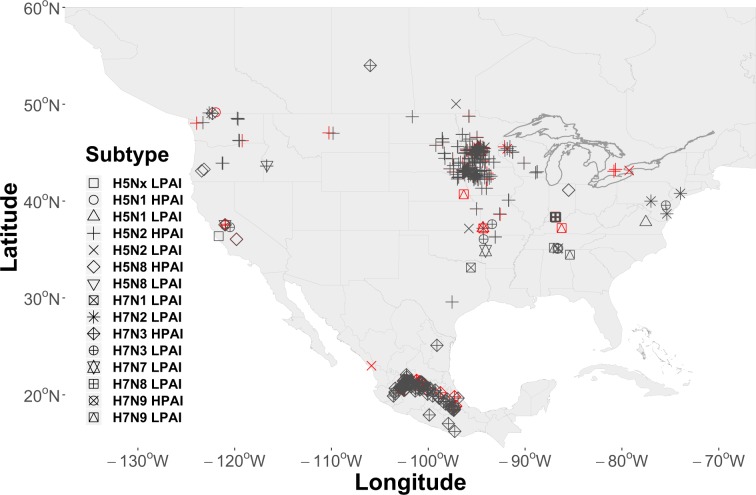
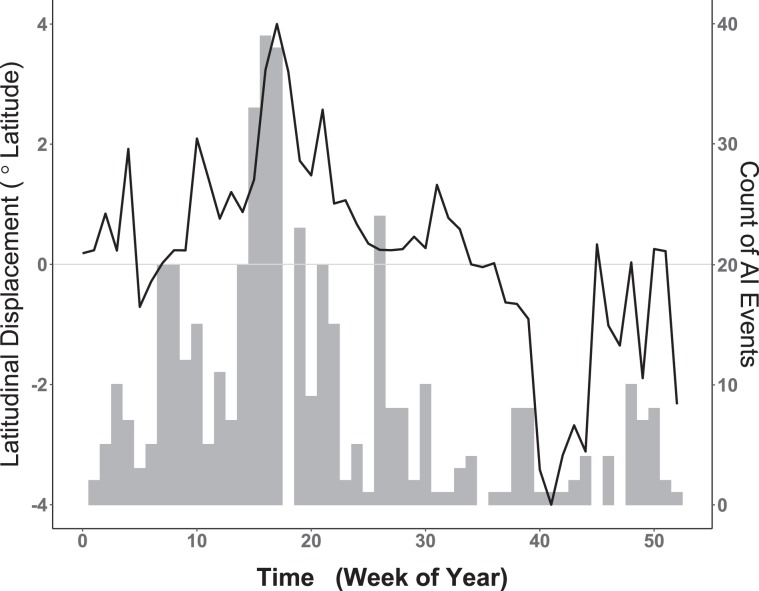
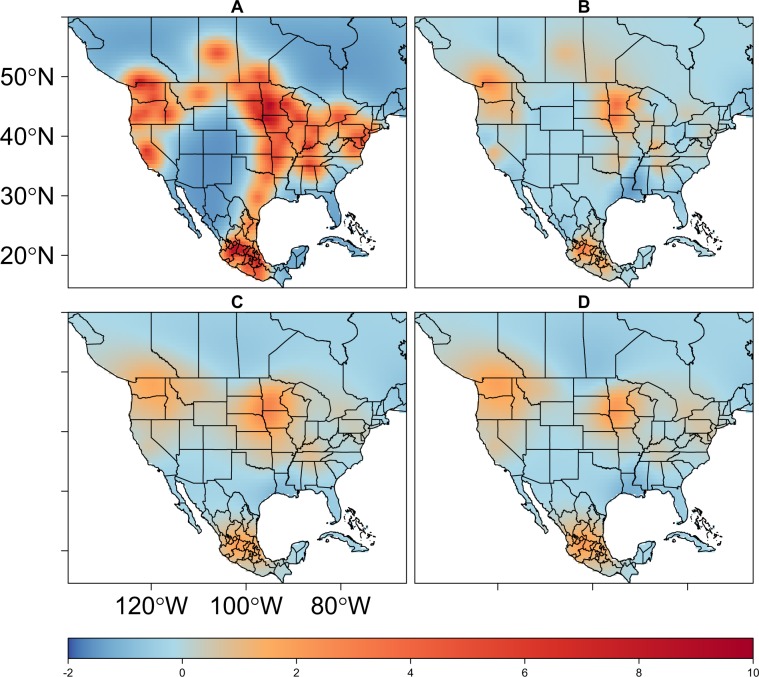
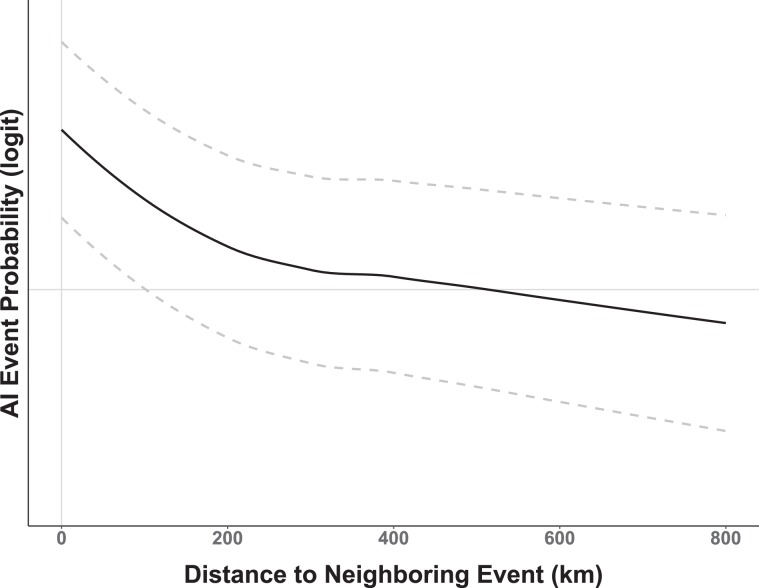
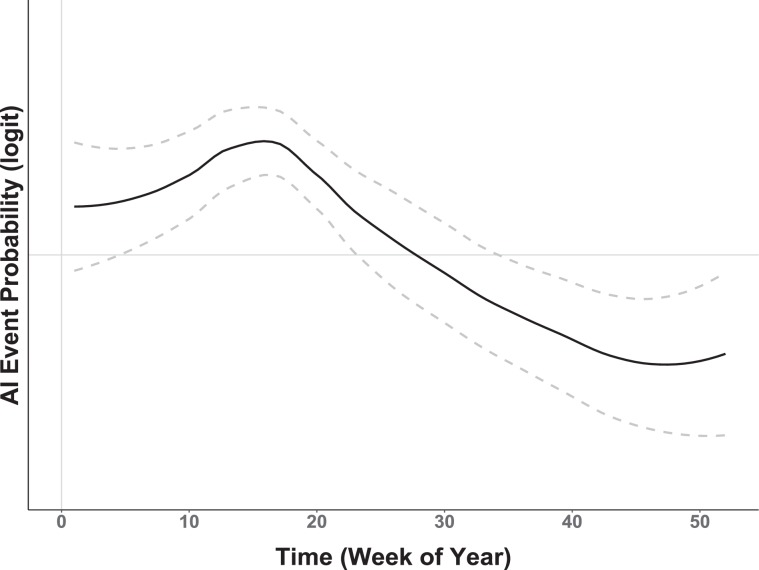
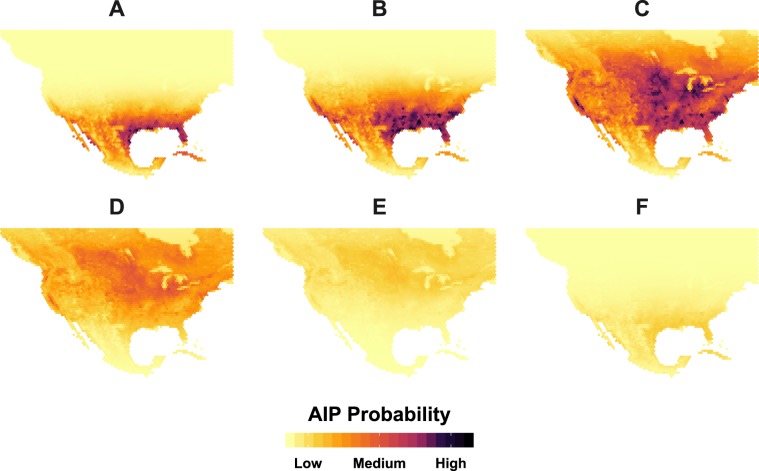
Avian influenza (AI) affects wild aquatic birds and poses hazards to human health, food security, and wildlife conservation globally. Accordingly, there is a recognized need for new methods and tools to help quantify the dynamic interaction between wild bird hosts and commercial poultry. Using satellite-marked waterfowl, we applied Bayesian joint hierarchical modeling to concurrently model species distributions, residency times, migration timing, and disease occurrence probability under an integrated animal movement and disease distribution modeling framework. Our results indicate that migratory waterfowl are positively related to AI occurrence over North America such that as waterfowl occurrence probability or residence time increase at a given location, so too does the chance of a commercial poultry AI outbreak. Analyses also suggest that AI occurrence probability is greatest during our observed waterfowl northward migration, and less during the southward migration. Methodologically, we found that when modeling disparate facets of disease systems at the wildlife-agriculture interface, it is essential that multiscale spatial patterns be addressed to avoid mistakenly inferring a disease process or disease-environment relationship from a pattern evaluated at the improper spatial scale. The study offers important insights into migratory waterfowl ecology and AI disease dynamics that aid in better preparing for future outbreaks.
Conflict of interest statement
The authors declare no competing interests.
Figures
Similar articles
-
A method to identify the areas at risk for the introduction of avian influenza virus into poultry flocks through direct contact with wild ducks.Transbound Emerg Dis. 2018 Aug;65(4):1033-1038. doi: 10.1111/tbed.12838. Epub 2018 Feb 22. Transbound Emerg Dis. 2018. PMID: 29473322
-
Pathogenicity and Transmission of H5 and H7 Highly Pathogenic Avian Influenza Viruses in Mallards.J Virol. 2016 Oct 14;90(21):9967-9982. doi: 10.1128/JVI.01165-16. Print 2016 Nov 1. J Virol. 2016. PMID: 27558429 Free PMC article.
-
Avian influenza surveillance reveals presence of low pathogenic avian influenza viruses in poultry during 2009-2011 in the West Bengal State, India.Virol J. 2012 Aug 7;9:151. doi: 10.1186/1743-422X-9-151. Virol J. 2012. PMID: 22867041 Free PMC article.
-
Impact of avian influenza on U.S. poultry trade relations-2002: H5 or H7 low pathogenic avian influenza.Ann N Y Acad Sci. 2004 Oct;1026:47-53. doi: 10.1196/annals.1307.006. Ann N Y Acad Sci. 2004. PMID: 15604469 Review.
-
Ecology and epidemiology of avian influenza in North and South America.Dev Biol (Basel). 2006;124:37-44. Dev Biol (Basel). 2006. PMID: 16447492 Review.
Cited by
-
A systematic review of laboratory investigations into the pathogenesis of avian influenza viruses in wild avifauna of North America.Proc Biol Sci. 2024 Oct;291(2033):20241845. doi: 10.1098/rspb.2024.1845. Epub 2024 Oct 30. Proc Biol Sci. 2024. PMID: 39471857 Free PMC article.
-
Avian Influenza in Wild Birds and Poultry: Dissemination Pathways, Monitoring Methods, and Virus Ecology.Pathogens. 2021 May 20;10(5):630. doi: 10.3390/pathogens10050630. Pathogens. 2021. PMID: 34065291 Free PMC article. Review.
-
Pathways for avian influenza virus spread: GPS reveals wild waterfowl in commercial livestock facilities and connectivity with the natural wetland landscape.Transbound Emerg Dis. 2022 Sep;69(5):2898-2912. doi: 10.1111/tbed.14445. Epub 2022 Jan 17. Transbound Emerg Dis. 2022. PMID: 34974641 Free PMC article.
-
Using an adaptive modeling framework to identify avian influenza spillover risk at the wild-domestic interface.Sci Rep. 2024 Jun 20;14(1):14199. doi: 10.1038/s41598-024-64912-w. Sci Rep. 2024. PMID: 38902400 Free PMC article.
-
Maintenance and dissemination of avian-origin influenza A virus within the northern Atlantic Flyway of North America.PLoS Pathog. 2022 Jun 6;18(6):e1010605. doi: 10.1371/journal.ppat.1010605. eCollection 2022 Jun. PLoS Pathog. 2022. PMID: 35666770 Free PMC article.
References
-
- Prosser Diann J., Cui Peng, Takekawa John Y., Tang Mingjie, Hou Yuansheng, Collins Bridget M., Yan Baoping, Hill Nichola J., Li Tianxian, Li Yongdong, Lei Fumin, Guo Shan, Xing Zhi, He Yubang, Zhou Yuanchun, Douglas David C., Perry William M., Newman Scott H. Wild Bird Migration across the Qinghai-Tibetan Plateau: A Transmission Route for Highly Pathogenic H5N1. PLoS ONE. 2011;6(3):e17622. doi: 10.1371/journal.pone.0017622. - DOI - PMC - PubMed
Publication types
MeSH terms
LinkOut - more resources
Full Text Sources
Medical
