. 2020 Feb 13;10(1):2569.
doi: 10.1038/s41598-020-59541-y.

Chronic circadian misalignment accelerates immune senescence and abbreviates lifespan in mice

Affiliations

Chronic circadian misalignment accelerates immune senescence and abbreviates lifespan in mice

Hitoshi Inokawa et al. Sci Rep. .

Abstract

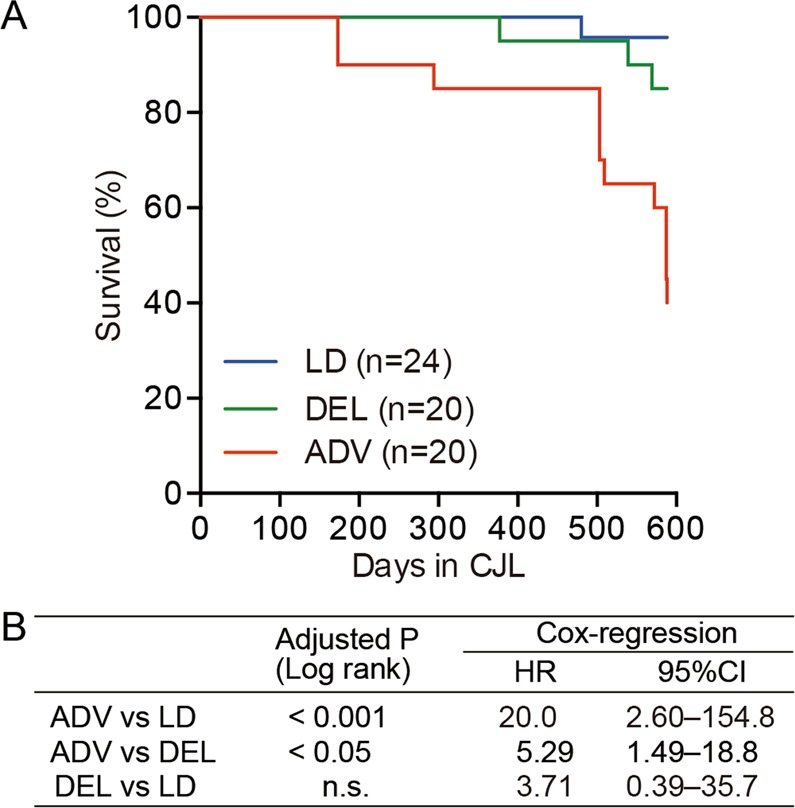
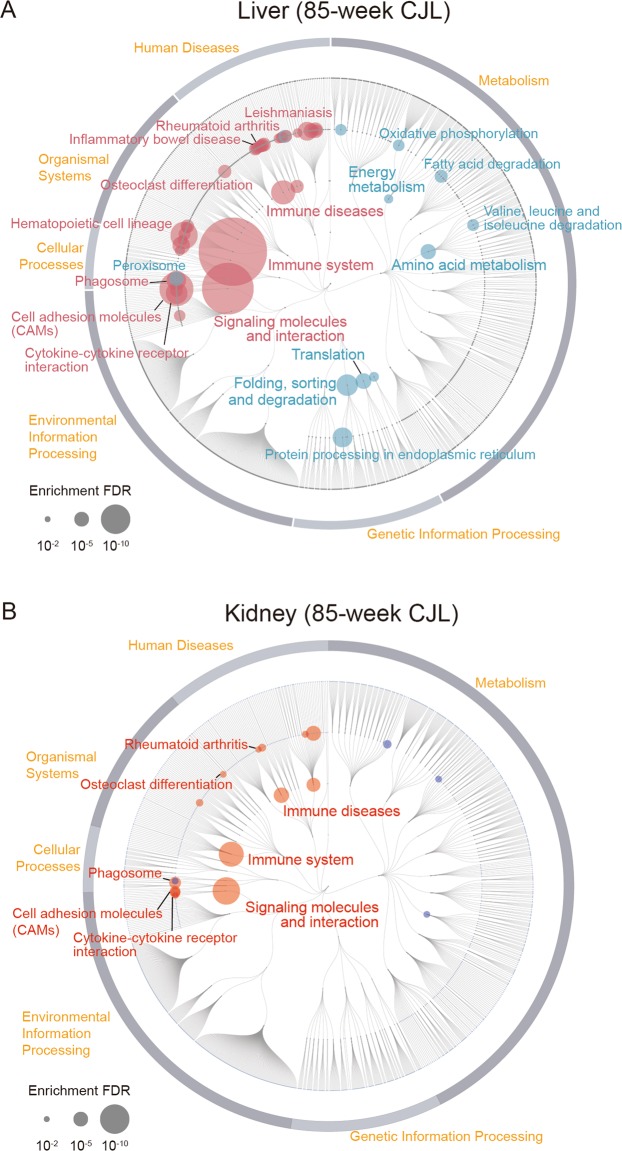
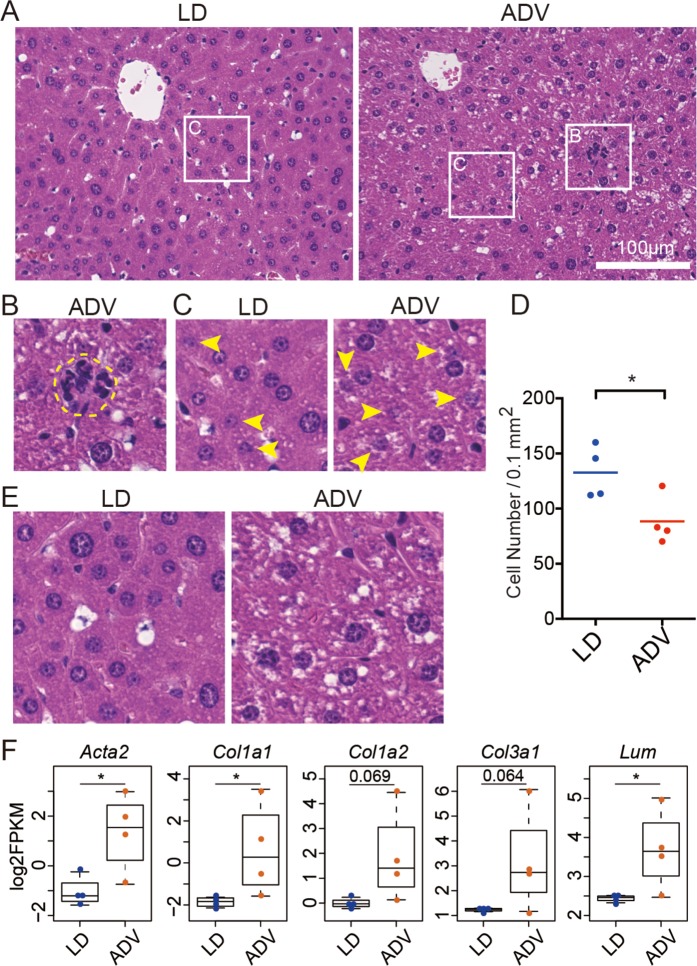
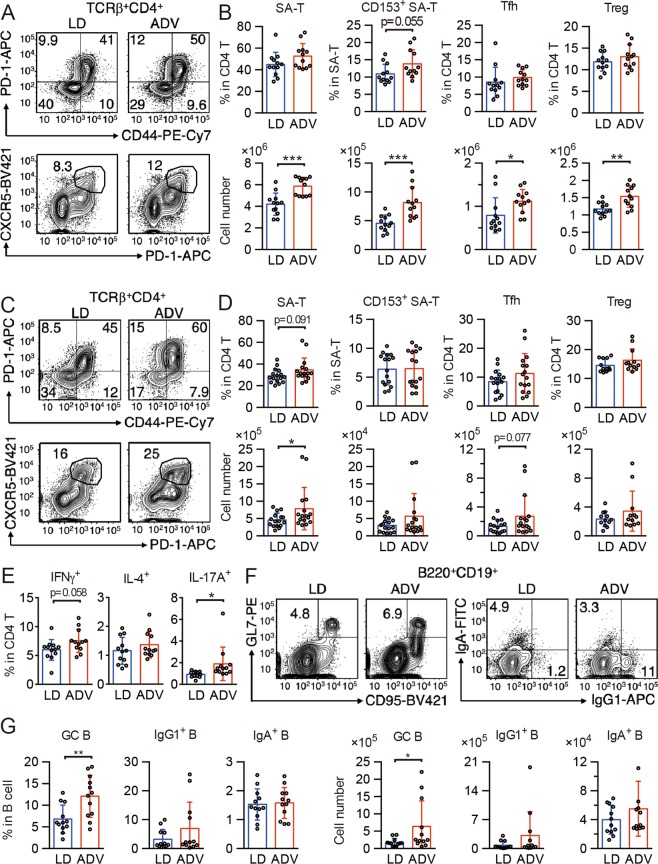
Modern society characterized by a 24/7 lifestyle leads to misalignment between environmental cycles and endogenous circadian rhythms. Persisting circadian misalignment leads to deleterious effects on health and healthspan. However, the underlying mechanism remains not fully understood. Here, we subjected adult, wild-type mice to distinct chronic jet-lag paradigms, which showed that long-term circadian misalignment induced significant early mortality. Non-biased RNA sequencing analysis using liver and kidney showed marked activation of gene regulatory pathways associated with the immune system and immune disease in both organs. In accordance, we observed enhanced steatohepatitis with infiltration of inflammatory cells. The investigation of senescence-associated immune cell subsets from the spleens and mesenteric lymph nodes revealed an increase in PD-1+CD44high CD4 T cells as well as CD95+GL7+ germinal center B cells, indicating that the long-term circadian misalignment exacerbates immune senescence and consequent chronic inflammation. Our results underscore immune homeostasis as a pivotal interventional target against clock-related disorders.


Conflict of interest statement

The authors declare no competing interests.

Figures

Figure 1
Figure 1
The long-term non-adjustive condition of light–dark cycles led to increased mortality. (A) Kaplan–Meier survival curves of mice kept under the three conditions. (B) The log-rank test was used to compare the Kaplan-Meier curves for the indicated conditions. The P values were adjusted by Bonferroni’s correction. The Cox proportional hazard regression model stratified by light conditions was used to obtain the hazard ratio (HR) and the associated 95% confidence interval (95% CI). n.s. = 0.6684.
Figure 2
Figure 2
The long-term non-adjustive ADV-condition desynchronized SCN neurons. (A) Representative bioluminescence images of SCN slice culture from Per2Luc mice under the indicated conditions for ~1 year. The animals were sampled at ZT12 on the second day after the shift. Hours indicate time after the last light onset. Scale = 200 µm. (B,C) Averaged bioluminescence traces from SCN slice cultures (mean ± SD, n = 3) and the FFT spectral analysis of the traces. Two-tailed Student’s t-test, *P < 0.05. Black and white bars show the animal’s previous LD conditions. (D) The detrended data of whole bioluminescence traces of the SCN slice culture from the indicated conditions. Orange boxes indicate the duration used for the single-cell level analysis. (E) ROIs for single-cell bioluminescence traces were represented in SCN images from each condition. LD, n = 14; ADV, n = 10. Scale = 250 µm. (F,G) The detrended traces at the single-cell level and the amplitude of the detrended traces. Two-tailed Student’s t-test, ****P < 0.0001.
Figure 3
Figure 3
RNA-seq of gene expression in livers and kidneys from mice kept under LD- and non-adjustive ADV-conditions for 85 weeks. (A,B) Enrichment analysis based on KEGG functional hierarchy for gene expression in the ADV-conditioned liver (A) or kidney (B) relative to their expression in the LD-condition. Node size indicates the false-discovery rate (FDR) of the enrichment analysis. Red nodes indicate significantly upregulated pathways in the ADV condition, while blue ones indicate significantly downregulated pathways.
Figure 4
Figure 4
TF enrichment analysis of long-term non-adjustive ADV-conditioned livers for 85 weeks. Gene sets enrichment analysis for evaluating effects of TFs on their binding target genes. We used normalized expression values of genes to calculate the relative effects of TFs in each sample. Estimated effects of TFs are presented in heatmaps as enrichment t-score.
Figure 5
Figure 5
Histological analysis of livers from mice kept under long-term ADV conditions for 85 weeks. (A) H&E staining of the livers from long-term ADV-conditioned mice. Each squared portion is magnified in (B,C). (B) Representative images of hematopoietic cell infiltration in livers of mice kept under long-term non-adjustive ADV condition. (C) Arrow heads indicate the degeneration of liver parenchymal cells which contain fragmented nuclear materials. (D) Quantification of the number of normal cells per unit area under each condition (n = 4). One dot indicates the average of four different visual fields in each mouse liver. Two-tailed Student’s t-test, *P < 0.05. (E) Fat deposition was accelerated in the long-term non-adjustive ADV-conditioned liver. (F) Beeswarm box plots of gene expression levels related to the fibrosis-associated genes. Asterisks indicate DESeq2 significance (FDR <0.05).
Figure 6
Figure 6
The long-term non-adjustive ADV condition accelerates generation of senescence-associated (SA) T cells and germinal center B cells. (A,B) Flow cytometry of senescence-associated T (SA-T) and follicular helper T (Tfh) cells in CD4+TCRβ+-gated spleen cells (A), and percentages and cell numbers of SA-T (CD4+TCRβ+CD44+PD-1+), CD153+ SA-T, Tfh (CD4+TCRβ+CXCR5+PD-1+), and regulatory T (Treg, CD4+TCRβ+CD25+) cells (B, n = 12) in spleens of LD- and ADV-conditioned mice. (C,D) Flow cytometry of SA-T and Tfh cells in CD4+TCRβ+-gated mLN cells (C) and percentages and cell numbers of SA-T, CD153+ SA-T, Tfh, and Treg (D, n = 12–16) in mLNs of LD- and ADV-conditioned mice. (E) Whole mLN cells from LD- and ADV-conditioned mice were stimulated with PMA and ionomycin for 3 hours. Percentages of IFN-γ–, IL-4–, and IL-17A–producing helper T cells in CD4 T cells were shown (n = 12). (F) Flow cytometry of germinal center B cell (GC-B) and IgG1+ and IgA+ class-switched B cells in mLNs of LD- and ADV-conditioned mice. (G) Cell numbers of GC-B (CD19+B220+CD95+GL7+), IgG1 B cells (CD19+B220+IgG1+), and IgA B cells (CD19+B220+IgA+) in mLN from LD- and ADV-conditioned mice (n = 12). Data are means ± SD. Two-tailed Student’s t-test, *P < 0.05, **P < 0.01, ***P < 0.001.

References

    1. Takahashi JS. Transcriptional architecture of the mammalian circadian clock. Nat. Rev. Genet. 2017;18:164–179. doi: 10.1038/nrg.2016.150. - DOI - PMC - PubMed
    1. Pilorz V, Helfrich-Forster C, Oster H. The role of the circadian clock system in physiology. Pflugers Arch. 2018;470:227–239. doi: 10.1007/s00424-017-2103-y. - DOI - PubMed
    1. Grimaldi D, Carter JR, Van Cauter E, Leproult R. Adverse Impact of Sleep Restriction and Circadian Misalignment on Autonomic Function in Healthy Young Adults. Hypertension. 2016;68:243–250. doi: 10.1161/HYPERTENSIONAHA.115.06847. - DOI - PMC - PubMed
    1. Kubo T, et al. An industry-based cohort study of the association between weight gain and hypertension risk among rotating shift workers. J. Occup. Environ. Med. 2013;55:1041–1045. doi: 10.1097/JOM.0b013e31829731fd. - DOI - PubMed
    1. Leproult R, Holmback U, Van Cauter E. Circadian misalignment augments markers of insulin resistance and inflammation, independently of sleep loss. Diabetes. 2014;63:1860–1869. doi: 10.2337/db13-1546. - DOI - PMC - PubMed

Publication types

MeSH terms

Substances