. 2020 Apr;39(15):3102-3113.
doi: 10.1038/s41388-020-1186-7. Epub 2020 Feb 13.

Detection of pancreatic ductal adenocarcinoma with galectin-9 serum levels

Affiliations

Detection of pancreatic ductal adenocarcinoma with galectin-9 serum levels

Adrian M Seifert et al. Oncogene. 2020 Apr.

Abstract

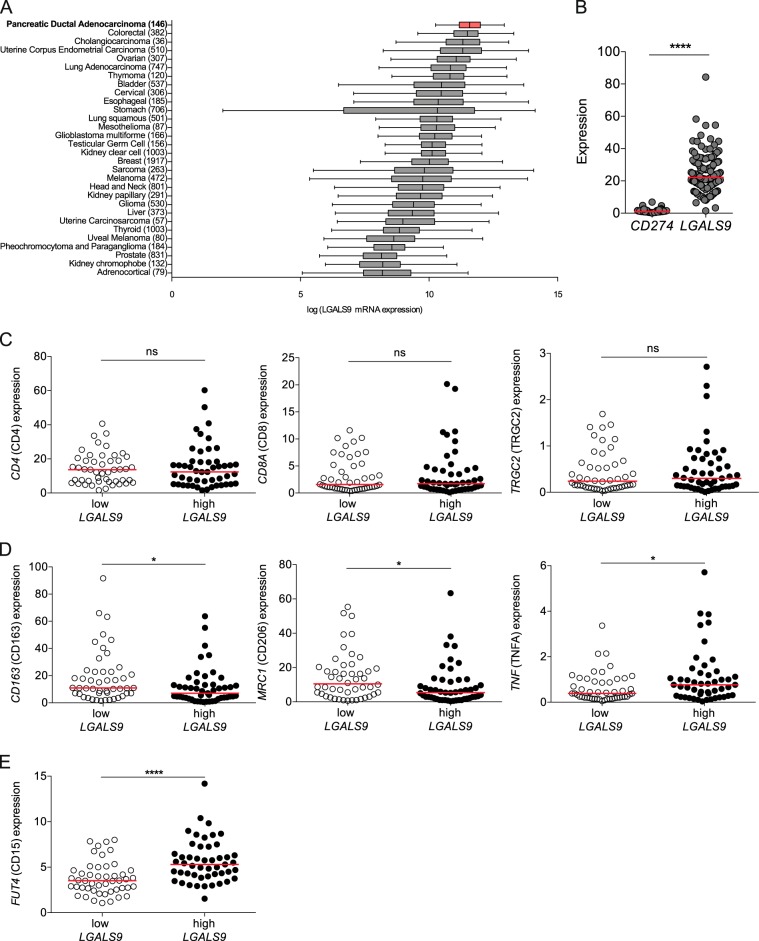
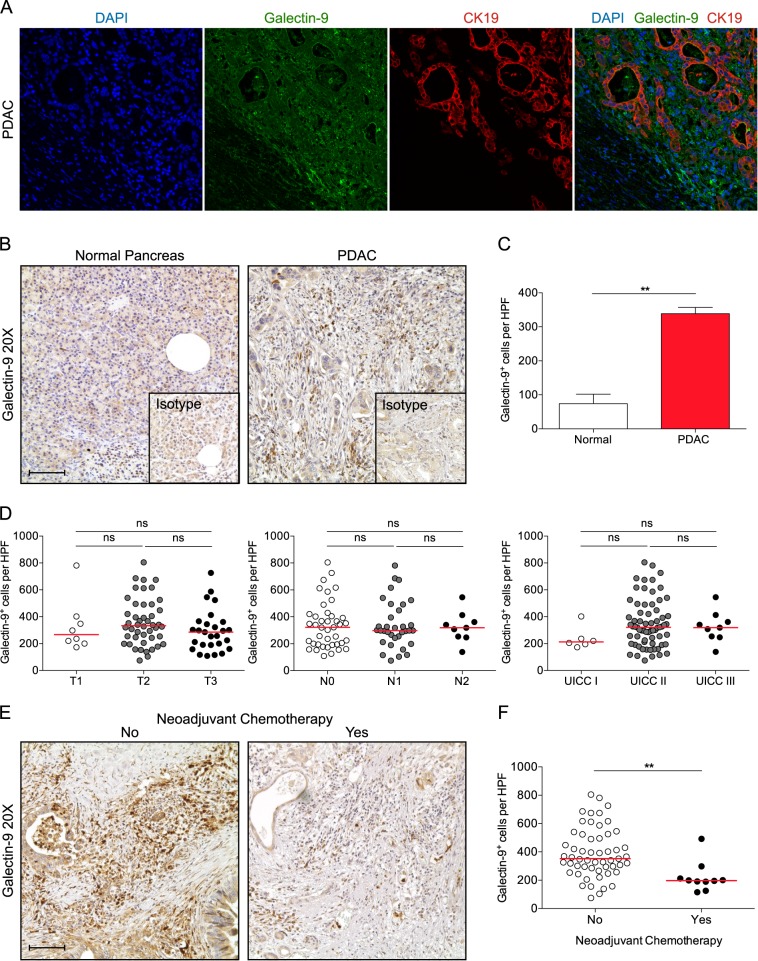
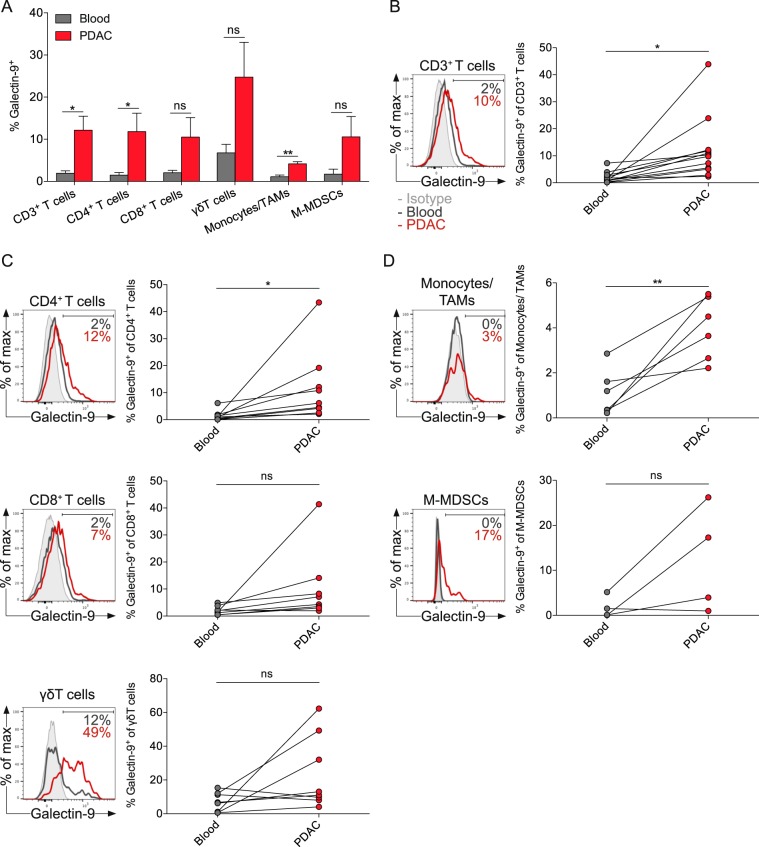
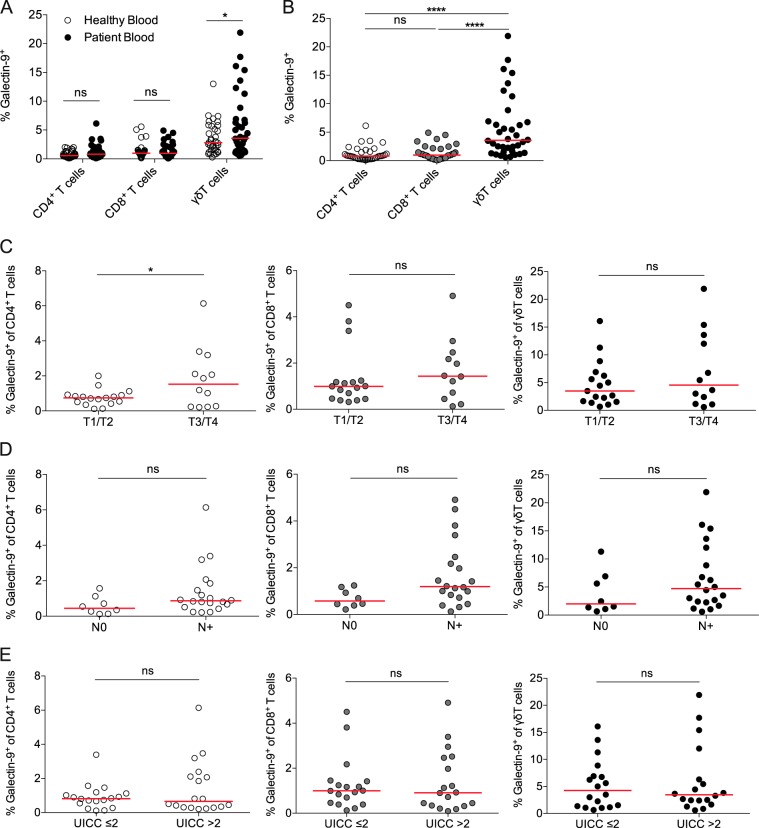
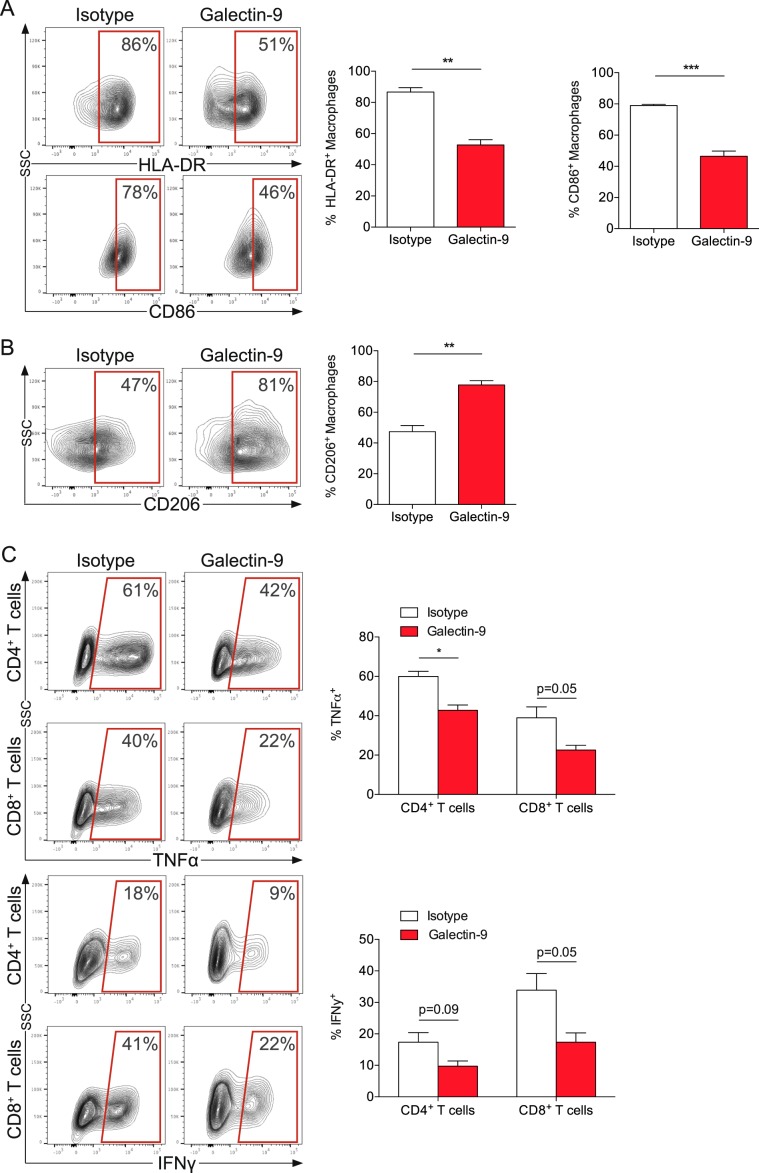
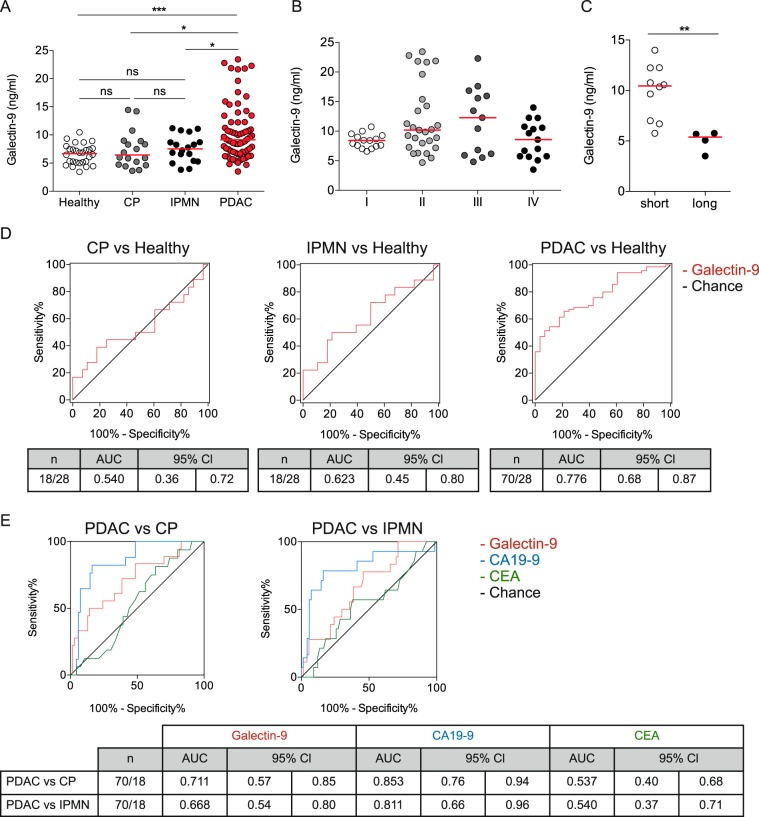
Pancreatic ductal adenocarcinoma (PDAC) responds poorly to checkpoint blockade, such as anti-CTLA-4 and anti-PD-1. Galectin-9, a β-galactoside-binding lectin, promotes immune suppression through T-cell inhibition, and programming of tolerogenic macrophages. Of all cancers tested, PDAC showed the highest expression of LGALS9 (galectin-9) mRNA. We analyzed formalin-fixed and paraffin-embedded specimens from 83 patients with PDAC stained for galectin-9. Using flow cytometry, we determined galectin-9 expression on immune cells from tumor and matched blood samples from 12 patients with resectable PDAC. Furthermore, we analyzed galectin-9 serum levels by enzyme-linked immunosorbent assay using serum samples from 70 patients with PDAC, from 36 individuals with benign pancreatic disease, and from 28 healthy controls. Galectin-9 was highly expressed in human PDAC compared with normal pancreas and present on both tumor and immune cells. Tumor-infiltrating immune cells, especially CD3+ T cells, showed upregulation of galectin-9 compared with immune cells from matched blood. Blood γδ T cells from PDAC patients had higher galectin-9 expression than γδ T cells from healthy individuals. Galectin-9 polarized macrophages toward a protumoral M2 phenotype leading to suppressed T-cell cytokine secretion. Furthermore, serum concentration of galectin-9 was able to discriminate PDAC from benign pancreatic disease and healthy individuals, and was prognostic for stage IV patients. Galectin-9 is a new biomarker for the detection of PDAC.


Conflict of interest statement

GM has an RCA with Puretech Health. All other authors have declared that no conflict of interest exists.

Figures

Fig. 1
Fig. 1. Human PDAC has high LGALS9 mRNA levels.
a Box plots of LGALS9 (galectin-9) mRNA expression measured in various human solid tumors (sample size in parentheses) assessed by RNA-seq. Tumors are sorted in order of decreasing median expression of LGALS9 mRNA. Of the pancreatic cancer samples from the TCGA database (n = 179), we analyzed only PDAC (n = 146). All expression values are log2-transformed. b Expression of CD274 (PD-L1) and LGALS9 mRNA was tested in human PDAC tissues using the TCGA database. c Correlation between high and low tertiles of LGALS9 mRNA expression and CD4, CD8A, and TRGC2 expression, d CD163, CD206, and TNF (TNFA) and e FUT4 (CD15) expression. Each point represents data from one patient. Data, median, unpaired t-test. *p< 0.05, ****p< 0.0001.
Fig. 2
Fig. 2. Galectin-9 is expressed on tumor cells in human PDAC.
a Paraffin-embedded human PDAC specimens were tested for galectin-9 and CK19 co-expression by immunofluorescence microscopy. Representative images are shown. Nuclei counterstained with 4′,6-diamidino-2-phenylindole (DAPI). b Representative images from paraffin-embedded sections of human PDAC (n = 83) and normal pancreas tissue (n = 5) were tested for expression of galectin-9. c Quantification of galectin-9+ cells per high-power field (HPF). d Number of galectin-9+ cells per HPF among pathological T (left), N (middle), and UICC stages (right). Each dot represents a separate specimen. e Representative images from untreated human PDAC (left) and after neoadjuvant chemotherapy (right). Each point represents data from one patient. f Quantification of galectin-9+ cells per HPF. Bar graph, mean ± SEM, unpaired t-test. Dot plots, median, one-way ANOVA. **p< 0.01.
Fig. 3
Fig. 3. PDAC-infiltrating immune cells express higher levels of galectin-9 compared with matched blood immune cells.
a Percentages of galectin-9 expression of indicated immune cells in matched blood and tumor specimens from PDAC patients. b Histogram and quantification of galectin-9 expression on all CD3+ T cells, c CD4+ T cells (CD3+CD4+CD8, top), CD8+ T cells (CD3+CD4CD8+, middle), γδ T cells (CD3+CD4CD8γδTCR+, bottom), d Monocytes/tumor-associated macrophages (TAMs, LinCD11b+CD14+, top) and monocytic myeloid-derived suppressor cells (M-MDSCs, LinCD11b+HLA-DRCD14+, bottom). Each point represents data from one patient. Data, paired t-test. *p< 0.05, **p< 0.01.
Fig. 4
Fig. 4. PDAC patients have increased galectin-9 expression on blood γδ T-cell subsets.
a Percentages of galectin-9 expression of indicated T-cell subset in blood from healthy individuals and patients with PDAC. b Percentages of galectin-9 expression of indicated T-cell subset in blood from patients with PDAC. c Percentages of galectin-9 expression on CD4+ T cells (left), CD8+ T cells (middle), γδ T cells (right) in blood from patients with PDAC among T, d N, and e UICC stages. Each point represents data from one patient. Data, median. one-way ANOVA or unpaired t-test. *p< 0.05, **p< 0.01, ****p< 0.0001.
Fig. 5
Fig. 5. Galectin-9 polarizes macrophages toward a M2 phenotype.
a Macrophages were cocultured (1:4 ratio) with AsPC-1 cells with recombinant human galectin-9 or control for 48 h and stained for HLA-DR (top), CD86 (bottom) and b CD206. c After coculture for 48 h, macrophages were separated from AsPC-1 cells incubated with galectin-9 or control and then added to CD3+ T cells (1:2 ratio) for 48 h. T cells were stained for CD4, CD8, TNF-α (top) and IFN-γ (bottom). Bar graph, mean ± SEM, unpaired t-test. *p< 0.05, **p< 0.01, ***p< 0.001.
Fig. 6
Fig. 6. Galectin-9 serum levels discriminate PDAC patients from benign pancreatic disease and healthy individuals.
a Dot plots of galectin-9 concentrations in serum samples from health individuals (Healthy, n = 28), patients with chronic pancreatitis (CP, n = 18), intraductal papillary mucinous neoplasm (IPMN, n = 18), and PDAC (n = 70). b Dot plots of galectin-9 concentrations in serum samples from PDAC patients at indicated UICC stages. c Dot plots of galectin-9 concentrations in serum samples from stage IV PDAC patients displaying short- (<12 months) or long-term (>12 months) survival. d ROC curves for galectin-9 concentrations in serum samples from patients with CP (left), IPMN (middle), and PDAC (right) versus healthy controls (Healthy). e ROC curves for galectin-9, CA19-9, and CEA concentrations in serum samples from PDAC versus CP (left) and IPMN (right). Each point represents data from one patient. Data, median. one-way ANOVA or unpaired t-test. *p< 0.05, **p< 0.01, ***p< 0.001.

References

    1. Yadav D, Lowenfels AB. The epidemiology of pancreatitis and pancreatic cancer. Gastroenterology. 2013;144:1252–61. doi: 10.1053/j.gastro.2013.01.068. - DOI - PMC - PubMed
    1. Von Hoff DD, Ervin T, Arena FP, Chiorean EG, Infante J, Moore M, et al. Increased survival in pancreatic cancer with nab-paclitaxel plus gemcitabine. N Engl J Med. 2013;369:1691–703. doi: 10.1056/NEJMoa1304369. - DOI - PMC - PubMed
    1. Brahmer JR, Tykodi SS, Chow LQM, Hwu W-J, Topalian SL, Hwu P, et al. Safety and activity of anti-PD-L1 antibody in patients with advanced cancer. N Engl J Med. 2012;366:2455–65. doi: 10.1056/NEJMoa1200694. - DOI - PMC - PubMed
    1. Royal RE, Levy C, Turner K, Mathur A, Hughes M, Kammula US, et al. Phase 2 trial of single agent Ipilimumab (anti-CTLA-4) for locally advanced or metastatic pancreatic adenocarcinoma. J Immunother. 2010;33:828–33. doi: 10.1097/CJI.0b013e3181eec14c. - DOI - PMC - PubMed
    1. Clark CE, Hingorani SR, Mick R, Combs C, Tuveson DA, Vonderheide RH. Dynamics of the immune reaction to pancreatic cancer from inception to invasion. Cancer Res. 2007;67:9518–27. doi: 10.1158/0008-5472.CAN-07-0175. - DOI - PubMed

Publication types

MeSH terms