. 2020 Feb;6(2):154-166.
doi: 10.1038/s41477-020-0591-9. Epub 2020 Feb 13.

An atypical short-chain dehydrogenase-reductase functions in the relaxation of photoprotective qH in Arabidopsis

Affiliations

An atypical short-chain dehydrogenase-reductase functions in the relaxation of photoprotective qH in Arabidopsis

Cynthia L Amstutz et al. Nat Plants. 2020 Feb.

Abstract

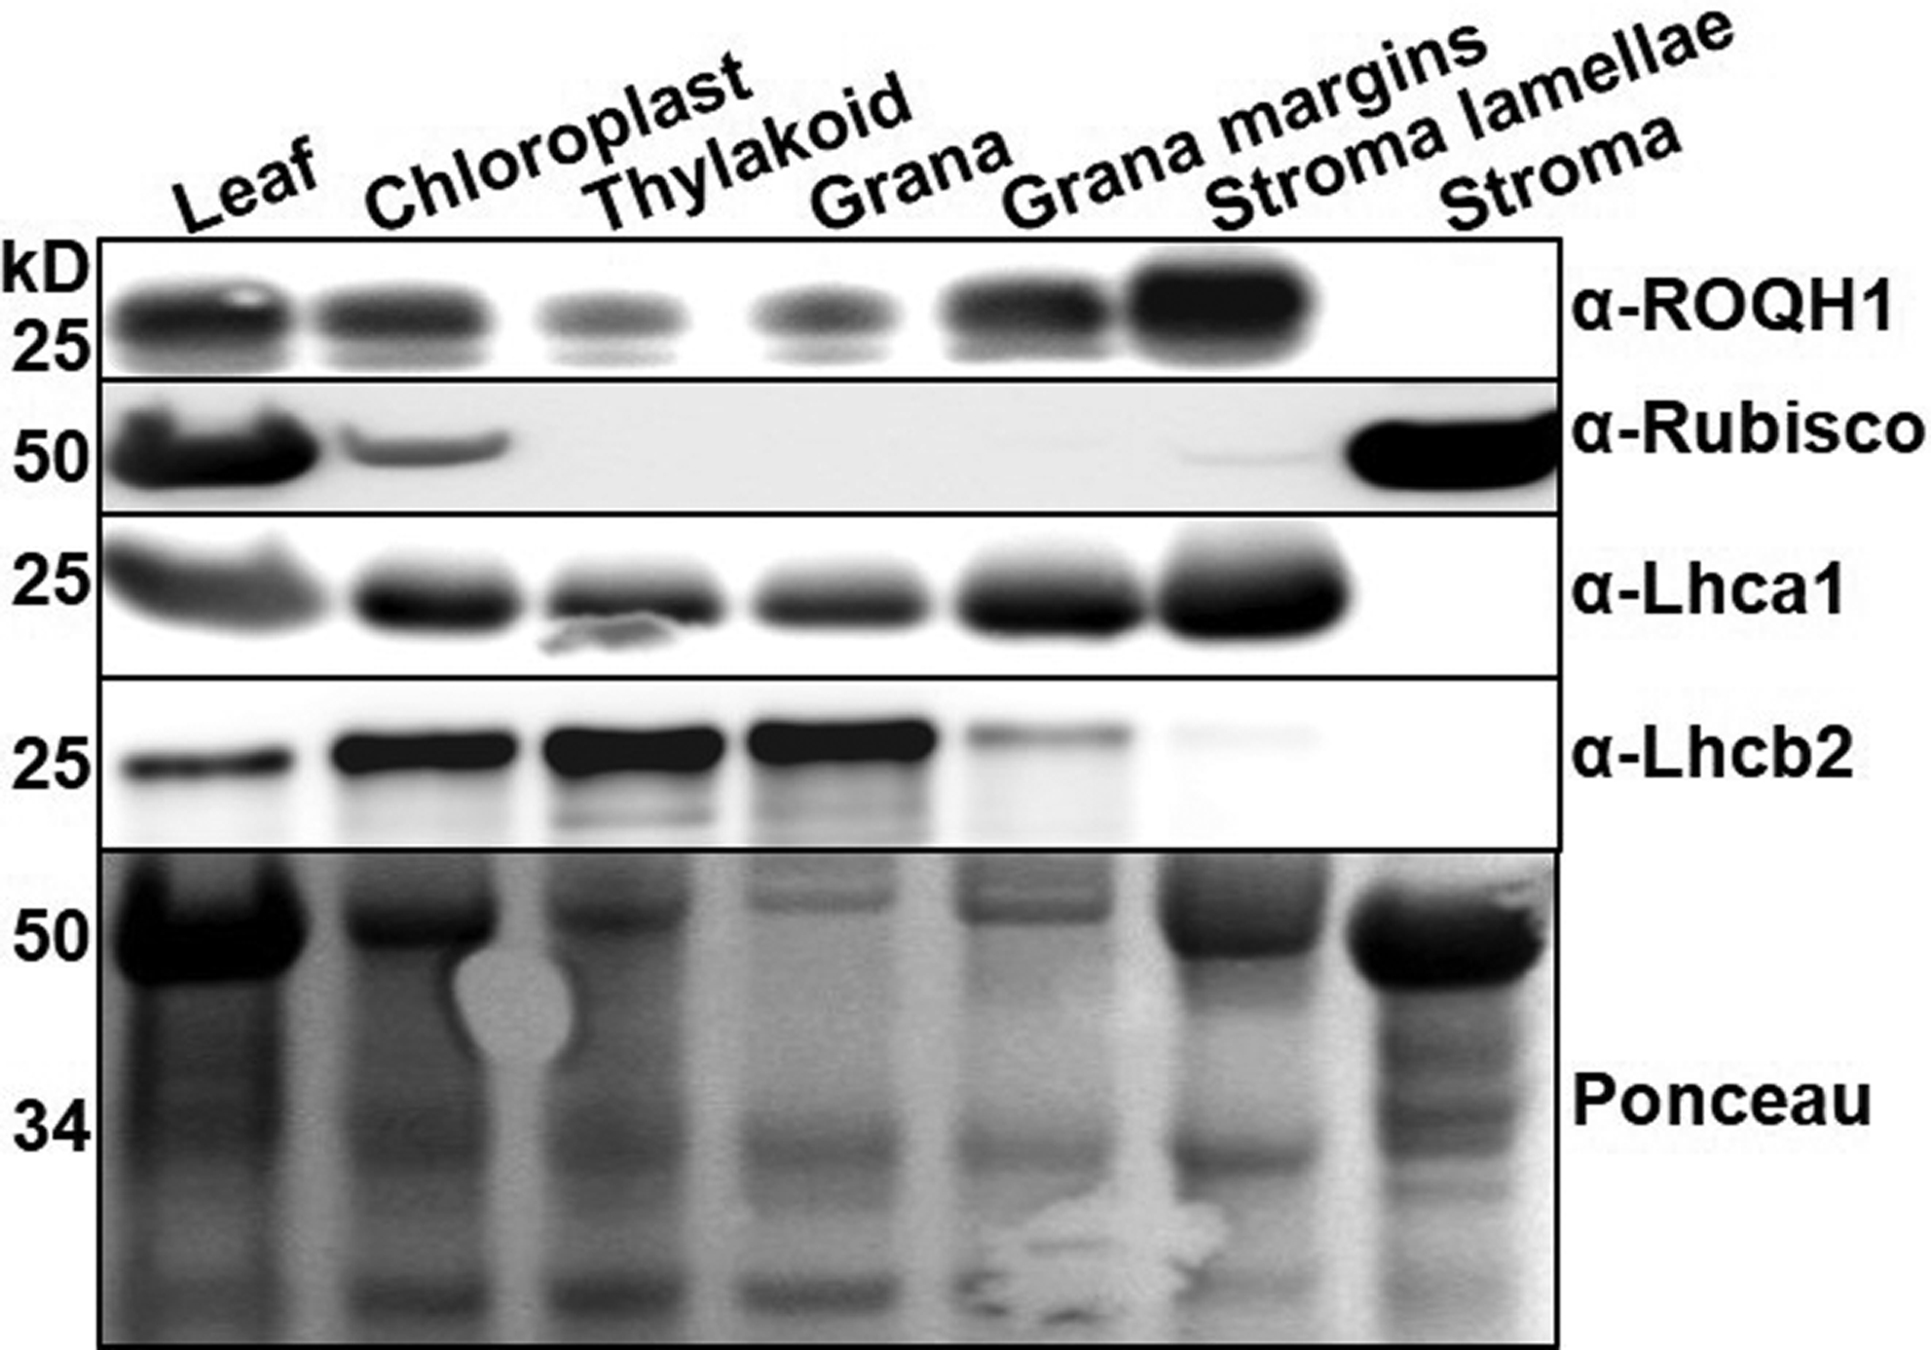
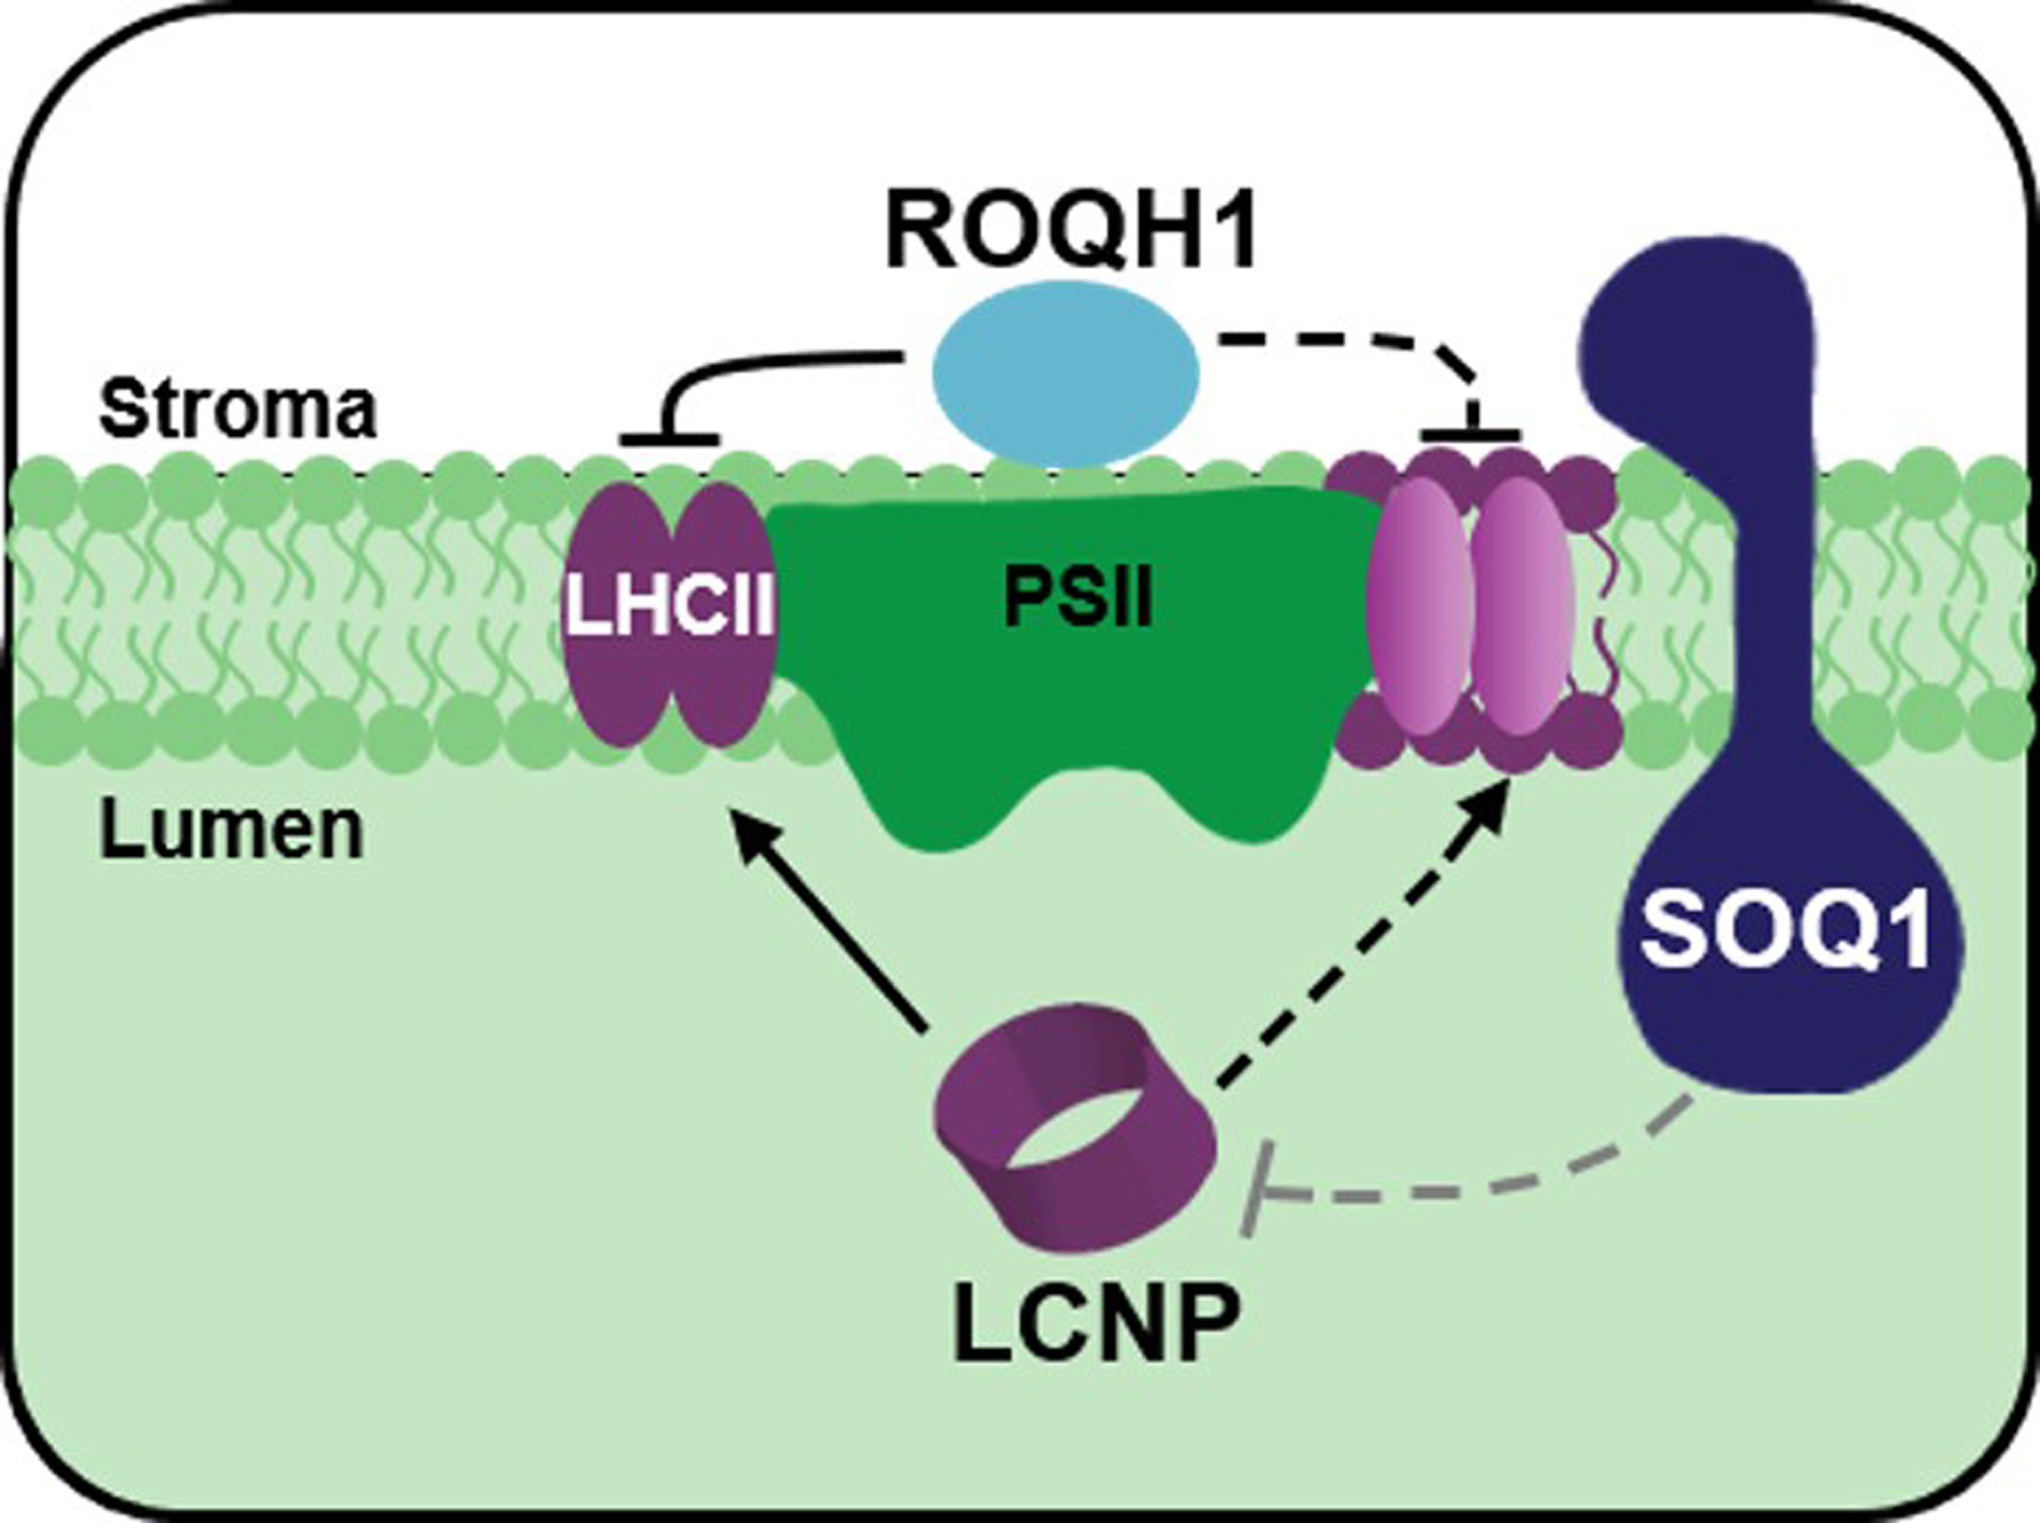
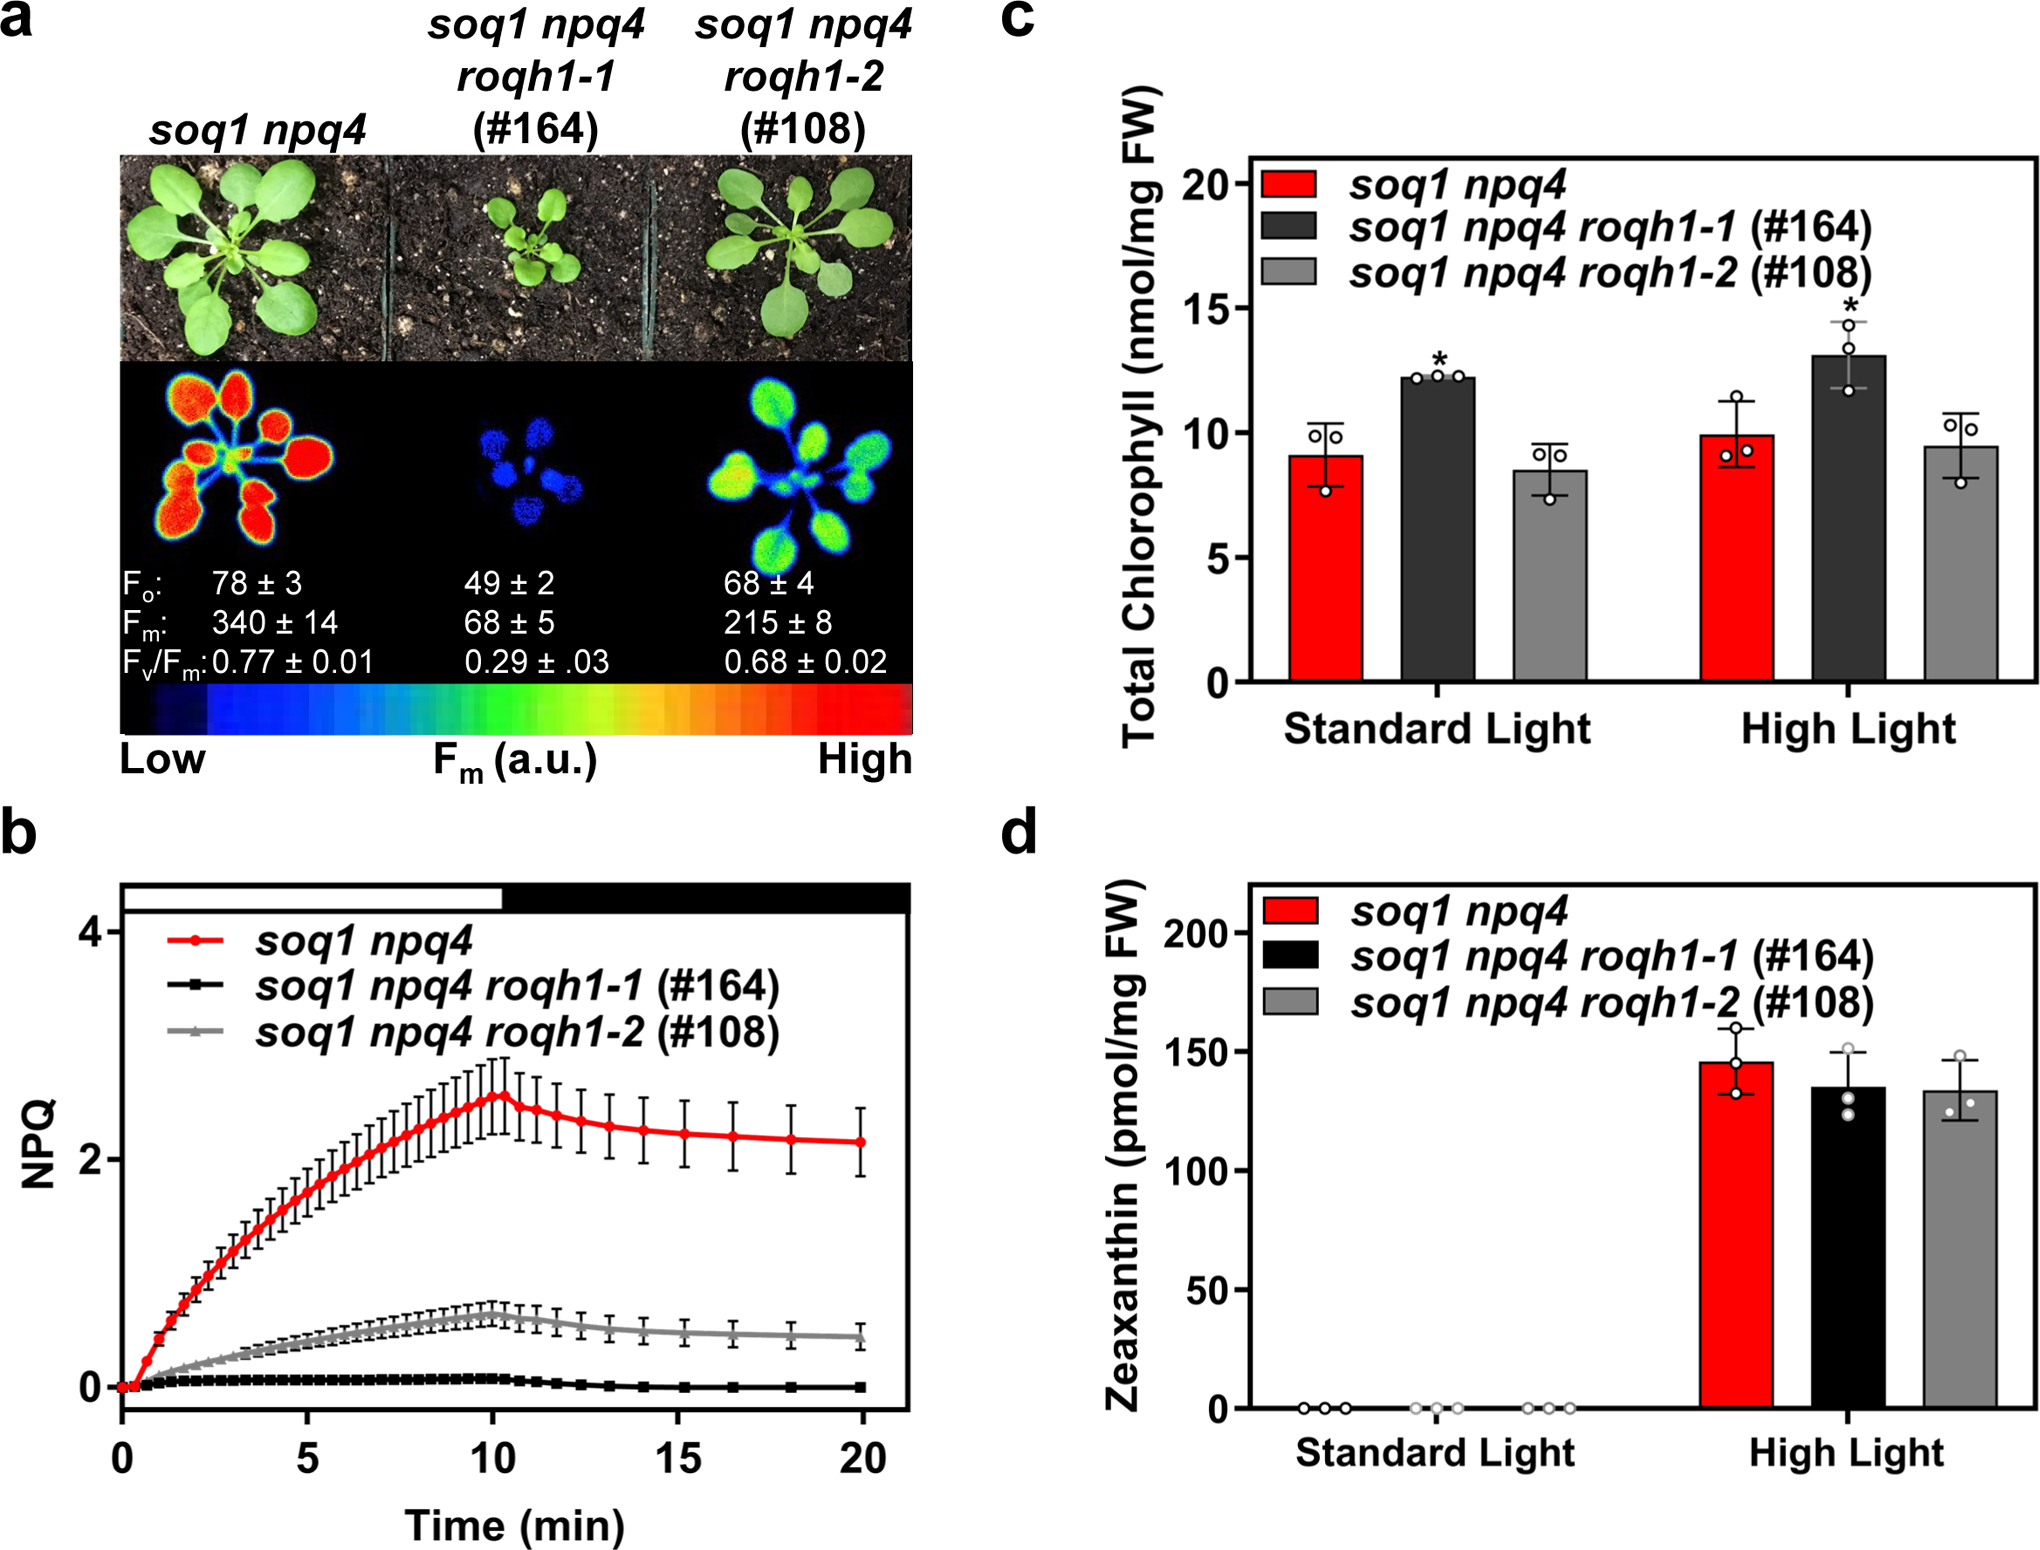
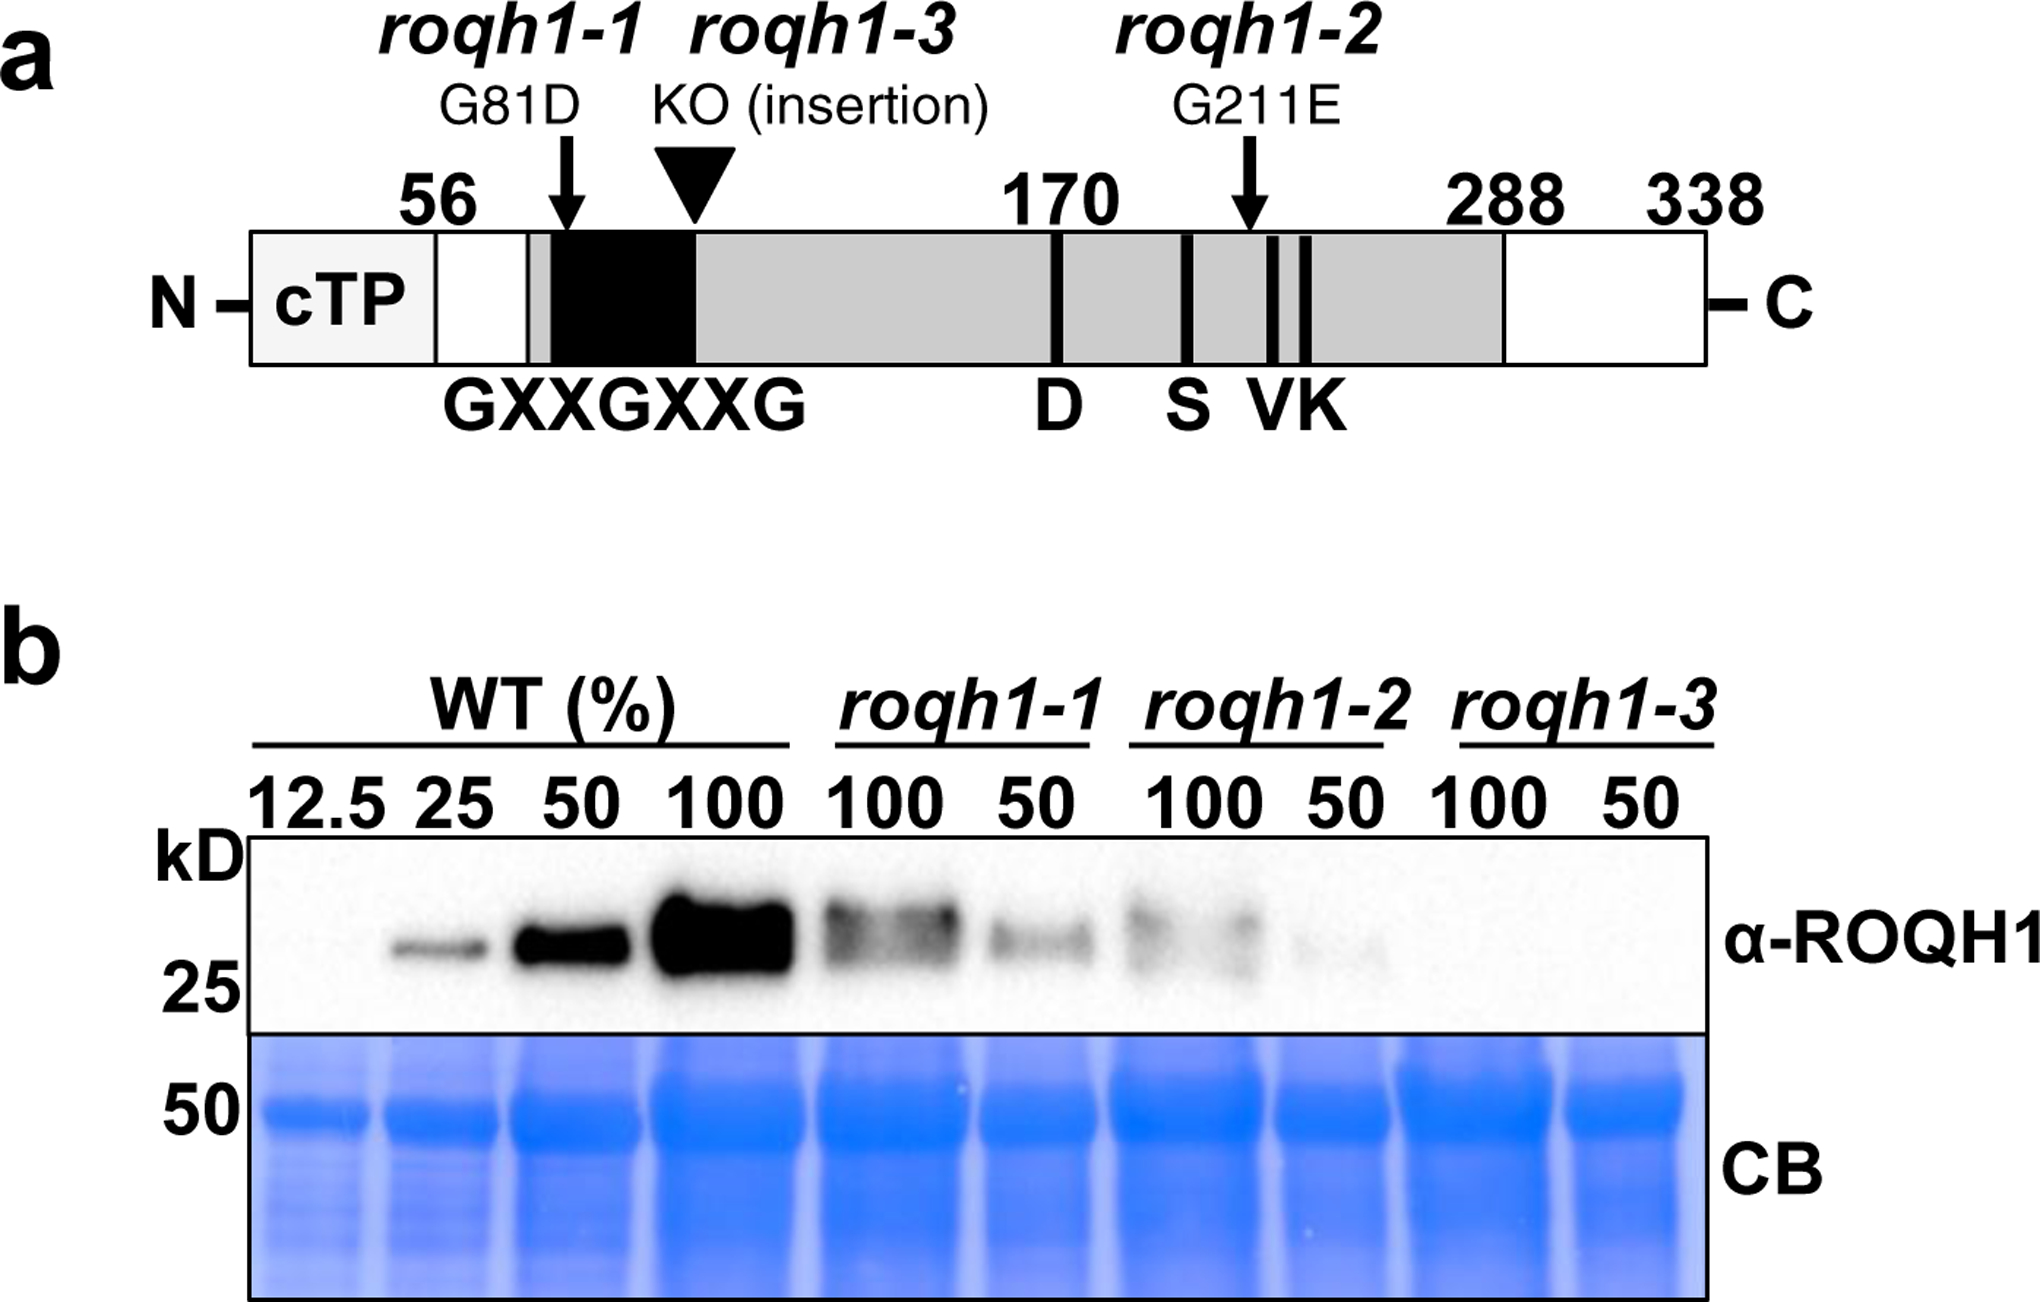
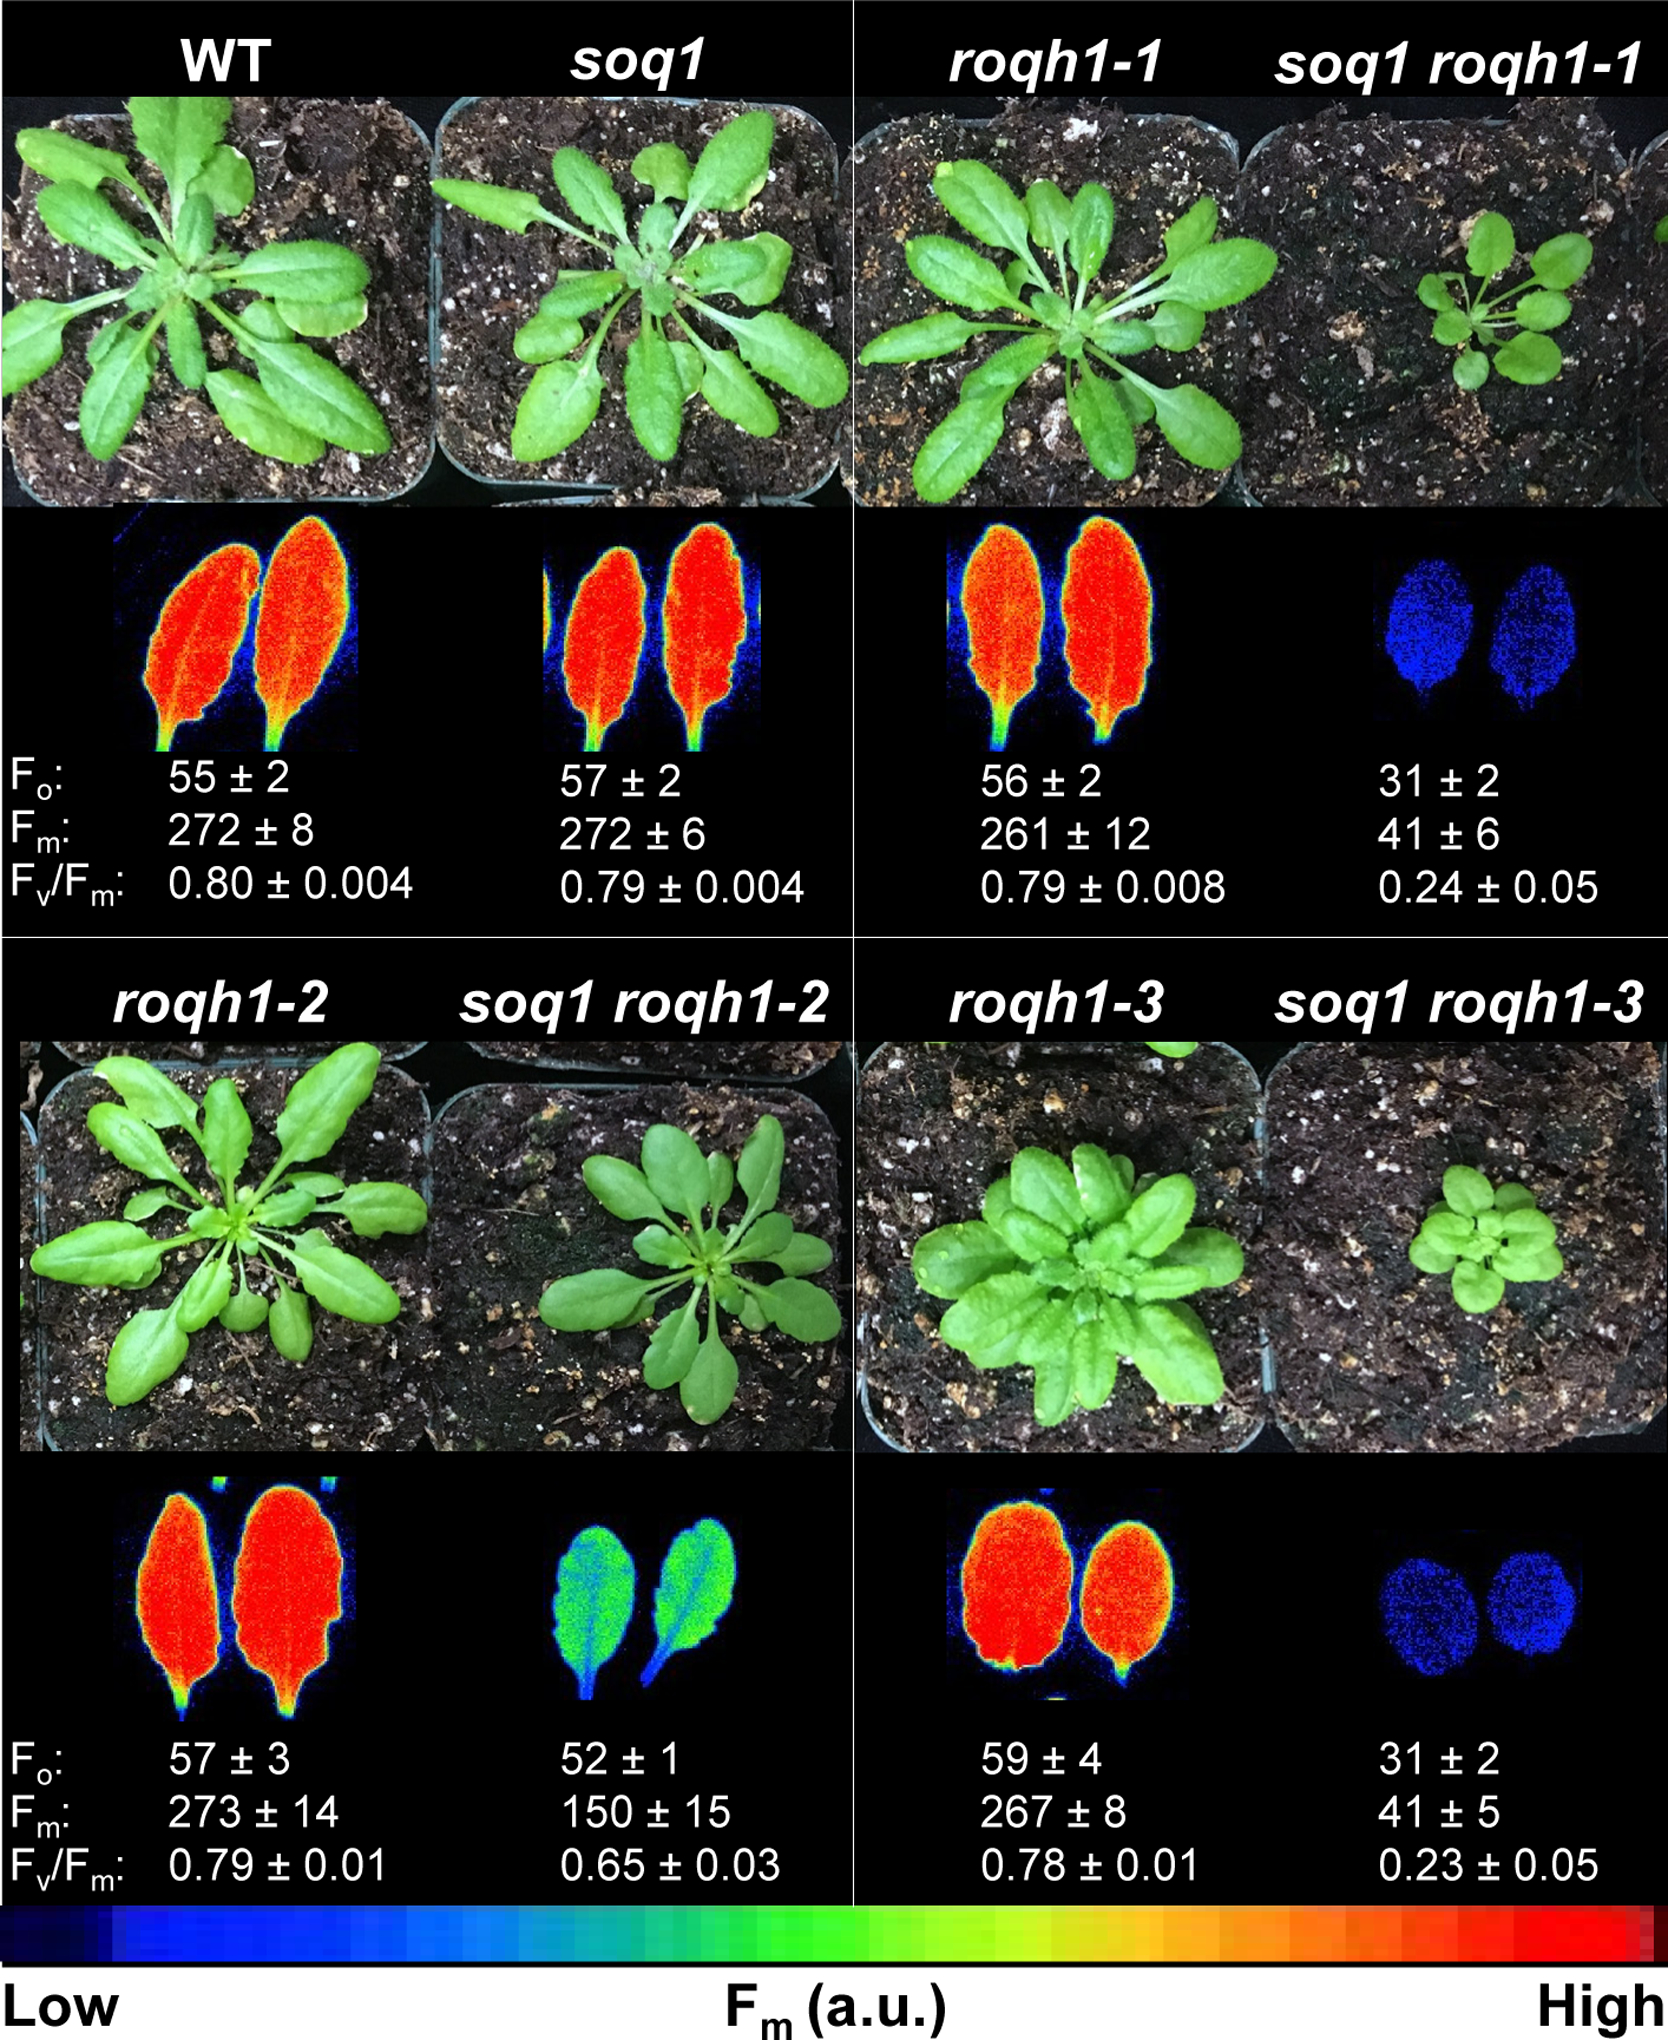
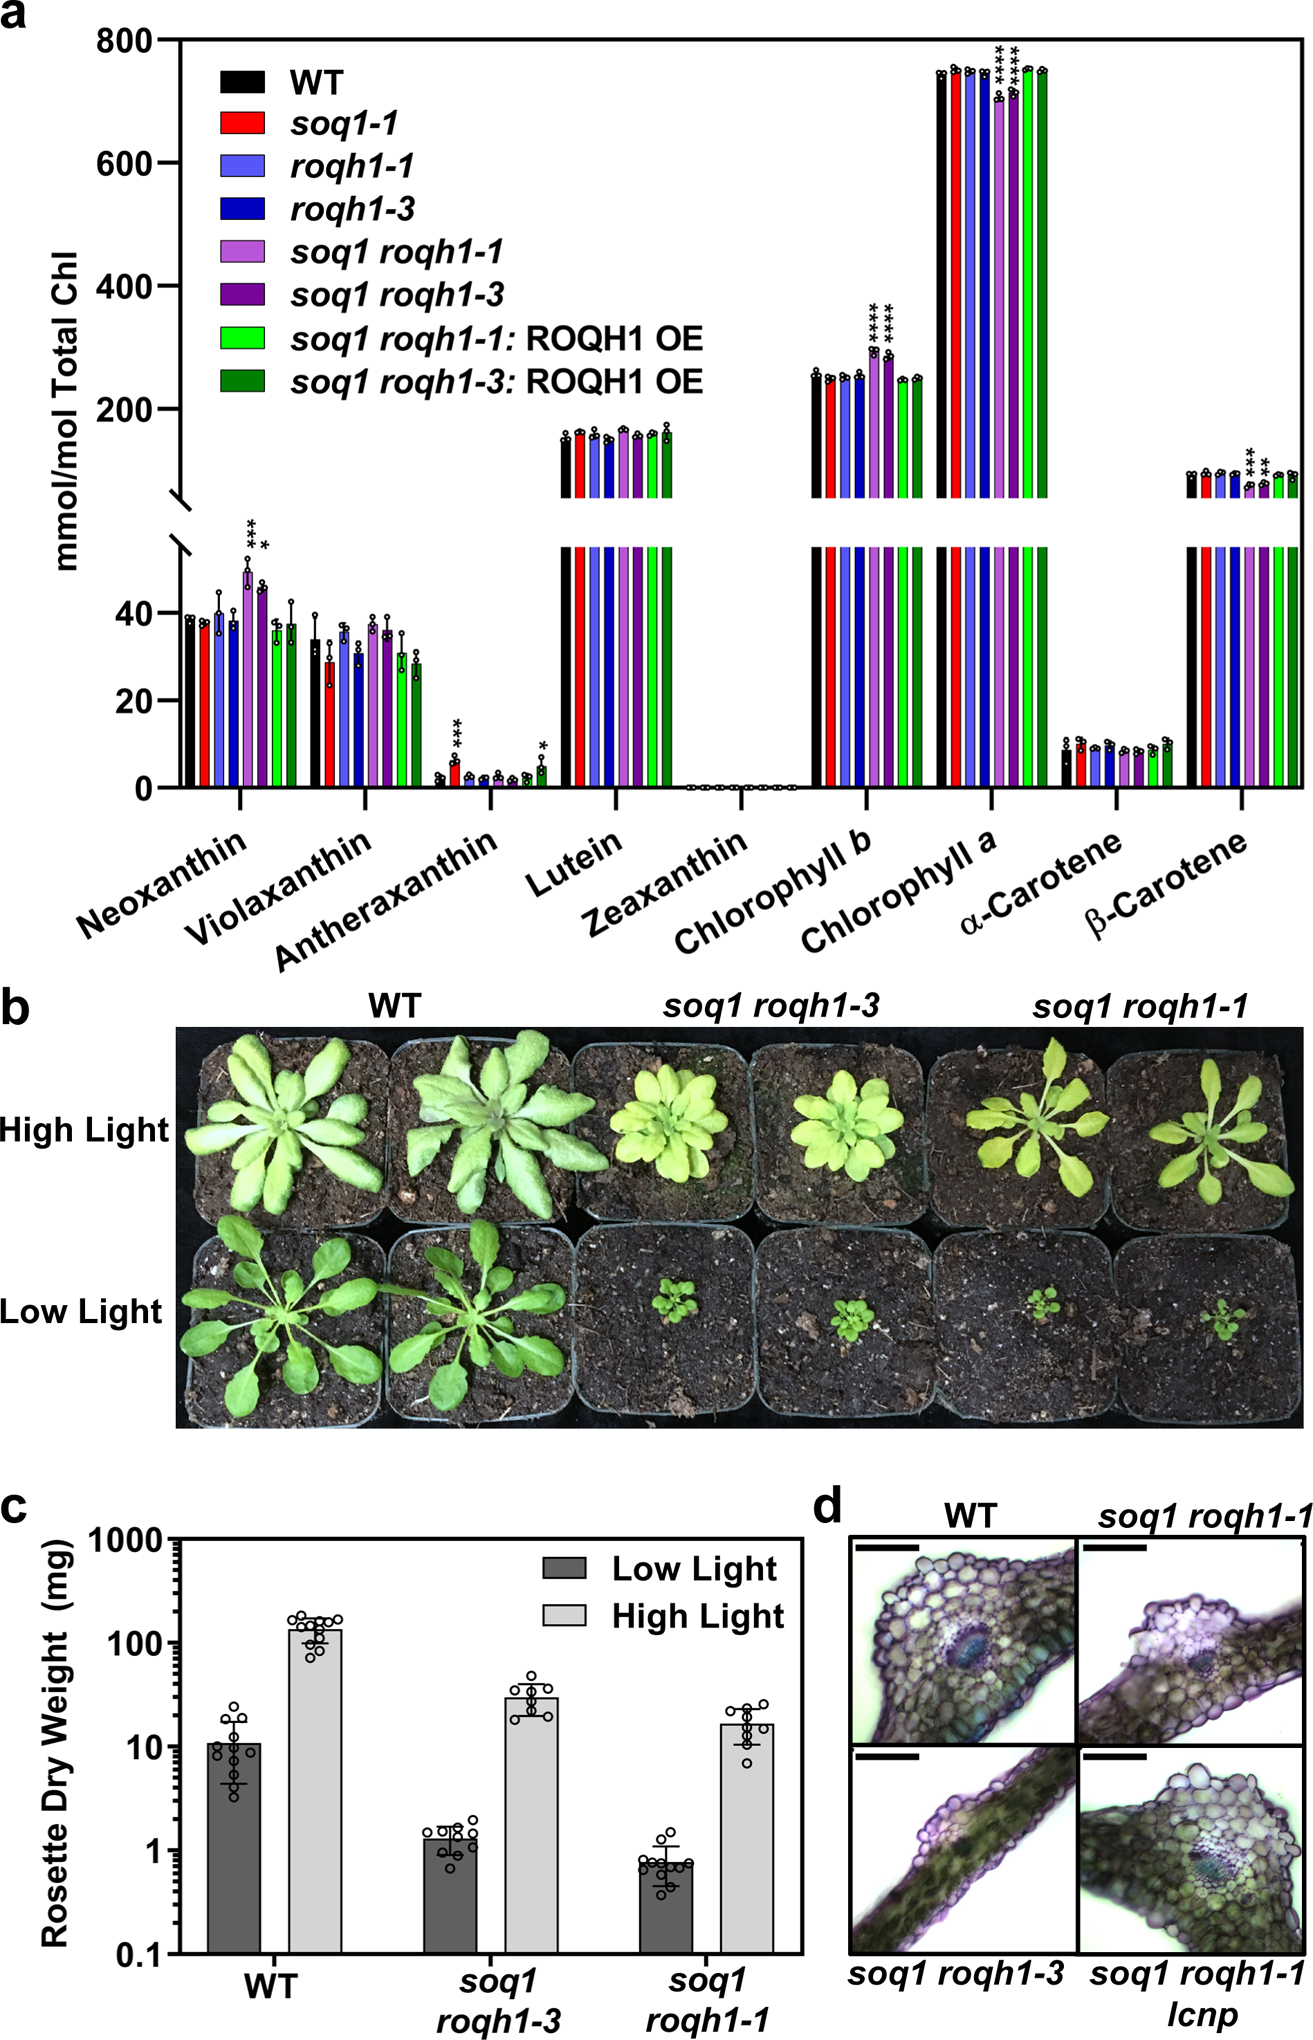
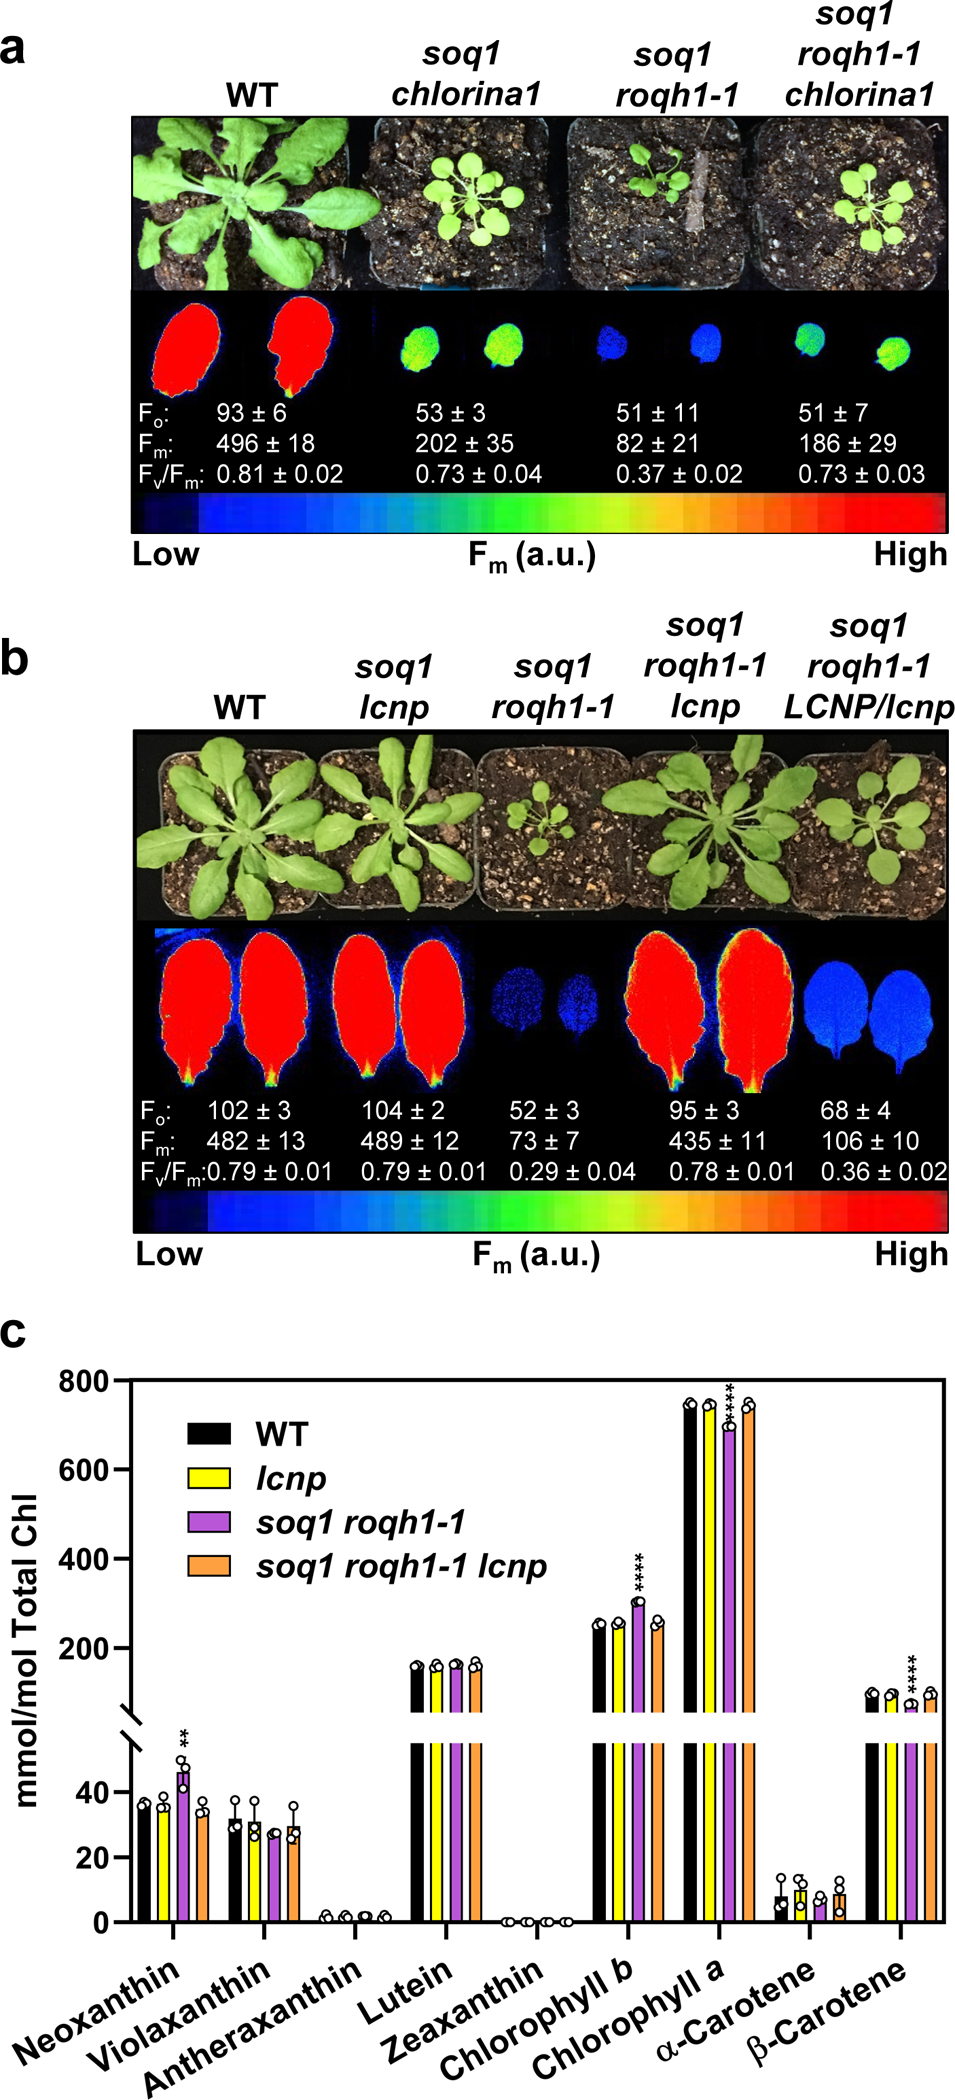
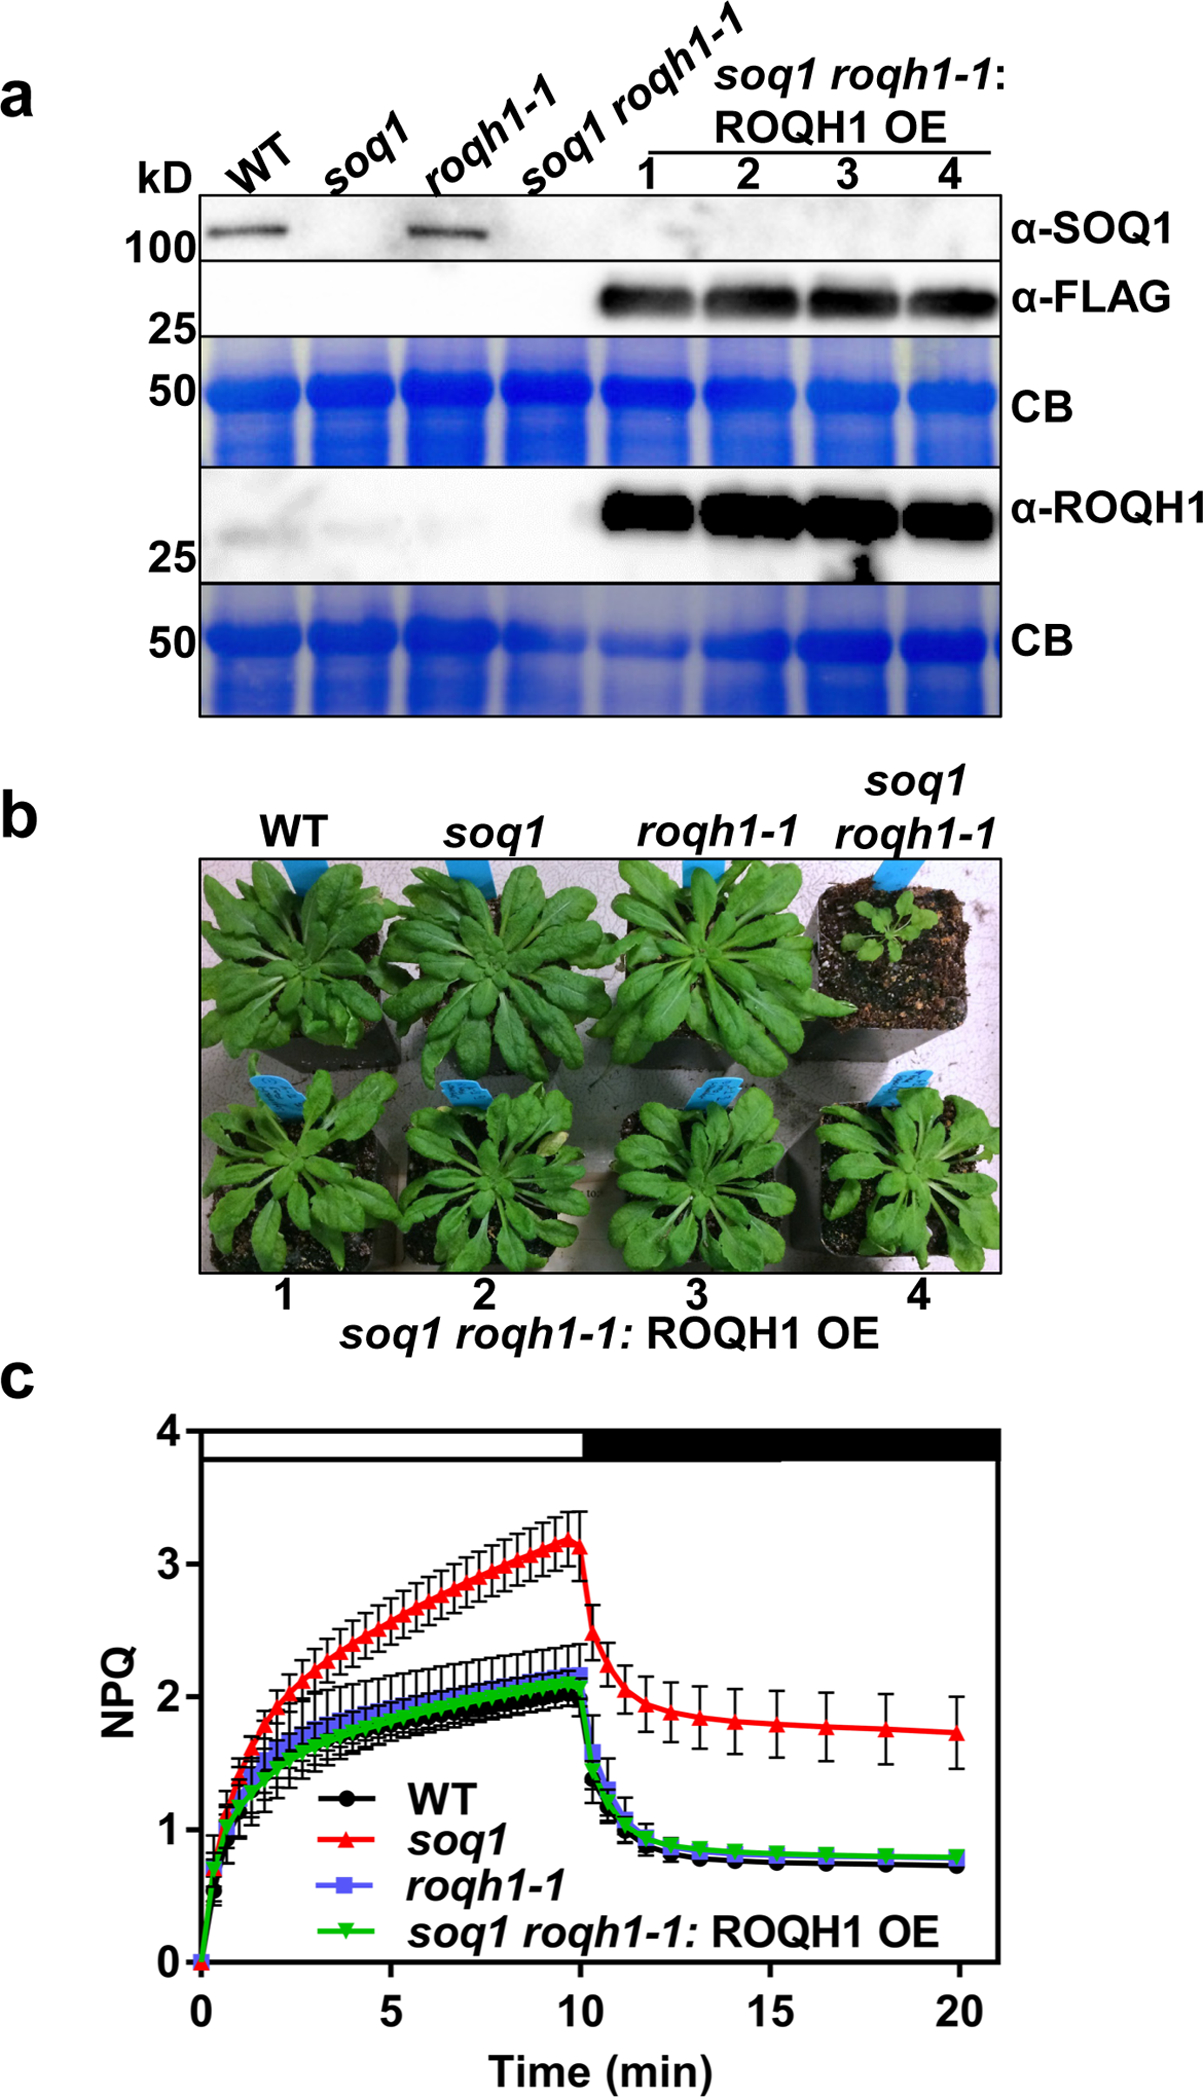
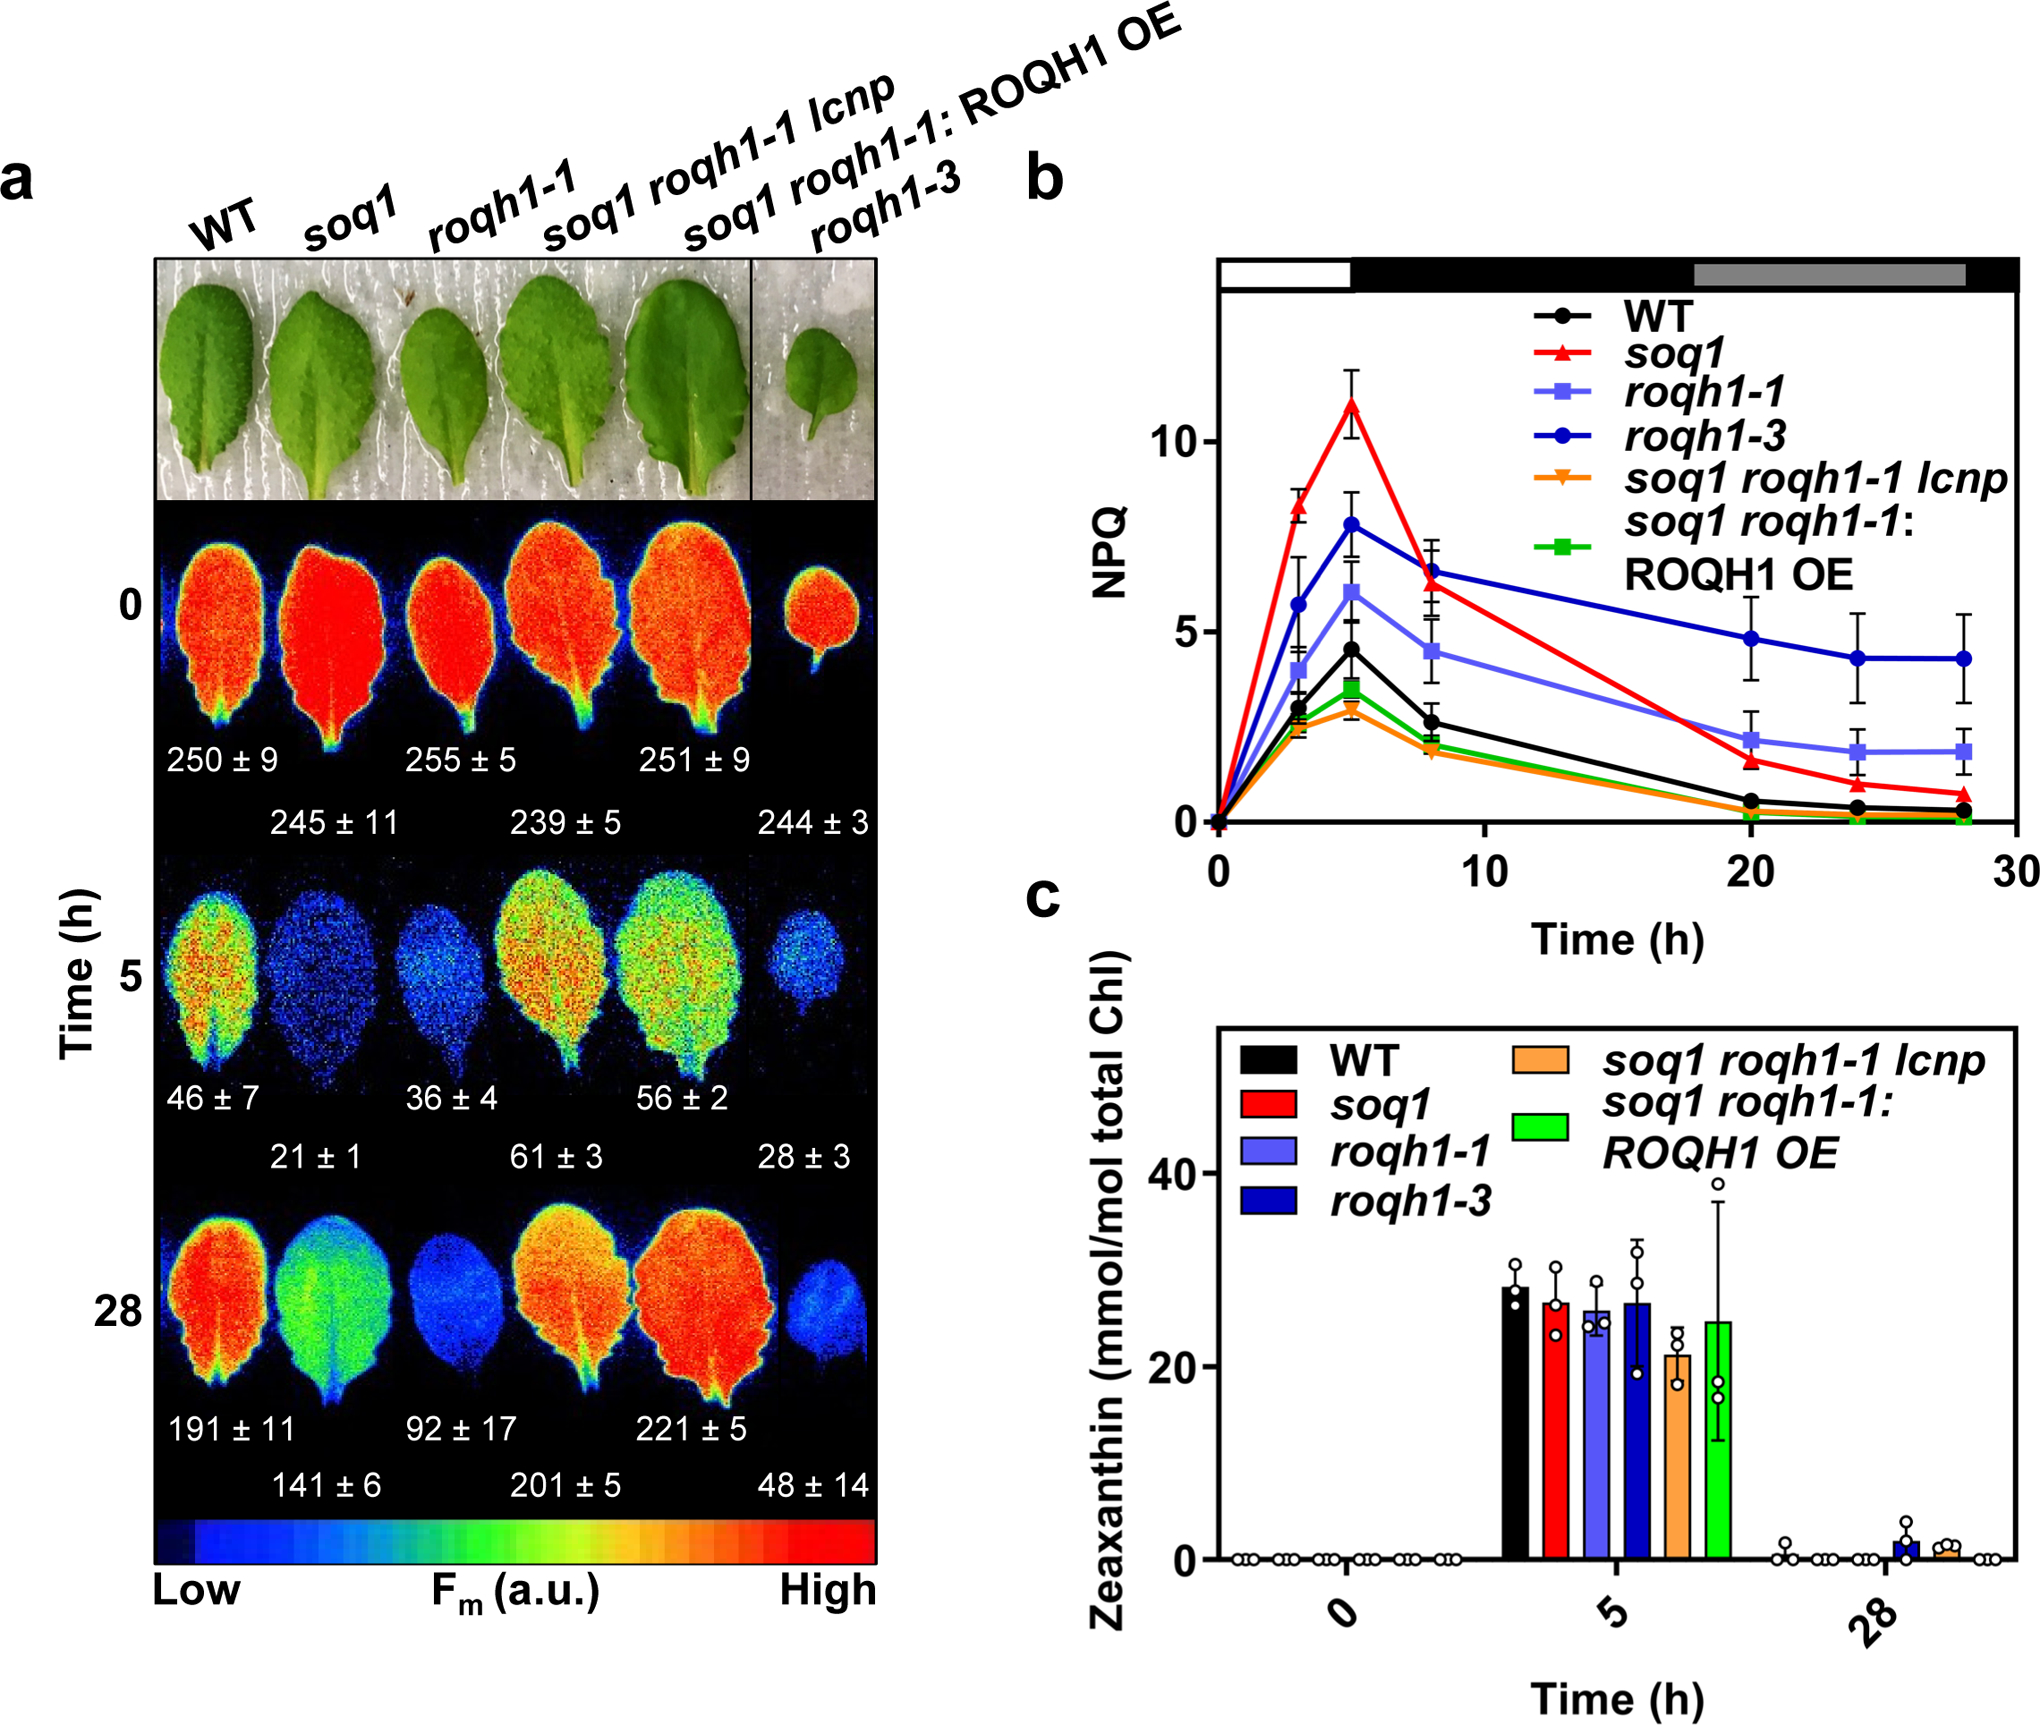
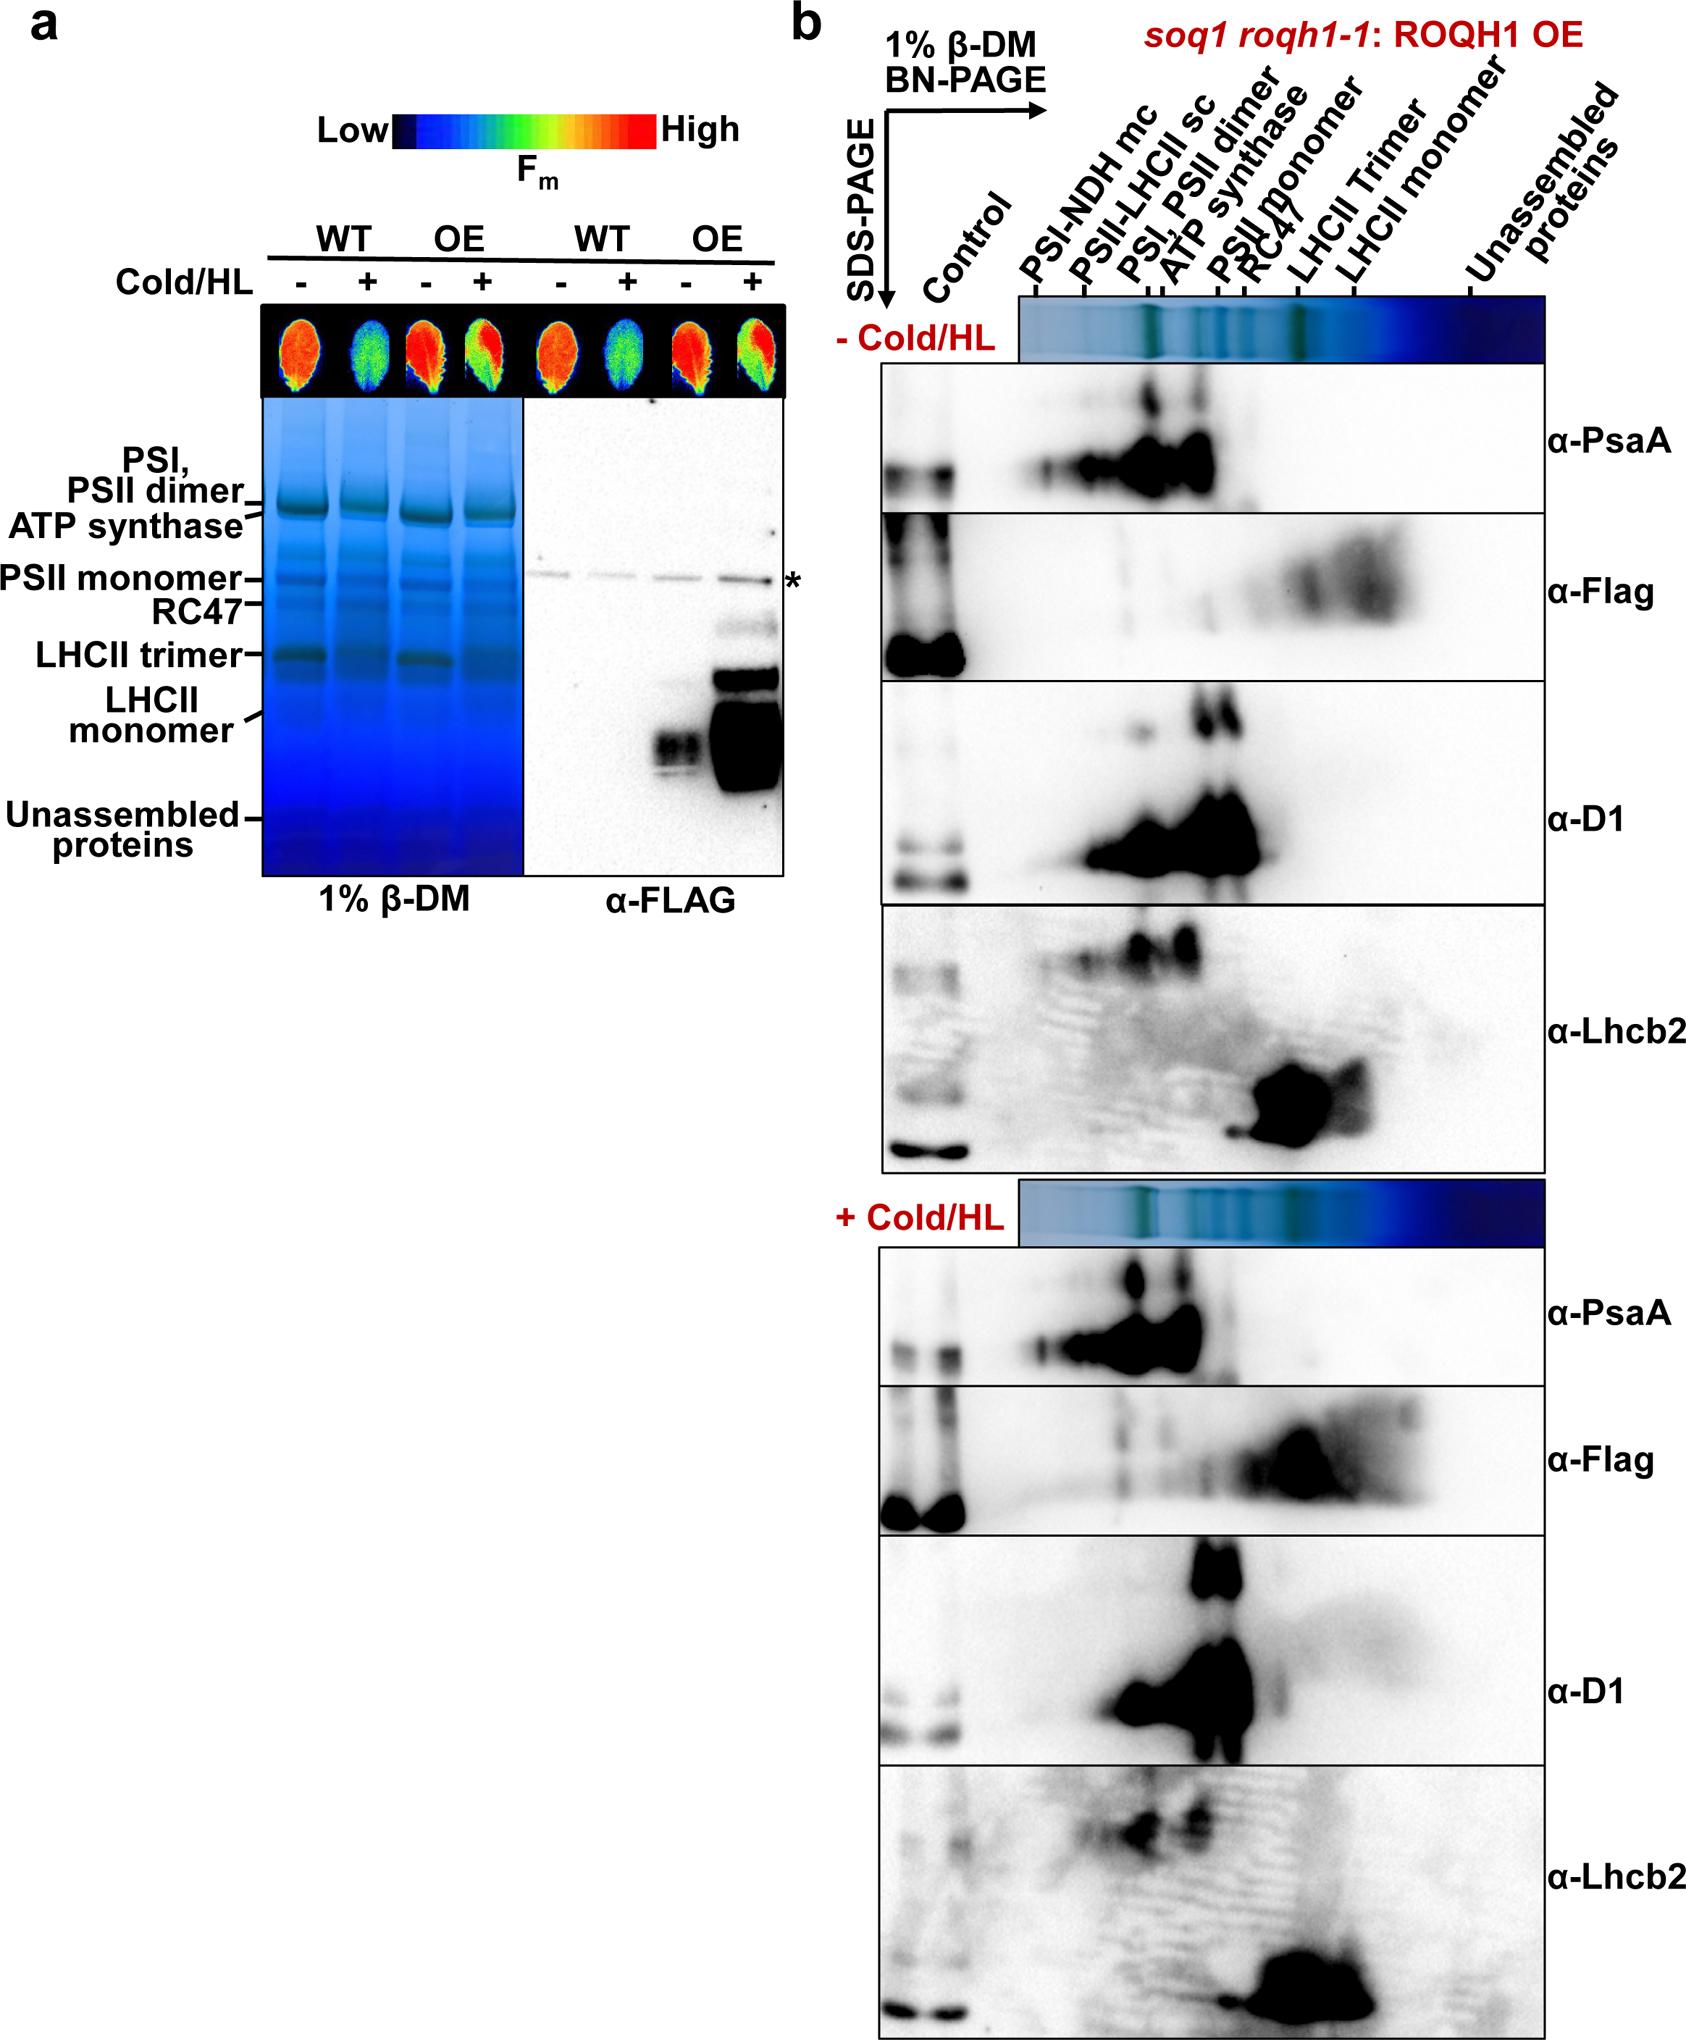
Photosynthetic organisms experience wide fluctuations in light intensity and regulate light harvesting accordingly to prevent damage from excess energy. The antenna quenching component qH is a sustained form of energy dissipation that protects the photosynthetic apparatus under stress conditions. This photoprotective mechanism requires the plastid lipocalin LCNP and is prevented by SUPPRESSOR OF QUENCHING1 (SOQ1) under non-stress conditions. However, the molecular mechanism of qH relaxation has yet to be resolved. Here, we isolated and characterized RELAXATION OF QH1 (ROQH1), an atypical short-chain dehydrogenase-reductase that functions as a qH-relaxation factor in Arabidopsis. The ROQH1 gene belongs to the GreenCut2 inventory specific to photosynthetic organisms, and the ROQH1 protein localizes to the chloroplast stroma lamellae membrane. After a cold and high-light treatment, qH does not relax in roqh1 mutants and qH does not occur in leaves overexpressing ROQH1. When the soq1 and roqh1 mutations are combined, qH can neither be prevented nor relaxed and soq1 roqh1 displays constitutive qH and light-limited growth. We propose that LCNP and ROQH1 perform dosage-dependent, antagonistic functions to protect the photosynthetic apparatus and maintain light-harvesting efficiency in plants.


Conflict of interest statement

Competing interest statement

The authors have no competing interests as defined by Nature Research, or other interests that might be perceived to influence the results and/or discussion reported in this paper.

Figures

Extended Figure 1.
Extended Figure 1.. ROQH1 is enriched at the chloroplast stroma lamellae.
Proteins were separated by SDS-PAGE and analyzed by immunodetection with antibodies against ROQH1, Rubisco, Lhcal, Lhcb2, D2, or PsaD. Coomassie blue (CB) or Ponceau are shown as loading controls. Molecular masses (kD) are indicated according to the migration of Precision Plus Protein Standards markers from Bio-Rad. Total leaf extract (Leaf) from plants grown under 120 μmol photons m−2 s−1, 21°C were fractionated into chloroplasts, thylakoids, grana (appressed membranes), grana margins, stroma, and stroma lamellae (non-appressed membranes). Proteins were separated by SDS-PAGE and analyzed by immunodetection with antibodies against ROQH1, Rubisco, Lhca1, Lhcb2, D2, or PsaD. Coomassie blue (CB) or Ponceau are shown as loading controls. Molecular masses (kD) are indicated according to the migration of Precision Plus Protein Standards markers from Bio-Rad. Samples were loaded by equal total chlorophyll content (3 μg). Immunoblot is representative of 5 biologically independent experiments.
Extended Figure 2.
Extended Figure 2.. ROQH1 functions in a complex after cold and high light.
Two-dimensional BN/SDS-PAGE analysis from wild-type thylakoids isolated before (−) and after (+) a 5 h cold and high light treatment (6°C and 1,600 μmol photons m−2 s−1), solubilized with 1% β-DM and immunoblotted with antibodies for Flag, PsaA, D1, and Lhcb2. For an internal loading control, 1 μg total chlorophyll of solubilized soq1 roqh1–1: ROQH1 OE thylakoids was loaded in the control lane. Immunoblots are representative of 2 biologically independent experiments.
Extended Figure 3.
Extended Figure 3.. ROQH1 is required to turn off qH.
Under non-stress conditions, SOQ1 inhibits LCNP activity. Under stress conditions, such as cold and high light, SOQ1 inhibition is relieved (grey dashed line) and LCNP is active. Quenching sites indicated by purple color are produced in the peripheral antenna directly mediated by LCNP (solid arrow) or indirectly (dashed arrow) through LCNP modification of LHCII hydrophobic environment. ROQH1 recycle these quenching sites back to light harvesting sites either directly by acting at the antenna (solid line) or indirectly through modification of LHCII hydrophobic environment (dashed line). Adapted from ref.
Figure 1.
Figure 1.. Genetic screen uncovered mutants with constitutively quenched fluorescence.
(a) Image of plants and false-colored image of maximum fluorescence (Fm) of 4-week-old soq1 npq4, soq1 npq4 roqh1–1 (#164), and soq1 npq4 roqh1–2 (#108) grown under 150 μmol photons m-2 s-1, 21°C. Average Fo, Fm, and Fv/Fm values ± SD are given with n = 5 individuals. (b) NPQ kinetics of 5-week-old plants. Induction at 1,200 μmol photons m-2 s-1 (white bar) and relaxation in the dark (black bar). Data represent means ± SD, n = 3 individuals. (c) Total chlorophyll and (d) zeaxanthin levels determined by HPLC analysis of 4-week-old plants under standard light conditions (150 μmol photons m-2 s-1) and after a 30-min high light treatment (1,000 μmol photons m-2 s-1) to induce zeaxanthin accumulation. Under standard light conditions, zeaxanthin accumulation isbelow detection limit of 0.15pmol. Tukey’s multiple comparison test shows a significant increase in chlorophylllevels of soq1 npq4 roqh1–1 (#164) compared to soq1 npq4 and soq1 npq4 roqh1–2 (#108). Data shownrepresents means ± SD, n = 3 individuals, * = p-value 0.0103.
Figure 2.
Figure 2.. Schematic representation of ROQH1 protein and accumulation in roqh1 mutants.
(a) Schematic representation of ROQH1 protein with positions of mutations. Predicted chloroplast transit peptide (cTP; light grey) suggesting a mature size of 29 kD, Rossmann-fold (grey), NAD(P)-binding motif (GXXGXXG; black), and partial catalytic tetrad of residues (D-SVXXXK; black lines). Numbers indicate amino acid positions and arrows indicate mutations. ROQH1–G81D (roqh1–1) and ROQH1–G211E (roqh1–2) from suppressor mutants #164 and #108, respectively; KO, knock-out mutant allele from T-DNA insertion (roqh1–3). (b) Total leaf extract from plants grown under 150 μmol photons m-2 s-1, 21°C. Samples were loaded by equal total chlorophyll content (2.5 μg). Proteins were separated by SDS-PAGE and analyzed by immunodetection with antibodies against ROQH1, Rubisco, Lhca1, Lhcb2, D2, or PsaD. Coomassie blue (CB) or Ponceau are shown as loading controls. Molecular masses (kD) are indicated according to the migration of Precision Plus Protein Standards markers from Bio-Rad. The appearance of two bands in roqh1–1 (100) and roqh1–2 (100) are most likely due to protein shadowing by the LHC proteins, as only one band is present in the diluted (50) sample. Immunoblot is representative of 3 biologically independent experiments.
Figure 3.
Figure 3.. Constitutive quenching is due to the combination of soq1 and roqh1 mutations.
Images of plants and false-colored images of maximum fluorescence (Fm) of detached leaves from 5-week-old plants grown under 150 μmol photons m−2 s−1, 21°C. Average Fo, Fm, and Fv/Fm values ± SD are given with n = 5 individuals for each genotype.
Figure 4.
Figure 4.. Constitutively quenched mutants are light-limited.
(a) Pigment composition determined by HPLC analysis of 6-week-old plants, grown under standard light conditions (120 μmol photons m-2 s-1, 21°C). Under standard light conditions, zeaxanthin accumulation is below detection limit of 0.15pmol. Tukey’s multiple comparison test shows a significant increase in neoxanthin and chlorophyll b and a significant decrease in chlorophyll a and β-carotene in soq1 roqh1–1 and soq1 roqh1–3 compared to wild type. **** = p-value 0.0001, *** = p-value 0.0007, ** = p-value 0.006, * = p-value 0.0321. Average values ± SD are given with n = 3 individuals per genotype. (b) Image of 5-week-old plants grown under low (100 μmol photons m-2 s-1) or high (1,300 μmol photons m-2 s-1) light. Image is representative of 3 biologically independent experiments. (c) Rosette dry weight harvested from plants indicated in (b). Average values ± SD are given with n = 8 individuals. Note the log scale Y-axis. (d) Microscopy images of leaf cross-sections at the mid-vein. Plants are 6–7 weeks old grown under 150 μmol photons m-2 s-1, 21°C. Scale bar represents 100 μm. Images are representative cross-sections from 2 biologically independent experiments.
Figure 5.
Figure 5.. Constitutive quenching requires the peripheral antenna of PSII and LCNP.
(a) and (b) Images of plants and false-colored images of maximum fluorescence (Fm) of detached leaves from 6-week-old plants grown under standard growth conditions (120 μmol photons m-2 s-1, 21°C). Average Fo, Fm, and Fv/Fm values ± SD are given with n = 3 individuals for each genotype. (c) Pigment composition determined by HPLC analysis of 6-week-old plants grown under standard growth conditions (120 μmol photons m-2 s-1, 21°C). Under standard light conditions, zeaxanthin accumulation is below detection limit of 0.15pmol. Tukey’s multiple comparison test shows a significant increase in neoxanthin and chlorophyll b and a significant decrease in chlorophyll a and β-carotene in soq1 roqh1–1 but not in soq1 roqh1–1 lcnp. **** = p-value 0.0001, ** = p-value 0.0036. Average values ± SD are given with n = 3 individuals per genotype.
Figure 6.
Figure 6.. Overexpression of ROQH1 prevents qH from occurring.
Plants 1–4 of soq1 roqh1–1: ROQH1 OE corresponds to individuals from T2-T1-4. Additional independent lines can be found in Supplemental Figure 7. (a) Isolated whole cells from 6.5-week-old plants grown under 120 μmol photons m-2 s-1. Samples were loaded by same leaf area, separated by SDS-PAGE, and analyzed by immunodetection with antibodies against ROQH1, SOQ1 and FLAG. Coomassie blue (CB) is shown as loading control. Molecular masses (kD) are indicated according to the migration of Precision Plus Protein Standards markers from Bio-Rad. Wild type ROQH1 signal is weak to prevent overexposure of soq1 roqh1–1: ROQH1 OE. Immunoblot is representative of 3 biologically independent experiments and consistent with additional independent lines and quantification immunoblots found in Supplementary Figures 7 and 12. (b) Images of 7-week-old plants grown under 120 μmol photons m-2 s-1. This OE line was used for all further experiments and phenotype was consistent throughout all experiments. (c) NPQ kinetics of WT, soq1, roqh1–1 and soq1 roqh1–1: ROQH1 OE. Induction at 1,200 μmol photons m-2 s-1 (white bar) and relaxation in the dark (black bar). Data shown represents means ± SD, n = 3 individuals.
Figure 7.
Figure 7.. ROQH1 is required for relaxation of qH.
Detached leaves from 5-week-old plants grown under standard light conditions (150 μmol photons m-2 s-1, 21°C) were subjected to a cold and high light treatment (white bar) of 6°C and 1,600 μmol photons m-2 s-1 for 5 hours, and a recovery treatment of 150 μmol photons m-2 s-1 and a 10 h/14 h day/night cycle at 21°C (black, night period and grey, day period bars) for 28 hours. (Aa Images of detached leaves and false-colored images of maximum fluorescence (Fm) of detached leaves before the cold and high light treatment (Time 0), after the cold and high light treatment (Time 5) and after a recovery period (Time 28). Leaves were dark-adapted for 10 minutes before fluorescence measurement to relax qE. Additional leaves between soq1 roqh1–1: ROQH1 OE and roqh1–3 were cropped out for simplicity, and an uncropped image can be found in Supplemental Figure 13. Average Fm values ± SD are given with n = 4 individuals from two biologically independent experiments. (b) NPQ kinetics calculated as (Fm Time 0 - Fm’)/Fm’ throughout the cold, high light and recovery treatment indicated in (a). Data represent means ± SD, n = 4 individuals. (c) Zeaxanthin levels before the cold and high light treatment (Time 0), after the cold and high light treatment (Time 5) and after a recovery period (Time 28). Tukey’s multiple comparison test shows no significant difference in zeaxanthin levels among wild type and mutants before or after treatments. Data shown represents means ± SD, n = 3 individuals.
Figure 8.
Figure 8.. ROQH1 functions in a complex after cold and high light.
(a) BN-PAGE analysis of thylakoids isolated from 5-week-old wild type and soq1 roqh1–1: ROQH1 OE plants before (−) and after (+) a 5 h cold and high light treatment (6°C and 1,600 μmol photons m-2 s-1), solubilized with 1% β-DM and immunoblotted with a Flag antibody to detect ROQH1-Flag. Asterisk denotes nonspecific band detected by Flag antibody. Thylakoids were loaded based on 8 μg total chlorophyll. Immunoblot is representative of 3 biologically independent experiments. (b) Two-dimensional BN/SDS-PAGE analysis from thylakoids isolated from soq1 roqh1–1: ROQH1 OE before (−) and after (+) a 5 h cold and high light treatment (6°C and 1,600 μmol photons m-2 s-1), solubilized as indicated in (a), and immunoblotted with antibodies for Flag, PsaA, D1, and Lhcb2. For an internal loading control, 1 μg total chlorophyll of solubilized soq1 roqh1–1: ROQH1 OE thylakoids was loaded in the control lane. Two-dimensional BN/SDS-PAGE analysis from thylakoids isolated from wild type can be found in Extended Figure 2. Immunoblots are representative of 2 biologically independent experiments.

References

    1. Niyogi KK Photoprotection revisited: Genetic and molecular approaches. Annu. Rev. Plant Physiol. Plant Mol. Biol 50, 333–359 (1999). - PubMed
    1. Demmig-Adams B & Adams WW III Photoprotection and other responses of plants to high light stress. Annu. Rev. Plant Phvsiol. Plant Mol. Bioi 43, 599–626 (1992).
    1. Walters RG & Horton P Resolution of components of non-photochemical chlorophyll fluorescence quenching in barley leaves. Photosynth. Res 27, 121–133 (1991). - PubMed
    1. Malnoë A Photoinhibition or photoprotection of photosynthesis, which one is it? Update on newly termed sustained quenching component, qH. Environ. Exp. Bot (2018). doi:10.1016/j.envexpbot.2018.05.005 - DOI
    1. Li X-P et al. Regulation of photosynthetic light harvesting involves intrathylakoid lumen pH sensing by the PsbS protein. J. Biol. Chem 279, 22866–22874 (2004). - PubMed

Publication types

MeSH terms