. 2019 Dec;20(12):5867-5895.
doi: 10.1029/2019GC008329. Epub 2019 Dec 6.

Postmagmatic Tectonic Evolution of the Outer Izu-Bonin Forearc Revealed by Sediment Basin Structure and Vein Microstructure Analysis: Implications for a 15 Ma Hiatus Between Pacific Plate Subduction Initiation and Forearc Extension

Affiliations

Postmagmatic Tectonic Evolution of the Outer Izu-Bonin Forearc Revealed by Sediment Basin Structure and Vein Microstructure Analysis: Implications for a 15 Ma Hiatus Between Pacific Plate Subduction Initiation and Forearc Extension

W Kurz et al. Geochem Geophys Geosyst. 2019 Dec.

Abstract

International Ocean Discovery Program Expedition 352 recovered sedimentary-volcaniclastic successions and extensional structures (faults and extensional veins) that allow the reconstruction of the Izu-Bonin forearc tectonic evolution using a combination of shipboard core data, seismic reflection images, and calcite vein microstructure analysis. The oldest recorded biostratigraphic ages within fault-bounded sedimentary basins (Late Eocene to Early Oligocene) imply a ~15 Ma hiatus between the formation of the igneous basement (52 to 50 Ma) and the onset of sedimentation. At the upslope sites (U1439 and U1442) extension led to the formation of asymmetric basins reflecting regional stretch of ~16-19% at strain rates of ~1.58 × 10⁻¹⁶ to 4.62 × 10⁻¹⁶ s-1. Downslope Site U1440 (closer to the trench) is characterized by a symmetric graben bounded by conjugate normal faults reflecting regional stretch of ~55% at strain rates of 4.40 × 10⁻¹⁶ to 1.43 × 10⁻¹⁵ s-1. Mean differential stresses are in the range of ~70-90 MPa. We infer that upper plate extension was triggered by incipient Pacific Plate rollback ~15 Ma after subduction initiation. Extension was accommodated by normal faulting with syntectonic sedimentation during Late Eocene to Early Oligocene times. Backarc extension was assisted by magmatism with related Shikoku and Parece-Vela Basin spreading at ~25 Ma, so that parts of the arc and rear arc, and the West Philippine backarc Basin were dismembered from the forearc. This was followed by slow-rift to postrift sedimentation during the transition from forearc to arc rifting to spreading within the Shikoku-Parece-Vela Basin system.

Keywords: Expedition 352; International Ocean Discovery Program (IODP); Izu ‐ Bonin forearc; faulting and extension; hiatus; syntectonic sedimentation.


Figures

Figure 1
Figure 1
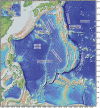
Location map for IODP Expeditions 352, 351, and 350, showing the Izu‐Bonin‐Mariana arc system along the western Pacific margin and the Philippine Sea Plate backarc basins. Red dots show location of the Expedition 352 drill sites; orange and yellow dot shows the drill site for Sister Expeditions 351 and 350, respectively.
Figure 2
Figure 2
Prestack time migrated images, converted to depth, showing the location of drill sites (after Christeson et al., 2016). (a) Upper forearc basin Sites U1439 and U1442. (b) Lower forearc basin site U1441. (c) Lower forearc basin site U1440. Images are plotted with a 0.5 s automatic gain control, without exaggeration. Sedimentary and basement units at the drill sites are indicated by green and orange lines, respectively; the sedimentary cover is displayed in pale yellow. Interpretation: green lines represent the sediment‐basement interface, the orange lines the change in dip (unconformities) within sedimentary sections, and red lines = normal faults. CDP: Common depth point.
Figure 3
Figure 3
(after Twiss & Moores, 2007): (a) Geometric relationships of equally spaced planar, rotating high‐angle normal faults above a (hypothetical) detachment; ϕ: fault dip angle, θ: sediment dip angle, d: displacement, l 0: initial bed length; and x: maximum basin depth (sedimentary cover thickness). (b) Geometric relationship of conjugate, nonrotating high‐angle normal faults; ϕ: fault dip angle, d: displacement, l 0: initial bed length, Δl 1,2: fault‐related extension.
Figure 4
Figure 4
(a) Highly altered boninite, transected by an ultracataclastic shear zone and by subvertical calcite veins (marked by black arrows), with mineralized hybrid fractures (white arrows); IODP Expedition 352, Hole U1439C, Core 27R, Section 1A, 100–118 cm. (b) Cataclastic fault with fault breccia; top down displacement (normal sense of shear); IODP Expedition 352‐U1439C‐43R‐1A‐25‐41 cm. (c) Foliated alteration zone (brownish) within FAB, characterized by microfracturing, microbrecciation, and formation of secondary chlorite, calcite, clay minerals and opaque phases (microphotograph with parallel polarizers); IODP Expedition352, Hole U1440B, Core 35R, Section 1, 29–39 cm; and (d) Microphotograph (parallel polarizers) of ultramylonitic, semiductile to brittle shear zone; the ultramylonite consists of kryptocrystalline calcium carbonate with single clasts of calcite (with related Raman spectrum) and brownish amorphic volcanic glass; C′ shear bands indicate top down (normal) sense of shear; IODP Expedition352‐ U1441A‐20R‐1‐16‐18 cm. Figures 4a–4c are cutouts from shipboard core close‐up images taken by Tim Fulton (provided by International Ocean Discovery Program [IODP] and JOIDES Resolution Science Operator [JRSO]).
Figure 5
Figure 5
(a) Single calcite vein (marked by arrow); IODP Expedition 352, Hole U1440B, Core36R, Section 1, 116–128 cm. (b) Fragmented boninite with multiple cracks accompanied by dark alteration seams, and a single tapered calcite vein (marked by arrow); this opened as a tension gash along releasing bend with top down kinematics; IODP Expedition 352‐U1442A‐30R‐3A‐106‐115 cm. (c) Conjugate hybride fractures (marked by arrows) within boninite, filled with calcite; IODP Expedition 352‐U1439C‐41R‐1A‐81‐90 cm. (d) Horsetail calcite veins and splays associated with distinct single sets of shear fractures with top down displacement within boninite; the discrete tension gashes were formed along shear fractures; IODP Expedition 352‐U1439C‐23R‐2W‐14‐26 cm. (e) Complex multiple carbonate vein network resulting from hydrofracturing within altered boninite; discrete boninite fragments (marked by arrow) are embedded in vein precipitates; IODP Expedition 352‐U1439C‐4R‐1A‐108‐117 cm. (f) Hydraulic breccia of Forearc Basalt (FAB), cemented by calcite precipitate; IODP Expedition 352‐ U1440B‐19R‐1A‐84‐94 cm. Figures are cutouts from shipboard core close‐up images taken by Tim Fulton; (provided by International Ocean Discovery Program [IODP] and JOIDES Resolution Science Operator [JRSO]).
Figure 6
Figure 6
Microphotographs (crossed polarizers) showing representative vein microstructures: (a) Blocky calcite vein within boninite; average calcite grain size is 0.7 mm; Sample 352‐U1439C‐26R‐2‐W 9/11‐KURZ. (b) Irregular blocky calcite vein with boninite fragments embedded in vein minerals; average calcite grain size is 0.3 mm; Sample 352‐U1439C‐29R‐4‐W 60/63‐KURZ. (c) Blocky calcite with thin type I and thicker Type II twins and subgrain (SG) formation; Sample 351‐U1438E‐79R‐2‐W 111/114. (d) Blocky calcite vein within boninite with thick Type II twins; Sample 352‐U1439C‐23R‐2‐W 15/21‐KURZ. (e) Bent and tapered Type II twins; calcite host shows undulatory extinction; Sample 352‐U1439C‐26R‐2‐W 9/11‐KURZ. (f) Bent Type I and II twins; calcite host shows undulatory extinction; Sample 351‐U1438E‐82R‐2‐W 43/52.
Figure 7
Figure 7
Microphotographs (crossed polarizers) showing representative vein microstructures: (a) Subgrains (SG) within blocky calcite; average subgrain size is 0.15 mm; Sample 352‐U1439C‐26R‐1‐W 110/120‐KURZ. (b) Undulatory (Ud) extinction of calcite and subgrains (SG) within blocky calcite; average subgrain size is 0.1 mm; Sample 351‐U1438E‐79R‐2‐W 111/114.
Figure 8
Figure 8
Differential stress data after Rybacki et al. (2011) versus borehole depth for site U1439C; error bars indicate 2σ standard deviation.
Figure 9
Figure 9
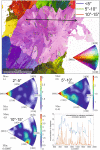
Results of EBSD mapping for Sample ASB‐3. Vein calcite contains several grains with internal subgrains. Subgrains are displayed by color gradient with a tolerance angle of 2°; the color coding of grains refers to the orientation of crystallographic axes of a hypothetical single crystal. Subgrain boundaries with misorientation angles of <5°, 5–10°, and 10–15° are marked by blue, green, and red lines, respectively. The black arrow indicates the direction of the misorientation profiles. Misorientation profile: the blue line represents point to origin and the red line point to point misorientation angles. Color‐coded map (inverse pole figure map): low angle boundaries (red and blue lines), and high angle boundaries (black line). Misorientation axes are shown in countered inverse pole figures (IPF) for misorientations of 2° to 5°, 5–10°, and 10–15°. For exact sample locations see Table 1.
Figure 10
Figure 10
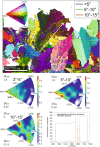
Results of EBSD mapping for Sample BON‐9. For legend and explanation see figure captions at Figure 9. For exact sample locations see Table 1.
Figure 11
Figure 11
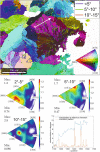
Results of EBSD mapping for Sample FAB‐3. For legend and explanation see figure captions at Figure 9. For exact sample locations see Table 1.
Figure 12
Figure 12
Diagram, after De Bresser and Spiers (1997) summarizing the intracrystalline deformation mechanism of calcite. The gray box displays the range of obtained differential stresses; the corresponding range of deformation temperature was acquired from different twin parameters according the classifications after Ferrill et al. (2004) and Burkhard (1993), and also the host rock alteration mineral assemblages described by Reagan et al. (2015). Mechanical e‐twinning occurs at low CRSS and at proportional low temperatures. With increasing differential stresses and/or strain rates, f and r slip and subgrain formation is enabled.
Figure 13
Figure 13
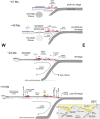
Schematic cross sections illustrating the evolution of the Philippine Sea plate near the latitude of IODP Expedition 352, based on Stern and Bloomer (1992), Ishizuka et al. (2006), Ishizuka, Tani, et al. (2011), Ishizuka, Taylor, et al., 2011), Wu et al. (2016), Brandl et al. (2017), Reagan et al. (2017), Faccenna et al. (2018), Ishizuka et al. (2018), Reagan et al. (2019), and this work. Not to scale. FAB (in red) = forearc basalt crust; Bon (in pink) = boninite crust; prearc crust is in blue; Arc = arc lavas with basaltic parents; OT = Ogasawara Trough. IODP Expedition 351 and 352 drill sites are shown on the <10 Ma panel. 51 Ma—approximately 1.5 Myr after subduction initiation and production of near‐trench FAB to Bon crust. 45Ma = backarc spreading at about the time that parental arc magmas transition from boninite to basalt. Initiation of spreading was at about 50 Ma while high‐Si boninite was erupting along the Ogasawara Ridge. At 24 Ma volcanism along the Kyushu‐Palau Ridge waned whereas the Shikoku Basin began to spread. Augmented subduction rollback and related trench retreat commenced when the Pacific slab reached the 660 km mantle discontinuity, from ~35 Ma onward. From <10 Ma steady state volcanism occurred along the present Izu‐Bonin volcanic arc. The inset shows the general tectonic and basin structure of the local forearc area, that is, normal faulting along cataclastic to semiductile shear zones, (half‐) grabens, and related synrift (Time Slice 1) and postrift (Time Slice 2) sedimentation, with an unconformity at ~27–23 Ma.

References

    1. Allerton, S. , & Vine, F. J. (1990). Palaeomagnetic and structural studies of the southeastern part of the Troodos complex In Malpas J., Moores E. M., Panayiotou A., & Xenophontos C. (Eds.), Ophiolites: Oceanic crustal analogues (pp. 99–111). Nicosia: Cyprus Geological Survey Department.
    1. Arculus, R. J. , Ishizuka, O. , Bogus, K. , & the Expedition 351 Scientists (2015). Proceedings of the International Ocean Discovery Program, Expedition 351: Izu‐Bonin‐Mariana Arc Origins. College Station, TX: International Ocean Discovery Program; 10.14379/iodp.proc.351.2015 - DOI
    1. Arculus, R. J. , Ishizuka, O. , Bogus, K. A. , Gurnis, M. , Hickey‐Vargas, R. , Aljahdali, M. H. , Bandini‐Maeder, A. N. , Barth, A. P. , Brandl, P. A. , Drab, L. , do Monte Guerra, R. , Hamada, M. , Jiang, F. , Kanayama, K. , Kender, S. , Kusano, Y. , Li, H. , Loudin, L. C. , Maffione, M. , Marsaglia, K. M. , McCarthy, A. , Meffre, S. , Morris, A. , Neuhaus, M. , Savov, I. P. , Sena, C. , Tepley, F. J. III , van der Land, C. , Yogodzinski, G. M. , & Zhang, Z. (2015). A record of spontaneous subduction initiation in the Izu‐Bonin‐Mariana arc. Nature Geoscience, 8(9), 728–733. 10.1038/ngeo2515 - DOI
    1. Bachmann, F. , Hielscher, R. , Jupp, P. E. , Pantleon, W. , Schaeben, H. , & Wegert, E. (2010). Inferential statistics of EBSD data from within individual crystalline grains. Journal of Applied Crystallography, 43(6), 1338–1355. 10.1107/S002188981003027X - DOI
    1. Barth, A. P. , Tani, K. , Meffre, S. , Wooden, J. L. , Coble, M. A. , Arculus, R. J. , Ishizuka, O. , & Shukle, J. T. (2017). Generation of silicic melts in the early Izu‐Bonin Arc recorded by detrital zircons in proximal arc volcaniclastic rocks from the Philippine Sea. Geochemistry, Geophysics, Geosystems, 18, 3576–3591. 10.1002/2017GC006948 - DOI

LinkOut - more resources