. 2019 Sep 4;10(43):10003-10009.
doi: 10.1039/c9sc03694f. eCollection 2019 Nov 21.

Chiroptical inversion of a planar chiral redox-switchable rotaxane

Affiliations

Chiroptical inversion of a planar chiral redox-switchable rotaxane

Marius Gaedke et al. Chem Sci. .

Abstract

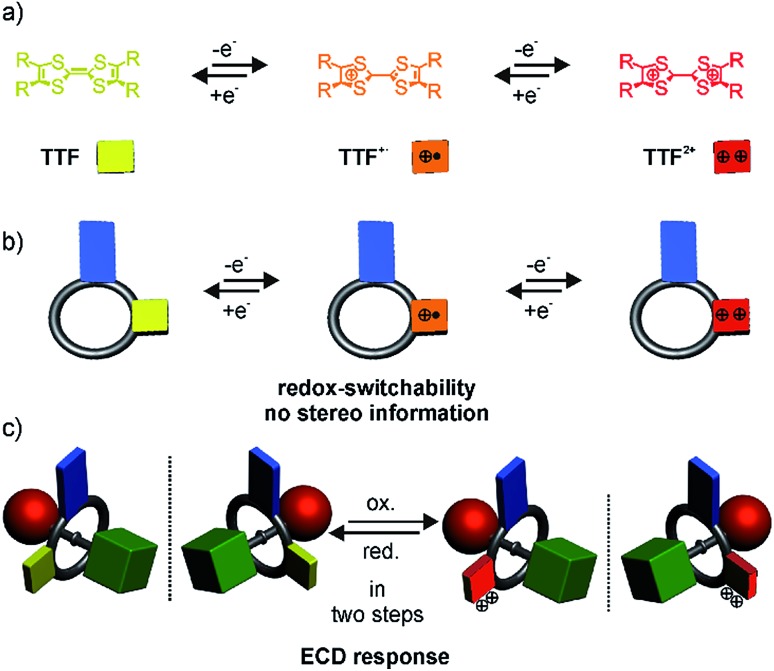
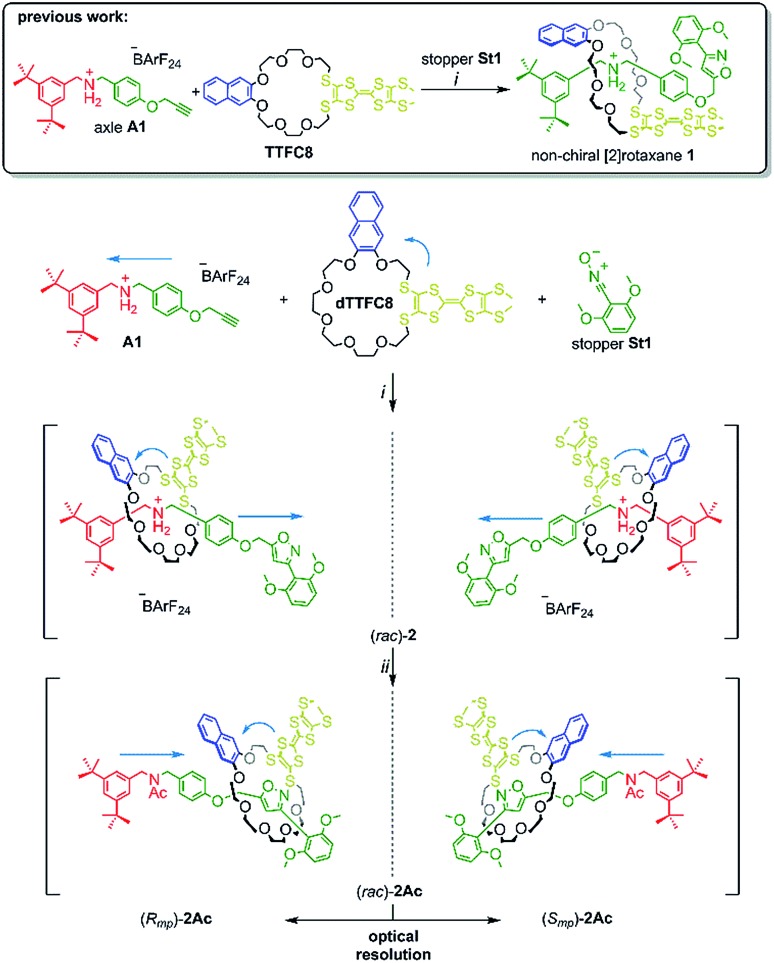
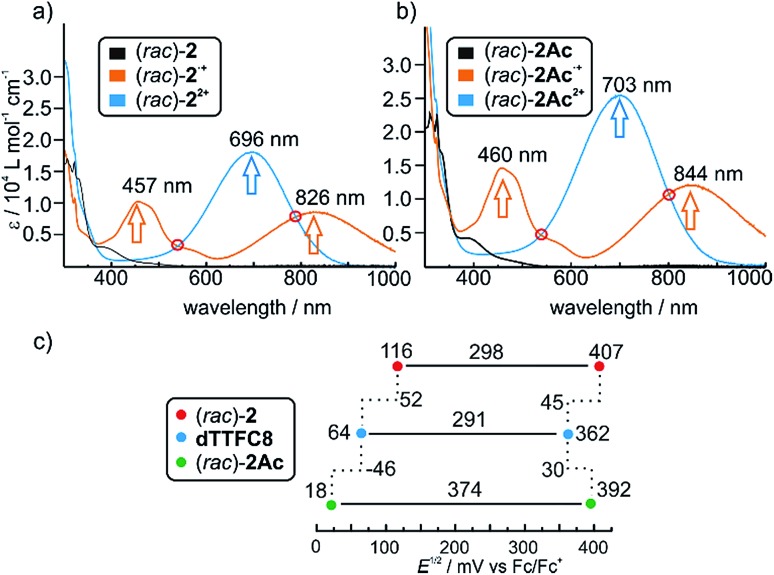
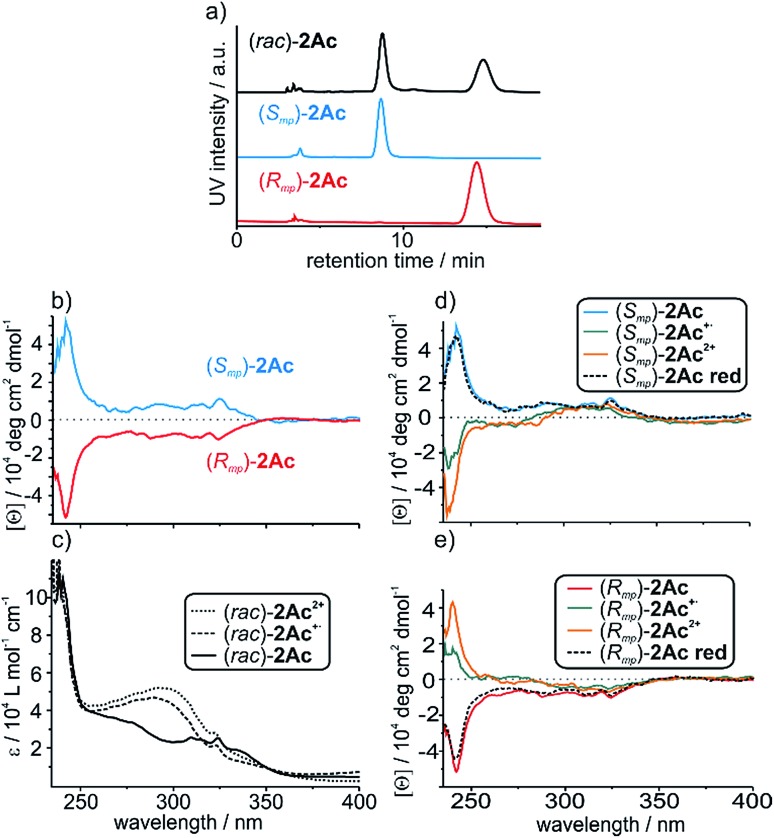
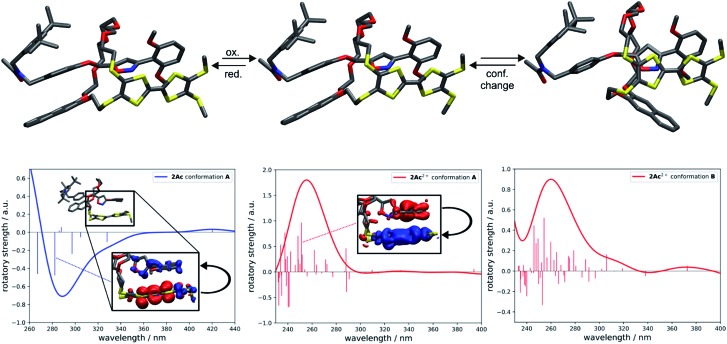
A tetrathiafulvalene (TTF)-containing crown ether macrocycle with C s symmetry was designed to implement planar chirality into a redox-active [2]rotaxane. The directionality of the macrocycle atom sequence together with the non-symmetric axle renders the corresponding [2]rotaxane mechanically planar chiral. Enantiomeric separation of the [2]rotaxane was achieved by chiral HPLC. The electrochemical properties - caused by the reversible oxidation of the TTF - are similar to a non-chiral control. Reversible inversion of the main band in the ECD spectra for the individual enantiomers was observed after oxidation. Experimental evidence, conformational analysis and DFT calculations of the neutral and doubly oxidised species indicate that mainly electronic effects of the oxidation are responsible for the chiroptical switching. This is the first electrochemically switchable rotaxane with a reversible inversion of the main ECD band.


Figures

Scheme 1
Scheme 1. (a) Reversible one-electron oxidations of the TTF moiety, (b) reversible oxidation of a directional crown ether wheel bearing a TTF unit, (c) chiroptical switching of the planar chiral [2]rotaxane enantiomers.
Scheme 2
Scheme 2. Synthesis of rotaxanes (rac)-2 and (rac)-2Ac. Conditions and reagents: (i) DCM, 35 °C, 12 h (73%); (ii) Ac2O, NEt3, ACN, 12 h, r.t. (95%).
Fig. 1
Fig. 1. Comparison of the shifts and splitting in the partial 1H NMR spectra of the methylene groups on the axle A1 (top), rotaxane (rac)-2 (middle) and acetylated rotaxane (rac)-2Ac (bottom) (700 MHz, 298 K, CD2Cl2).
Fig. 2
Fig. 2. UV/Vis spectra of (a) ionic (rac)-2 and (b) non-ionic (rac)-2Ac in different oxidation states. Isosbestic points indicating a clean transition from TTF˙+ to TTF2+ are highlighted with red circles. Spectra were obtained with 25 μM solutions in CH2Cl2 using bulk Fe(ClO4)3 as the oxidant; (c) correlation diagram of half-wave potentials obtained by cyclic voltammetry for the first and second redox process of (rac)-2, dTTFC8 and (rac)-2Ac (each 1 mM) in CH2Cl2 referenced against Fe(Cp)20/+ with NBu4PF6 (0.1 M) as the electrolyte.
Fig. 3
Fig. 3. (a) Traces of analytical chiral HPLC. The chromatographic resolution of (rac)-2Ac was realised by chiral phase HPLC on a CHIRALPAK® IA column using methyl tert-butylether/CH2Cl2 80 : 20 (v/v) as the eluent. (b) CD spectra of the individual neutral enantiomers and (c) partial UV/Vis spectra of the neutral, singly and doubly oxidized (rac)-2Ac. (d and e) CD spectra of the individual enantiomers in their three oxidation states and after reduction to the neutral state. Spectra were taken from 160 μM solutions in CH2Cl2 using bulk Fe(ClO4)3 as the oxidant and Zn dust as the reductant.
Fig. 4
Fig. 4. Structural and spectral comparison of the most stable conformation of (Rmp)-2Ac and the two most stable conformations, A and B, of (Rmp)-2Ac2+. Oxidation induces a flip of the naphthalene moiety in A towards the TTF unit yielding conformation B. The difference in electronic energy between A and B is around 9 kJ mol–1. All structures were obtained at the TPSS-D3(BJ) level. Corresponding simulated CD spectra with excited state difference densities of selected transitions (insets) visualising the change in electronic structure upon photoexcitation of (Rmp)-2Ac (left) and (Rmp)-2Ac2+ (middle). The difference in the CD spectra due to the conformational change of (Rmp)-2Ac2+ is negligible in the region of interest. The spectra were obtained at the ωB97X-D3 level using sTD-DFT. Gaussian line broadening with σ = 20 nm was applied. Insets: blue and red zones correspond to areas of electron enhancement and electron depletion, respectively. Isovalue = 0.001 a0–3.

References

    1. Breslow R., Cheng Z. L. Proc. Natl. Acad. Sci. U. S. A. 2009;106:9144–9146. - PMC - PubMed
    1. Jafarpour F., Biancalani T., Goldenfeld N. Phys. Rev. E. 2017;95:032407. - PubMed
    1. Blackmond D. G. Cold Spring Harbor Perspect. Biol. 2010;2:a002147. - PMC - PubMed
    1. Canary J. W. Chem. Soc. Rev. 2009;38:747–756. - PubMed
    1. Koumura N., Zijlstra R. W., van Delden R. A., Harada N., Feringa B. L. Nature. 1999;401:152–155. - PubMed