. 2019 Oct 24;10(48):11030-11040.
doi: 10.1039/c9sc04251b. eCollection 2019 Dec 28.

A quantitative assessment of the dynamic modification of lipid-DNA probes on live cell membranes

Affiliations

A quantitative assessment of the dynamic modification of lipid-DNA probes on live cell membranes

Yousef Bagheri et al. Chem Sci. .

Abstract

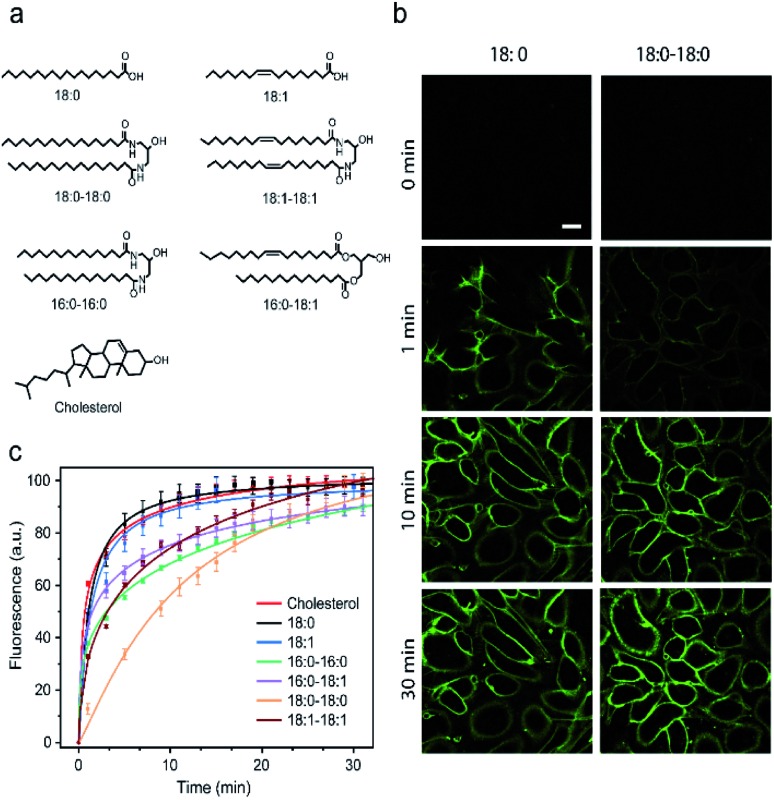
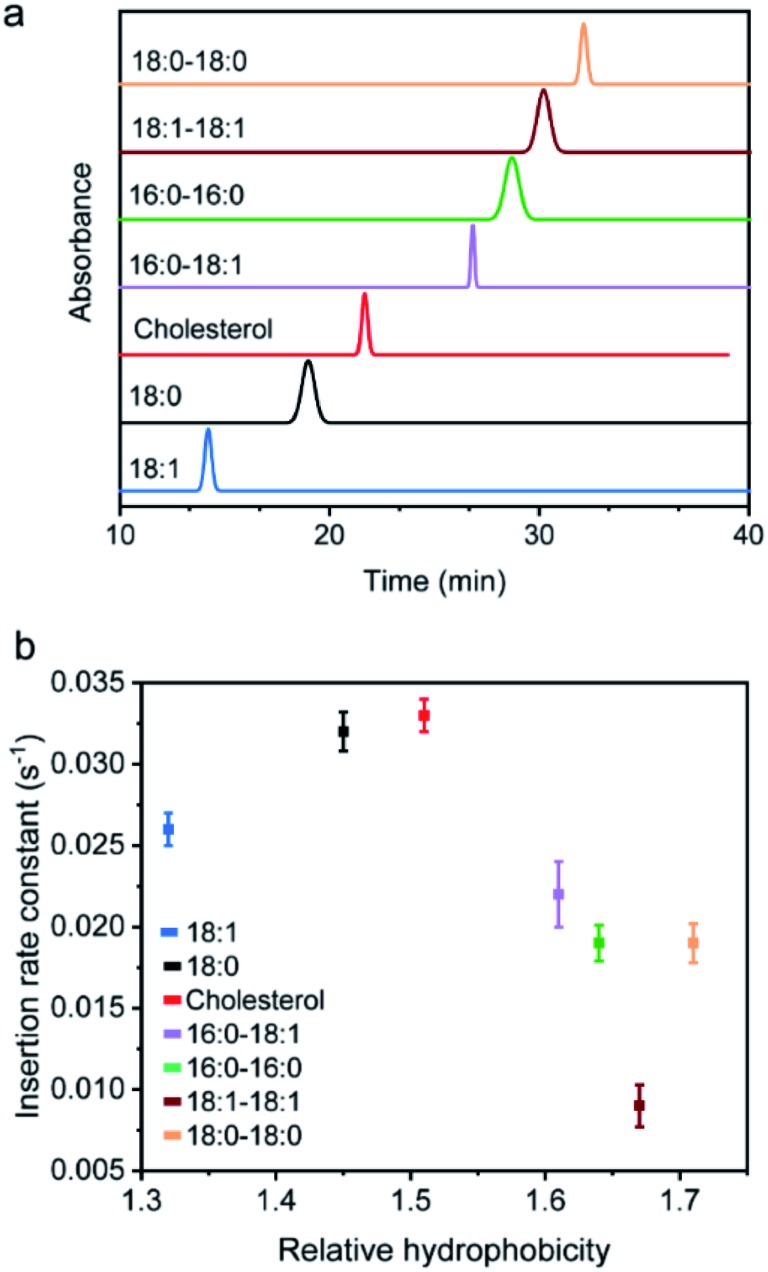
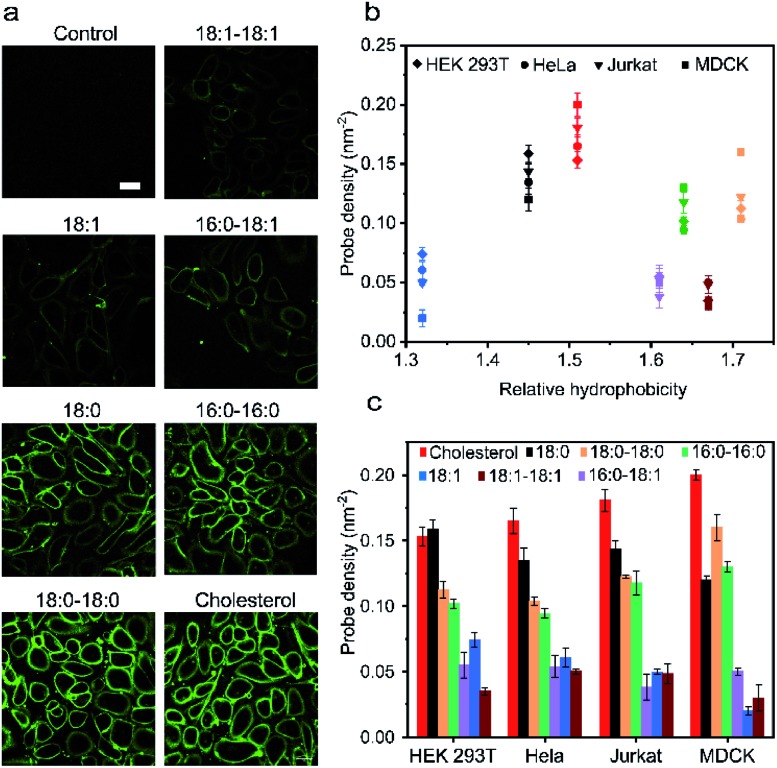
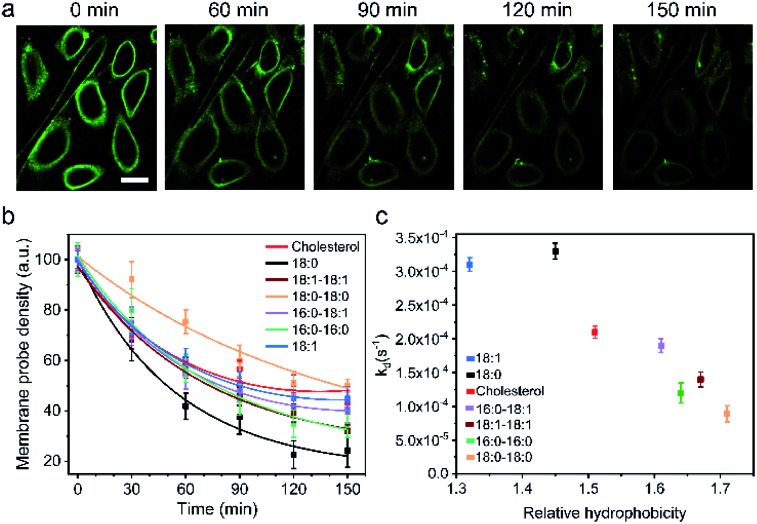
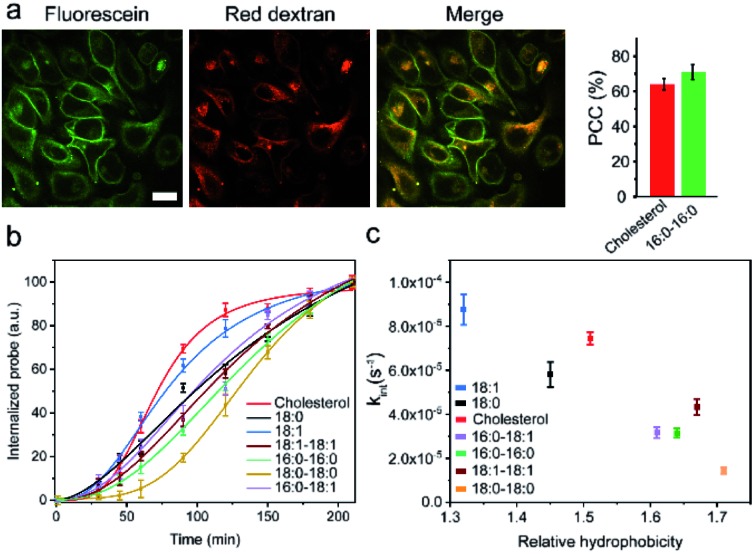
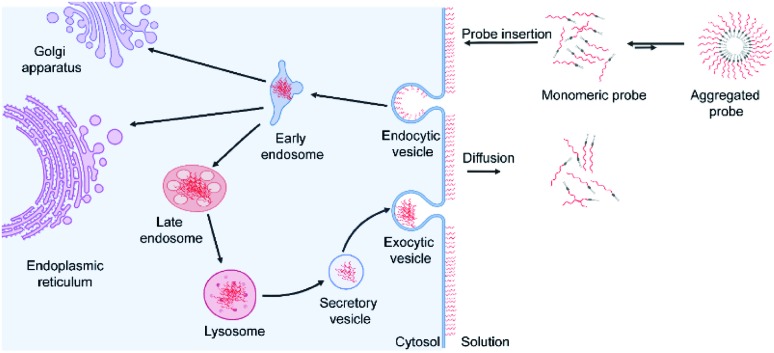
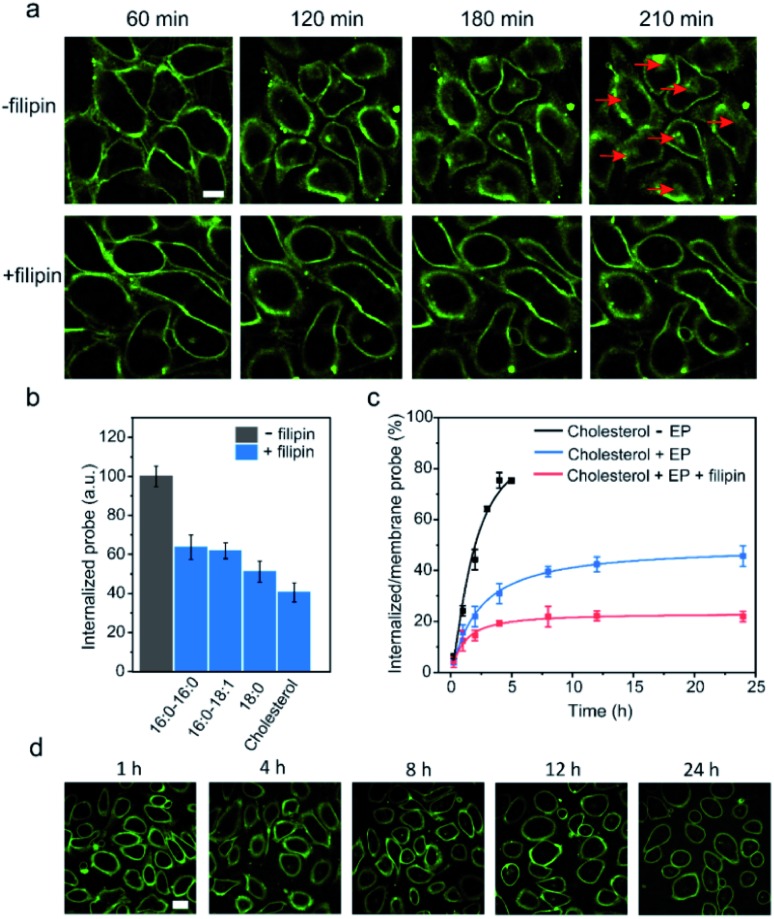
Synthetic lipid-DNA probes have recently attracted much attention for cell membrane analysis, transmembrane signal transduction, and regulating intercellular networks. These lipid-DNA probes can spontaneously insert onto plasma membranes simply after incubation. The highly precise and controllable DNA interactions have further allowed the programmable manipulation of these membrane-anchored functional probes. However, we still have quite limited understanding of how these lipid-DNA probes interact with cell membranes and also what parameters determine this process. In this study, we have systematically studied the dynamic process of cell membrane modification with a group of lipid-DNA probes. Our results indicated that the hydrophobicity of the lipid-DNA probes is strongly correlated with their membrane insertion and departure rates. Most cell membrane insertion stems from the monomeric form of probes, rather than the aggregates. Lipid-DNA probes can be removed from cell membranes through either endocytosis or direct outflow into the solution. As a result, long-term probe modifications on cell membranes can be realized in the presence of excess probes in the solution and/or endocytosis inhibitors. For the first time, we have successfully improved the membrane persistence of lipid-DNA probes to more than 24 h. Our quantitative data have dramatically improved our understanding of how lipid-DNA probes dynamically interact with cell membranes. These results can be further used to allow a broad range of applications of lipid-DNA probes for cell membrane analysis and regulation.


Figures

Fig. 1
Fig. 1. Probe structure and insertion kinetics on MDCK cell membranes. (a) Chemical structures of the lipid moieties used in this study. (b) Fluorescence imaging of the MDCK cell membrane insertion kinetics after adding 1 μM 18:0- and 18:0–18:0-modified 20 nt DNA probes at 0 min. Scale bar, 20 μm. (c) Normalized cell membrane insertion kinetics of different lipid–DNA probes. The same 20 nt single-stranded DNA was conjugated in each probe. At 0 min, 1 μM of each 20 nt lipid–DNA probe was added to the MDCK cells and incubated at room temperature. Shown are the mean and SEM values that were measured on 50–60 cell membranes.
Fig. 2
Fig. 2. Hydrophobicity of the probes and its effect on membrane interaction kinetics. (a) The hydrophobicity value of each 20 nt lipid–DNA probe was determined with a reversed phase HPLC using a C4 column and a triethylammonium acetate/acetonitrile eluent. The retention time was further used to determine the relative hydrophobicity. (b) MDCK cell membrane insertion rate constant of each 20 nt lipid–DNA probe plotted against its corresponding hydrophobicity as measured in panel (a). Shown are the mean and SEM values that were measured on 50–60 cell membranes.
Fig. 3
Fig. 3. Cell membrane insertion efficiency of lipid–DNA probes. (a) Fluorescence imaging of the MDCK cell membrane insertion efficiency after incubation with 1 μM of each 20 nt lipid–DNA probe at room temperature for 1 h. Scale bar, 20 μm. (b) Membrane probe density on four different types of cell lines plotted against its corresponding hydrophobicity after 1 h of incubation with 1 μM of each 20 nt lipid–DNA probe. Each color represented a type of lipid, and the same color indication has been used as in panel (c). (c) Membrane probe densities on four different types of cell lines as measured after 1 h of incubation with 1 μM of each 20 nt lipid–DNA probe. Shown are the mean and SEM values that were measured on 50 cell membranes.
Fig. 4
Fig. 4. Cell membrane persistence of lipid–DNA probes. (a) Fluorescence imaging of the MDCK cell membrane fluorescence decay after removing the free unbound probes at 0 min. These cells were pre-incubated with 1 μM of 20 nt cholesterol–DNA probe at room temperature for 1 h. Scale bar, 20 μm. (b) MDCK cell membrane probe density decay kinetics as measured after removing the free unbound probes at 0 min. These cells were pre-incubated with 1 μM of the corresponding 20 nt lipid–DNA probe at room temperature for 1 h. (c) MDCK cell membrane decay rate constant of each 20 nt lipid–DNA probe plotted against its corresponding hydrophobicity. Shown are the mean and SEM values that were measured on 50–60 cell membranes.
Fig. 5
Fig. 5. Cellular internalization of lipid–DNA probes. (a) Fluorescence imaging and colocalization of the 20 nt cholesterol–DNA probe (fluorescein channel) and a lysosomal tracker (red dextran channel). Scale bar, 20 μm. The Pearson correlation coefficient (PCC) of the two fluorescent channels was further quantified with both 16:0–16:0 and cholesterol probes. Shown are the mean and SEM values that were measured in 30 cells. (b) MDCK cellular internalization kinetics of each 20 nt lipid–DNA probe. The free unbound probes were removed at 60 min, after pre-incubating the cells with 1 μM of each probe at room temperature for 1 h. (c) MDCK cellular internalization rate constant of each 20 nt lipid–DNA probe plotted against its corresponding hydrophobicity. Shown are the mean and SEM values that were measured in 50 cells.
Fig. 6
Fig. 6. Schematic of the dynamic process of lipid–DNA probe modification on cell membranes. First, there is equilibrium between the monomeric and aggregated forms of lipid–DNA probes in the solution. Monomeric form lipid–DNA probes insert into the cell membranes. Then, some of the cell membrane-anchored probes are internalized into the cells through the endocytosis pathway. Some membrane-anchored probes can also directly diffuse out into the extracellular solution or neighbouring cell membranes.
Fig. 7
Fig. 7. Improving the cell membrane persistence of lipid–DNA probes. (a) Fluorescence imaging of the MDCK cellular internalization efficiency after adding 1 μM of 20 nt cholesterol–DNA in the absence or presence of 0.5 μg mL–1 filipin. Scale bar, 20 μm. (b) Effect of filipin on the probe internalization as measured after 4 h of incubation of each lipid–DNA probe at room temperature. Shown are the mean and SEM values that were measured in 50 cells. (c) Long-term inhibitory effect of filipin on the cellular internalization of a cholesterol–DNA probe. The internalized probe density was divided by that on the cell membrane in the absence or presence of excess probes (EP) and/or filipin. Shown are the mean and SEM values that were measured in 50 cells. (d) Fluorescence imaging of the MDCK cells after adding 1 μM cholesterol–DNA probe in the presence of 0.5 μg mL–1 filipin. Scale bar, 20 μm.

References

    1. Sezgin E., Levental I., Mayor S., Eggeling C. Nat. Rev. Mol. Cell Biol. 2017;18:361–374. - PMC - PubMed
    1. Grecco H. E., Schmick M., Bastiaens P. I. H. Cell. 2011;144:897–909. - PubMed
    1. Lingwood D., Simons K. Science. 2010;327:46–50. - PubMed
    1. Todhunter M. E., Jee N. Y., Hughes A. J., Coyle M. C., Cerchiari A., Farlow J., Garbe J. C., LaBarge M. A., Desai T. A., Gartner Z. J. Nat. Methods. 2015;12:975–981. - PMC - PubMed
    1. Chen S., Bremer A. W., Scheideler O. J., Na Y. S., Todhunter M. E., Hsiao S., Bomdica P. R., Maharbiz M. M., Gartner Z. J., Schaffer D. V. Nat. Commun. 2016;7:10309. - PMC - PubMed