Review
. 2020 Feb 10;9(2):200-213.
doi: 10.1002/open.201900336. eCollection 2020 Feb.

Semiconductor Quantum Dots as Components of Photoactive Supramolecular Architectures

Affiliations
Review

Semiconductor Quantum Dots as Components of Photoactive Supramolecular Architectures

Marcello La Rosa et al. ChemistryOpen. .

Abstract

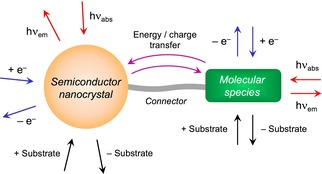
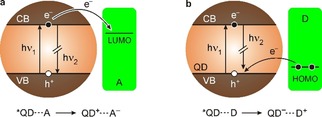
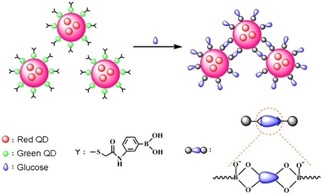
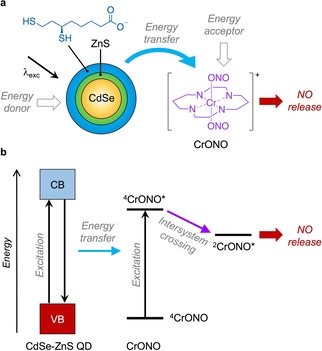
Luminescent quantum dots (QDs) are colloidal semiconductor nanocrystals consisting of an inorganic core covered by a molecular layer of organic surfactants. Although QDs have been known for more than thirty years, they are still attracting the interest of researchers because of their unique size-tunable optical and electrical properties arising from quantum confinement. Moreover, the controlled decoration of the QD surface with suitable molecular species enables the rational design of inorganic-organic multicomponent architectures that can show a vast array of functionalities. This minireview highlights the recent progress in the use of surface-modified QDs - in particular, those based on cadmium chalcogenides - as supramolecular platforms for light-related applications such as optical sensing, triplet photosensitization, photocatalysis and phototherapy.

Keywords: catalysis; quantum dots; sensing; supramolecular chemistry; triplet sensitization.


Figures

Figure 1
Figure 1
Schematic representation of a nanohybrid consisting of QD and molecular components, and of the processes that can take place within the hybrid and with external species. The different components are not on the same scale.
Figure 2
Figure 2
(a) Diagram showing the valence (VB) and conduction (CB) bands of a semiconductor, and representation of the photoinduced generation of an exciton and its radiative recombination. (b) Effect of quantum confinement on the electronic configuration of semiconductor nanocrystals. (c) Photographs showing the luminescence arising from colloidal solutions of CdSe QDs of different size, excited with UV light.
Figure 3
Figure 3
Absorption (full line) and luminescence (dotted line; λexc=500 nm) spectra of CdSe QDs (red traces; R=1.9 nm, chloroform) and of a popular dye such as Rhodamine B (green traces, methanol) at room temperature.
Figure 4
Figure 4
Strategies for the surface modification of natively hydrophobic QDs coated by tris(n‐octyl)phosphine oxide. (a) Ligand exchange with amine‐, thiol‐ or 1,2‐dithiolane‐type molecules. (b) Self‐assembly of the nanocrystal capping layer with molecules endowed with a long alkyl chain, driven by Van der Waals interactions. The green ovals represent functional units.
Figure 5
Figure 5
Scheme of the analyte‐modulated ‘turn on’ photoluminescence response in a luminophore‐quencher‐receptor multicomponent chemosensor. Reproduced with permission from Ref. [48d]. Copyright 2015 Royal Society of Chemistry.
Figure 6
Figure 6
a) Schematization of an electron transfer from a photoexcited QD to an electron acceptor A, and b) an electron transfer from an electron donor D to a photoexcited QD. Adapted with permission from Ref. [48d]. Copyright 2015 Royal Society of Chemistry.
Figure 7
Figure 7
Schematization of Förster resonance energy transfer (FRET): a) from a photoexcited QD to a molecular energy acceptor (A); b) from a photoexcited molecular energy donor (D) to a QD. The energy‐transfer process may give rise to photosensitized emission of the energy acceptor component (hv2 for a, hv4 for b). Adapted with permission from Ref. [48d]. Copyright 2015 Royal Society of Chemistry.
Figure 8
Figure 8
CdTe QDs functionalized with phenanthroline‐azacrown ether ligands and scheme for the luminescent sensing of Ba2+ ions.52
Figure 9
Figure 9
Schematic representation of the selective sensing mechanism of TLA‐capped CdTe QDs toward metal ion detection. Adapted with permission from Ref. [59]. Copyright 2017 Elsevier.
Figure 10
Figure 10
Luminescence spectra of CdSe−ZnS QDs functionalized with imidazole‐pyrenyl ligands (schematically shown in the top part) in chloroform at room temperature as a function of the oxygen pressure: 0 (a), 0.213 (b) and 1.013 (c) bar (λexc=275 nm). The inset shows the linear correlation between the ratiometric photoluminescence response (calculated as the intensity ratio at the wavelength values indicated by the blue arrows)) and the O2 partial pressure. Adapted with permission from Ref. [62]. Copyright 2011 Royal Society of Chemistry.
Figure 11
Figure 11
Schematic representation of the glucose‐induced aggregation of nanohybrids containing green‐ and red‐emitting CdTe QDs embedded in silica particles. Adapted with permission from Ref. [64]. Copyright 2016 Elsevier.
Figure 12
Figure 12
Fluorescence spectrum of a multicolour QD‐based probe before (A) and after (B) ligand exchange with phen (aqueous buffer, λexc=365 nm). The emission of the gQDs, initially quenched by phen, can be recovered upon addition of cysteine (C) and homocysteine (D). The box shows a schematic representation of the detection mechanism. Adapted with permission from Ref. [65]. Copyright 2015 Elsevier.
Figure 13
Figure 13
(a) Schematic representation of the photoinduced processes in a nanoconjugate consisting of CdSe QD and PCA components. (b) Energy‐level diagram for the four different nanohybrids. Samples CdSe‐2/PCA and CdSe‐3/PCA can exhibit reversible electronic energy transfer (REET) involving their exciton level and the energy‐matched triplet excited state of PCA. The QD exciton levels of hybrids CdSe‐1/PCA and CdSe‐4/PCA are too high and too low, respectively, for REET to occur at room temperature. Adapted with permission from Ref. [75]. Copyright 2018 Wiley‐VCH.
Figure 14
Figure 14
Luminescence decay of CdSe‐3/PCA QDs monitored at 600 nm (green trace) in deoxygenated solution, as measured by (a) time‐correlated single‐photon counting (log plot, λexc=405 nm) and (b) gated streak camera (log‐log plot, λexc=465 nm). (c) Luminescence decay of CdSe‐3/PCA QDs (λexc=405 nm, green trace) in air equilibrated solution. (d) Luminescence decay of CdSe‐1/PCA monitored at 540 nm (λexc=405 nm, purple trace) in deoxygenated solution. The grey traces in all panels refer to the same experiment performed on the same QD sample lacking the PCA functionalization. Conditions: heptane, room temperature. Adapted with permission from Ref. [75]. Copyright 2018 Wiley‐VCH.
Figure 15
Figure 15
Schematic representation of a photocatalytic nanohybrid consisting of a molecular nickel bis(terpyridine) catalyst anchored on a CdS QD photosensitizer. The performance of different anchoring groups (R) was investigated. Reproduced with permission from Ref. [80]. Copyright 2017 American Chemical Society.
Figure 16
Figure 16
Schematic representation (a) and energy‐level diagram describing the photoinduced release of NO in CdSe−ZnS nanocrystals assembled with a chromium complex. Excitation of the QDs coated with dihydrolipoate ligands is followed by energy transfer to the CrONO complex, adsorbed on the nanocrystal surface, and release of NO. Adapted with permission from Ref. [86]. Copyright 2016 Springer‐Verlag.

Similar articles

Cited by

References

    1. Alivisatos A. P., J. Phys. Chem. 1996, 100, 13226–13239.
    1. Resch-Genger U., Grabolle M., Cavaliere-Jaricot S., Nitschke R., Nann T., Nat. Methods 2008, 5, 763–775. - PubMed
    1. Ekimov A. I., Efros Al. L., Onushchenko A. A., Solid State Commun. 1985, 56, 921–924.
    1. Brus L. E., J. Chem. Phys. 1984, 80, 4403–4409.
    1. See, e. g.: Murray C. B., Norris D. J., Bawendi M. G., J. Am. Chem. Soc. 1993, 115, 8706–8715.

Publication types

LinkOut - more resources