. 2020 Jan;8(1):5.
doi: 10.21037/atm.2019.11.68.

Orexin-A aggravates cytotoxicity and mitochondrial impairment in SH-SY5Y cells transfected with APPswe via p38 MAPK pathway

Affiliations

Orexin-A aggravates cytotoxicity and mitochondrial impairment in SH-SY5Y cells transfected with APPswe via p38 MAPK pathway

Maoyu Li et al. Ann Transl Med. 2020 Jan.

Abstract

Background: Alzheimer's disease (AD) is one of the common neurodegenerative diseases and is characterized by the accumulation of amyloid-β (Aβ). Orexin-A is a neuropeptide produced in the hypothalamus and thought to be involved in the pathogenesis of AD. However, its underlying mechanism and signaling pathway remains unclear. The aim of this work was to investigate the effect of Orexin-A on AD, and to explore its potential mechanism and signaling pathway.

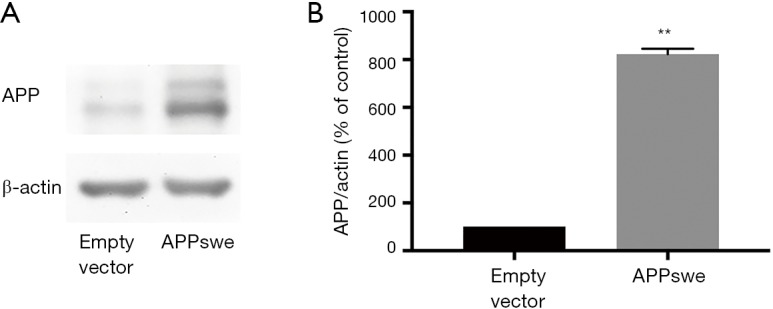
Methods: SH-SY5Y cells that were stably transfected with the Swedish mutant amyloid precursor protein (APPswe), a cell model of AD with excessive Aβ production, were used in this study. Cells were treated with Orexin-A, and with or without SB203580, an inhibitor of the p38 mitogen-activated protein kinase (MAPK) pathway, one of the key MAPK pathways associated with cell death. Following treatment, cells were collected and analyzed by western blotting, ELISA, electron microscopy, real-time PCR, fluorescence microscopy, and other biochemical assays.

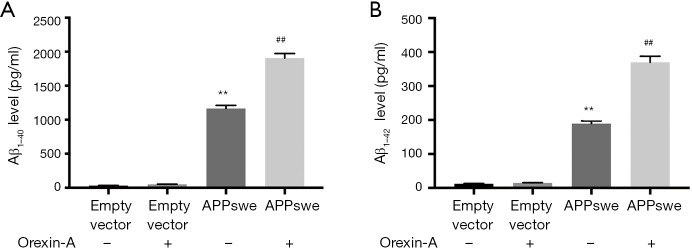
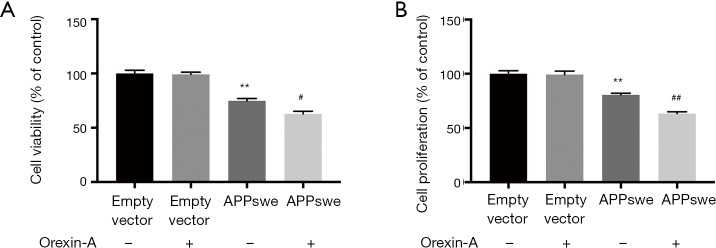
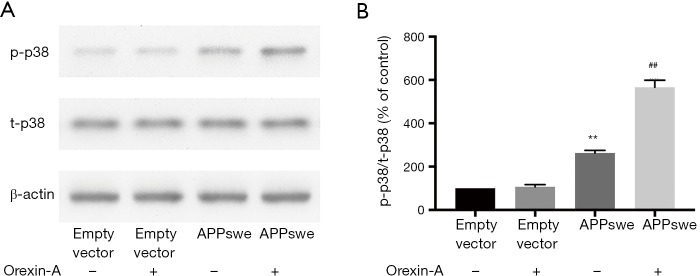
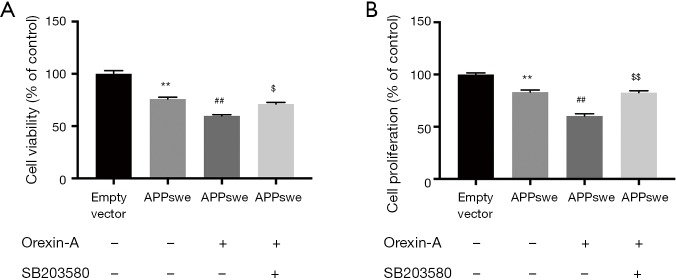
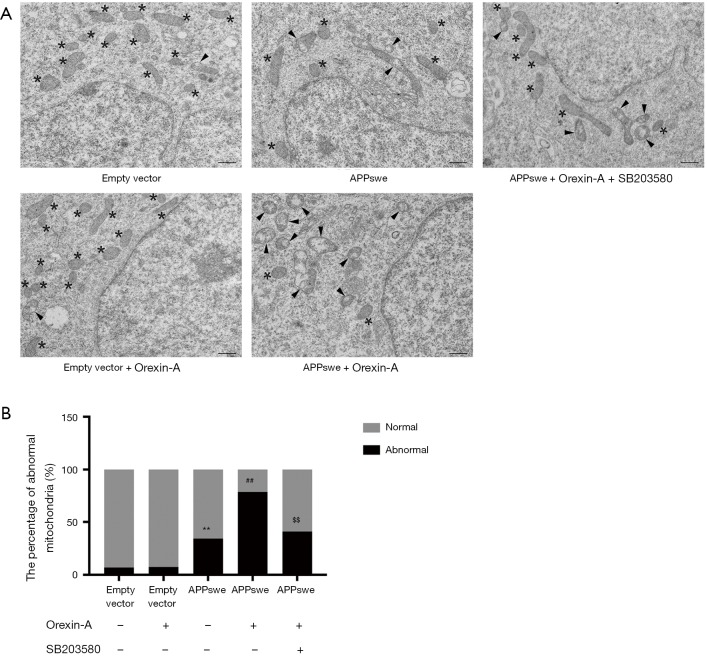
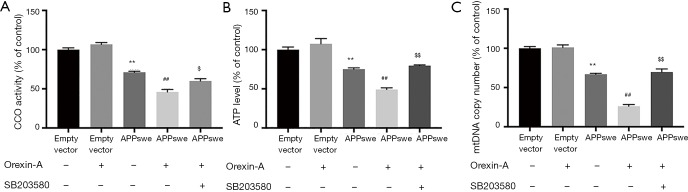
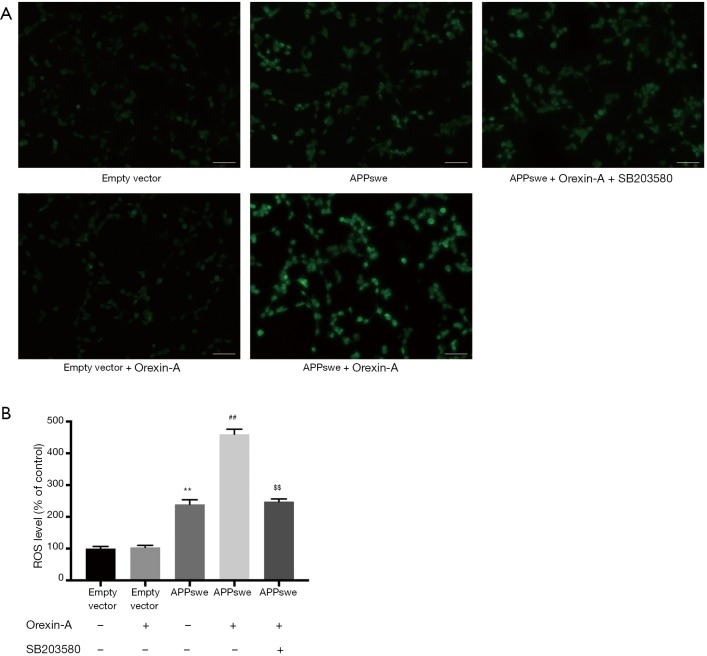
Results: Orexin-A increased the level of Aβ1-40 and Aβ1-42 in the cell medium, and activated the p38 MAPK pathway. As evidenced by the CCK-8 and ELISA BrdU assays, Orexin-A decreased cell viability and cell proliferation. Electron microscopic analysis used to observe the morphology of mitochondria, showed that Orexin-A increased the percentage of abnormal mitochondria. Further, decreased activity of cytochrome c oxidase (CCO), level of ATP, and mitochondrial DNA (mtDNA) copy number following Orexin-A treatment showed that Orexin-A exacerbated mitochondrial dysfunction. The level of intracellular reactive oxygen species (ROS), which is mainly generated in mitochondria and reflects mitochondrial dysfunction, was also increased by Orexin-A. SB203580 blocked the cytotoxicity and mitochondrial impairment aggravated by Orexin-A.

Conclusions: These findings demonstrate that Orexin-A aggravates cytotoxicity and mitochondrial impairment in SH-SY5Y cells transfected with APPswe through the p38 MAPK pathway, and suggest that Orexin-A participates in the pathogenesis of AD, which may provide a new treatment target in the future.

Keywords: Alzheimer’s disease (AD); Orexin-A; cytotoxicity; mitochondrial impairment; p38 MAPK pathway.


Conflict of interest statement

Conflicts of Interest: The authors have no conflict of interest to declare.

Figures

Figure 1
Figure 1
Expression of APP in APPswe cells. (A) APP expression was analyzed by western blotting; (B) densitometric quantification of APP. Values are presented as mean ± SEM (n=3). **, P<0.01 versus empty vector cells.
Figure 2
Figure 2
Orexin-A increased the level of Aβ1–40 and Aβ1–42 in APPswe cells. Cells were treated with 100 nM Orexin-A for 24 h. (A) Aβ1–40 and (B) Aβ1–42 level in cell medium was detected by ELISA. Values are presented as mean ± SEM (n=3). **, P<0.01 versus empty vector cells; ##, P<0.01 vs. APPswe cells.
Figure 3
Figure 3
Orexin-A decreased cell viability and cell proliferation in APPswe cells. Cells were treated with 100 nM Orexin-A for 24 h. (A) Cell viability and (B) cell proliferation was tested. Values are presented as mean ± SEM (n=3). **, P<0.01 versus empty vector cells; #, P<0.05 and ##, P<0.01 versus APPswe cells.
Figure 4
Figure 4
Orexin-A activated p38 MAPK pathway in APPswe cells. Cells were treated with 100 nM Orexin-A for 3 h. (A) Phosphorylation of p38 was analyzed by western blotting; (B) densitometric quantification of phosphorylation of p38. Values are presented as mean ± SEM (n=3). **, P<0.01 versus empty vector cells; ##, P<0.01 versus APPswe cells.
Figure 5
Figure 5
Orexin-A decreased cell viability and cell proliferation via p38 MAPK pathway in APPswe cells. Cells were pretreated with or without 10 µM SB203580 for 30 min, followed by treatment with 100 nM Orexin-A for 24 h. (A) Cell viability and (B) cell proliferation was measured. Values are presented as mean ± SEM (n = 3). **, P<0.01 versus empty vector cells; ##, P<0.01 versus APPswe cells; $, P<0.05 and $$, P<0.01 versus Orexin-A treated APPswe cells.
Figure 6
Figure 6
Orexin-A aggravated the impairment of mitochondrial morphology in APPswe cells, which was mediated by p38 MAPK pathway. Cells were pretreated with or without 10 µM SB203580 for 30 min, followed by treatment with 100 nM Orexin-A for 24 h. (A) Representative electron microscopy images of mitochondria are shown. Asterisk indicates normal mitochondria, and arrowhead indicates abnormal mitochondria. (B) The percentage of abnormal mitochondria was calculated. Scale bar =0.5 µm. Values are presented as mean ± SEM (n=3). **, P<0.01 vs. empty vector cells; ##, P<0.01 vs. APPswe cells; $$, P<0.01 vs. Orexin-A treated APPswe cells.
Figure 7
Figure 7
Orexin-A aggravated mitochondrial dysfunction via p38 MAPK pathway in APPswe cells. Cells were pretreated with or without 10 µM SB203580 for 30 min, followed by treatment with 100 nM Orexin-A for 24 h. (A) CCO activity; (B) ATP level; and (C) mtDNA copy number was measured. Values are presented as mean ± SEM (n=3). **, P<0.01 versus empty vector cells; ##, P<0.01 versus APPswe cells; $, P<0.05 and $$, P<0.01 versus Orexin-A treated APPswe cells.
Figure 8
Figure 8
Orexin-A increased ROS level in APPswe cells through p38 MAPK pathway. Cells were pretreated with or without 10 µM SB203580 for 30 min, followed by treatment with 100 nM Orexin-A for 24 h. (A) Representative fluorescence images of ROS are shown; (B) the level of ROS was measured. Scale bar =50 µm. Values are presented as mean ± SEM (n=3). **, P<0.01 vs. empty vector cells; ##, P<0.01 vs. APPswe cells; $$, P<0.01 vs. Orexin-A treated APPswe cells.

Similar articles

Cited by

References

    1. Swomley AM, Forster S, Keeney JT, et al. Abeta, oxidative stress in Alzheimer disease: evidence based on proteomics studies. Biochim Biophys Acta 2014;1842:1248-57. 10.1016/j.bbadis.2013.09.015 - DOI - PMC - PubMed
    1. Huang Y, Mucke L. Alzheimer mechanisms and therapeutic strategies. Cell 2012;148:1204-22. 10.1016/j.cell.2012.02.040 - DOI - PMC - PubMed
    1. Goate A, Hardy J. Twenty years of Alzheimer's disease-causing mutations. J Neurochem 2012;120 Suppl 1:3-8. 10.1111/j.1471-4159.2011.07575.x - DOI - PubMed
    1. Holtzman DM, Morris JC, Goate AM. Alzheimer's disease: the challenge of the second century. Sci Transl Med 2011;3:77sr1. 10.1126/scitranslmed.3002369 - DOI - PMC - PubMed
    1. Querfurth HW, LaFerla FM. Alzheimer's disease. N Engl J Med 2010;362:329-44. 10.1056/NEJMra0909142 - DOI - PubMed