. 2019 Dec 2:4:191.
doi: 10.12688/wellcomeopenres.15603.1. eCollection 2019.

Antibiotic resistance prediction for Mycobacterium tuberculosis from genome sequence data with Mykrobe

Affiliations

Antibiotic resistance prediction for Mycobacterium tuberculosis from genome sequence data with Mykrobe

Martin Hunt et al. Wellcome Open Res. .

Abstract

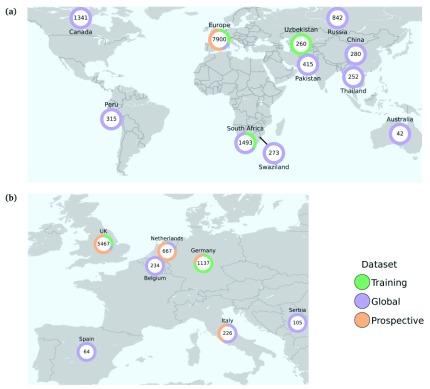
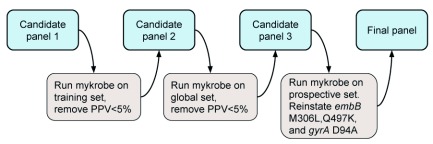
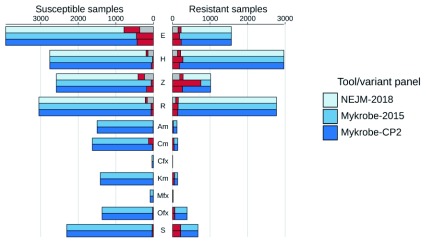
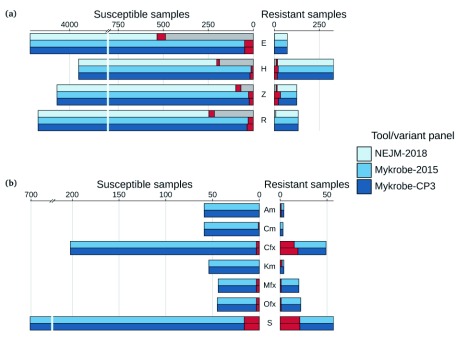
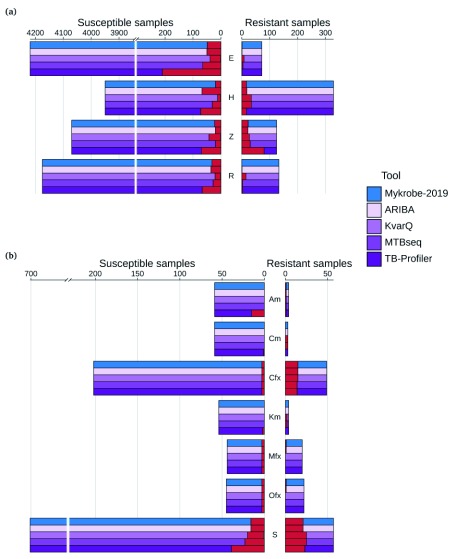
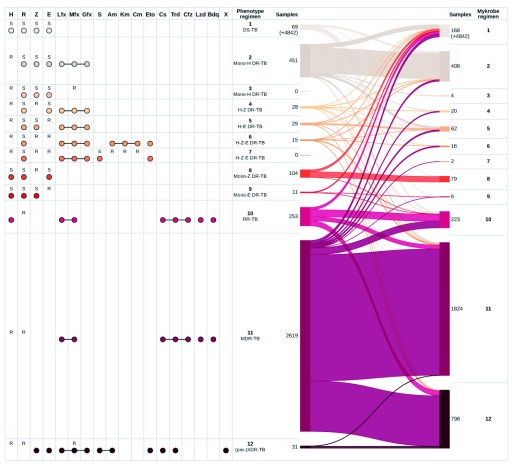
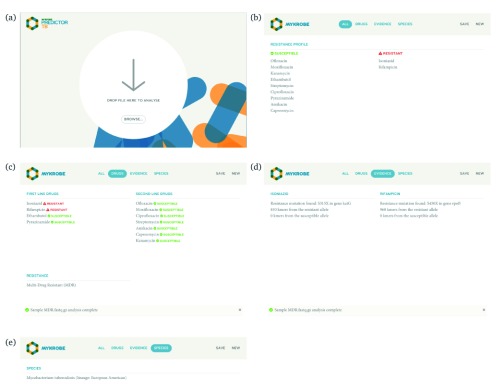
Two billion people are infected with Mycobacterium tuberculosis, leading to 10 million new cases of active tuberculosis and 1.5 million deaths annually. Universal access to drug susceptibility testing (DST) has become a World Health Organization priority. We previously developed a software tool, Mykrobe predictor, which provided offline species identification and drug resistance predictions for M. tuberculosis from whole genome sequencing (WGS) data. Performance was insufficient to support the use of WGS as an alternative to conventional phenotype-based DST, due to mutation catalogue limitations. Here we present a new tool, Mykrobe, which provides the same functionality based on a new software implementation. Improvements include i) an updated mutation catalogue giving greater sensitivity to detect pyrazinamide resistance, ii) support for user-defined resistance catalogues, iii) improved identification of non-tuberculous mycobacterial species, and iv) an updated statistical model for Oxford Nanopore Technologies sequencing data. Mykrobe is released under MIT license at https://github.com/mykrobe-tools/mykrobe. We incorporate mutation catalogues from the CRyPTIC consortium et al. (2018) and from Walker et al. (2015), and make improvements based on performance on an initial set of 3206 and an independent set of 5845 M. tuberculosis Illumina sequences. To give estimates of error rates, we use a prospectively collected dataset of 4362 M. tuberculosis isolates. Using culture based DST as the reference, we estimate Mykrobe to be 100%, 95%, 82%, 99% sensitive and 99%, 100%, 99%, 99% specific for rifampicin, isoniazid, pyrazinamide and ethambutol resistance prediction respectively. We benchmark against four other tools on 10207 (=5845+4362) samples, and also show that Mykrobe gives concordant results with nanopore data. We measure the ability of Mykrobe-based DST to guide personalized therapeutic regimen design in the context of complex drug susceptibility profiles, showing 94% concordance of implied regimen with that driven by phenotypic DST, higher than all other benchmarked tools.

Keywords: Antimicrobial resistance; antibiotic treatment; diagnostic; nanopore; tuberculosis; whole genome sequencing.


Conflict of interest statement

No competing interests were disclosed.

Figures

Figure 1.
Figure 1.
Global ( a) and European ( b) origin of samples included in this study. Numbers represent the total numbers of samples from each region or country. Colours represent the proportion in each study dataset (see Source data sample_data.tsv for complete details ).
Figure 2.
Figure 2.. Process for developing the new Mykrobe variant panel.
See main text for details.
Figure 3.
Figure 3.. Comparison of NEJM-2018 (results from 20), Mykrobe using the Walker-2015 panel and Mykrobe using candidate panel 2 (CP2) on the Global dataset.
Counts of susceptible samples are shown on the left, broken down for each tool/panel into those correctly identified as susceptible (in the colour of the tool/panel), those falsely identified as resistant coloured red and no-calls coloured grey. Similarly, resistant samples are shown on the right, with those correctly identified as resistant coloured by the tool/panel, those falsely identified as susceptible in red, and no-calls in grey. Note that second-line drugs were not considered in NEJM-2018, and so are not shown. E, ethambutol; H, isoniazid; Z, pyrazinamide; R, rifampicin; Am, amikacin; Cm, capreomycin; Cfx, ciprofloxacin; Km, kanamycin; Mfx, moxifloxacin; Ofx, ofloxacin; S, streptomycin.
Figure 4.
Figure 4.
Comparison of NEJM-2018, Walker-2015 and candidate panel 3 (CP3) on the Prospective dataset for ( a) first-line drugs and ( b) second-line drugs. Counts of susceptible samples are shown on the left, broken down for each tool/panel into those correctly identified as susceptible (in the colour of the tool/panel), those falsely identified as resistant coloured red and no-calls coloured grey. Similarly, resistant samples are shown on the right, with those correctly identified as resistant coloured by the tool/panel, those falsely identified as susceptible in red, and no-calls in grey. Note that second-line drugs were not considered in NEJM-2018. E, ethambutol; H, isoniazid; Z, pyrazinamide; R, rifampicin; Am, amikacin; Cm, capreomycin; Cfx, ciprofloxacin; Km, kanamycin; Mfx, moxifloxacin; Ofx, ofloxacin; S, streptomycin.
Figure 5.
Figure 5.
Comparison of ARIBA, KvarQ, MTBseq, Mykrobe (with final release panel) and TB-Profiler on the prospective dataset for ( a) first-line drugs and ( b) second-line drugs. Counts of susceptible samples are shown on the left, with true-negatives coloured by the tool/panel and false-positives coloured red. Similarly, resistant samples are shown on the right, with true-positives coloured by the tool/panel and false-negatives in red. E, ethambutol; H, isoniazid; Z, pyrazinamide; R, rifampicin; Am, amikacin; Cm, capreomycin; Cfx, ciprofloxacin; Km, kanamycin; Mfx, moxifloxacin; Ofx, ofloxacin; S, streptomycin.
Figure 6.
Figure 6.. Comparison of drug regimen calls inferred from phenotype information and Mykrobe results, on the global and prospective datasets combined.
See supplementary files regimen_plot.global.pdf, regimen_plot.prospective.pdf for the same plot for each of the global and prospective sets separately. On the left, “R” and “S” show the drug phenotypes used to identify the regimen. For example, resistance to isoniazid and moxifloxacin, and susceptibility to rifampicin, pyrazinamide and ethambutol implies drug regimen 3. Coloured dots show the drugs that are included in the regimen, where a line joining drugs represents interchangeability. The ribbons on the right show the mapping of phenotype-inferred regimens (left) to Mykrobe-inferred regimens (right), with numbers showing the number of samples allocated to each regimen. 4,842 samples called as regimen 1 by both methods are not shown. H, isoniazid; R, rifampicin; Z, pyrazinamide; E, ethambutol; Lfx, levofloxacin; Mfx, moxifloxacin; Gfx, gatifloxacin; S, streptomycin; Am, amikacin; Km, kanamycin; Cm, capreomycin; Eto, ethionamide; Cs, cycloserine; Trd, terizidone; Cfz, clofazimine; Lzd, linezolid; Bdq, bedaquiline; X, other WHO second-line drugs to which isolate is shown to be susceptible.
Figure 7.
Figure 7.
( a) Start page of the Mykrobe application. Users can drag-and-drop or select their sequence files. Once selected, Mykrobe starts the analysis process. ( b) Once the analysis is complete, the user is shown the resistance profile - which drugs is the isolate predicted to be resistant to, and susceptible to. ( c) Resistance profile can be broken down into first and second line drugs. ( d) The identified genetic substrate for resistance prediction can be seen in the "Evidence" tab. Here, evidence for isoniazid and rifampicin resistance is observed in variants KatG position 315 and rpoB position 450, respectively. ( e) The species and lineage prediction can be seen in the "Species" tab. Here the sample is Mycobacterium tuberculosis of European/American lineage.

References

    1. Bradley P, Gordon NC, Walker TM, et al. : Rapid antibiotic-resistance predictions from genome sequence data for Staphylococcus aureus and Mycobacterium tuberculosis. Nat Commun. 2015;6(1):10063. 10.1038/ncomms10063 - DOI - PMC - PubMed
    1. Bertels F, Silander OK, Pachkov M, et al. : Automated Reconstruction of Whole-Genome Phylogenies from Short-Sequence Reads. Mol Biol Evol. 2014;31(5):1077–1088. 10.1093/molbev/msu088 - DOI - PMC - PubMed
    1. Walker TM, Kohl TA, Omar SV, et al. : Whole-genome sequencing for prediction of Mycobacterium tuberculosis drug susceptibility and resistance: a retrospective cohort study. Lancet Infect Dis. 2015;15(10):1193–1202. 10.1016/S1473-3099(15)00062-6 - DOI - PMC - PubMed
    1. Votintseva AA, Bradley P, Pankhurst L, et al. : Same-Day Diagnostic and Surveillance Data for Tuberculosis via Whole-Genome Sequencing of Direct Respiratory Samples. J Clin Microbiol. 2017;55(5):1285–1298. 10.1128/JCM.02483-16 - DOI - PMC - PubMed
    1. Hunt M, Mather AE, Sánchez-Busó L, et al. : ARIBA: rapid antimicrobial resistance genotyping directly from sequencing reads. Microb Genom. 2017;3(10):e000131. 10.1099/mgen.0.000131 - DOI - PMC - PubMed

LinkOut - more resources