. 2019 Dec 3:4:193.
doi: 10.12688/wellcomeopenres.15590.1. eCollection 2019.

Evolutionary analysis of the most polymorphic gene family in falciparum malaria

Affiliations

Evolutionary analysis of the most polymorphic gene family in falciparum malaria

Thomas D Otto et al. Wellcome Open Res. .

Abstract

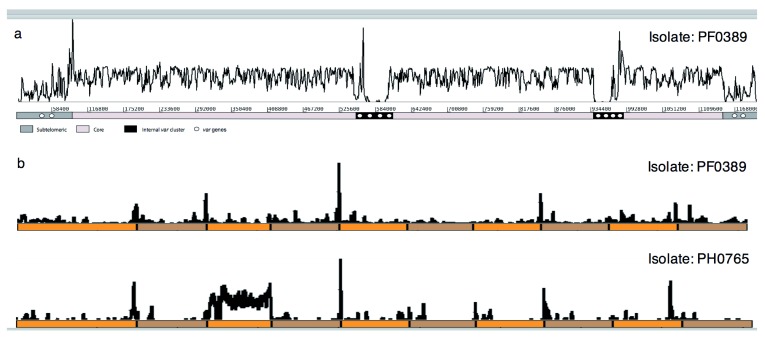
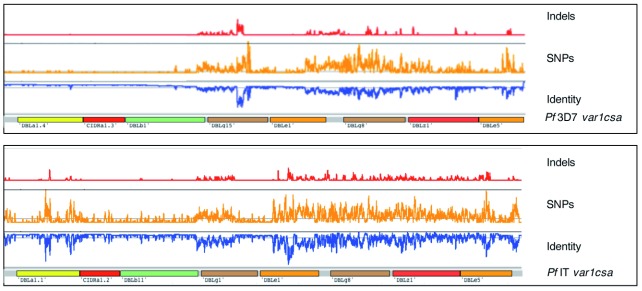
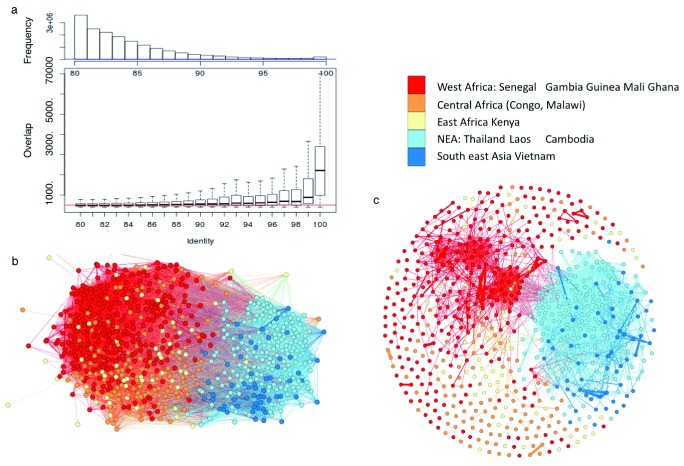
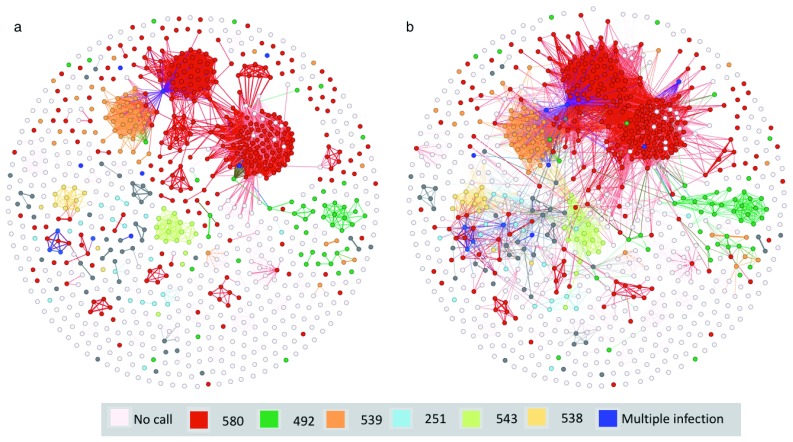
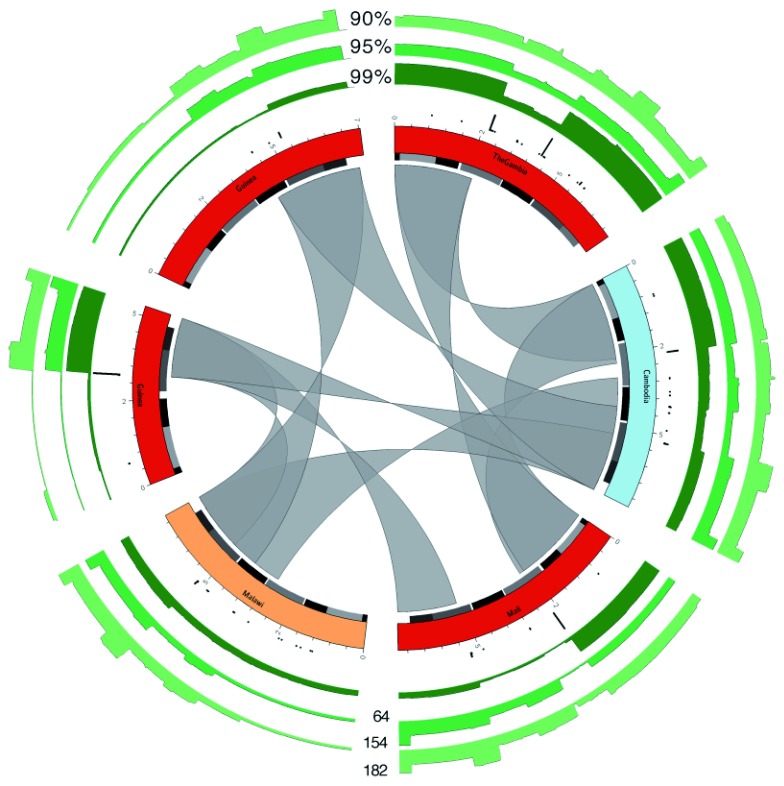
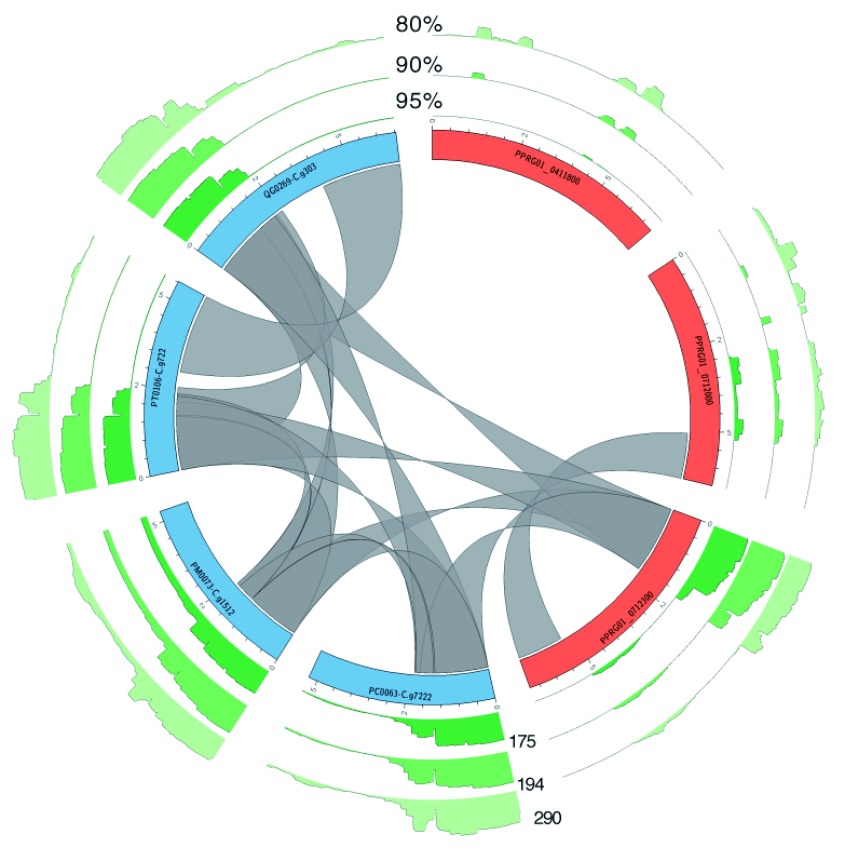
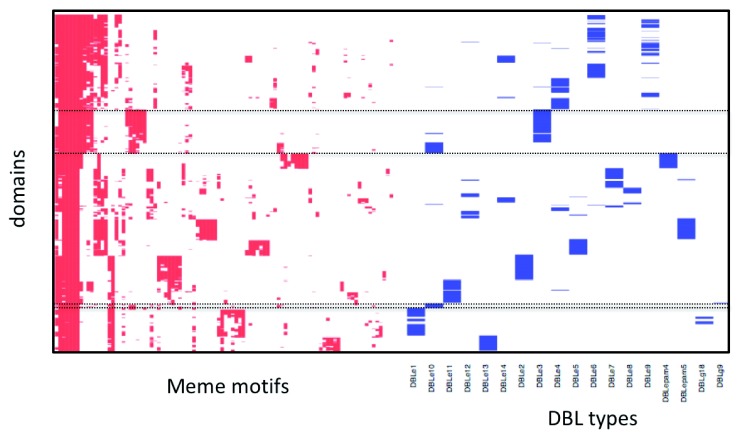
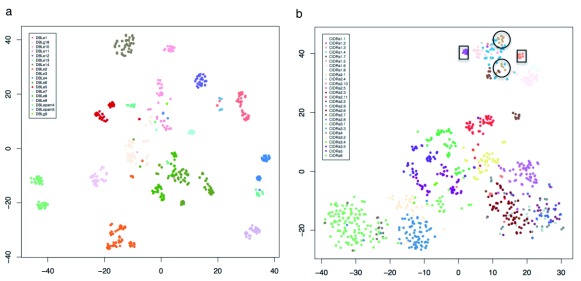
The var gene family of the human malaria parasite Plasmodium falciparum encode proteins that are crucial determinants of both pathogenesis and immune evasion and are highly polymorphic. Here we have assembled nearly complete var gene repertoires from 2398 field isolates and analysed a normalised set of 714 from across 12 countries. This therefore represents the first large scale attempt to catalogue the worldwide distribution of var gene sequences We confirm the extreme polymorphism of this gene family but also demonstrate an unexpected level of sequence sharing both within and between continents. We show that this is likely due to both the remnants of selective sweeps as well as a worrying degree of recent gene flow across continents with implications for the spread of drug resistance. We also address the evolution of the var repertoire with respect to the ancestral genes within the Laverania and show that diversity generated by recombination is concentrated in a number of hotspots. An analysis of the subdomain structure indicates that some existing definitions may need to be revised From the analysis of this data, we can now understand the way in which the family has evolved and how the diversity is continuously being generated. Finally, we demonstrate that because the genes are distributed across the genome, sequence sharing between genotypes acts as a useful population genetic marker.

Keywords: Plasmodium; evolution; var.


Conflict of interest statement

No competing interests were disclosed.

Figures

Figure 1.
Figure 1.. Mapped-coverage of sequencing reads from clinical isolates.
( a) Sequencing reads from a clinical isolate (PA0274) map at high coverage across much of chromosome 4 of the P. falciparum 3D7 reference genome. The distal regions of the subtelomeres and discrete interstitial regions contain var genes and are clear exceptions with little or no coverage, indicating high sequence polymorphism. ( b) Sequencing reads from the PF0389 (upper) and PH0765 (lower) clinical isolates mapped against a reference comprising 10 concatenated var genes from P. falciparum 3D7 (alternating orange/brown). Few regions of the var genes are similar enough between isolates to enable reads to map and just one var gene is completely covered in one clinical isolate.
Figure 2.
Figure 2.. Sequence diversity of var1CSA genes from clinical isolates.
var1CSA genes were split into two major types corresponding to P. falciparum 3D7 (top) and P. falciparum IT (bottom) var1CSA reference genes, based on a phylogenetic analysis (Addition File 2: Figure S1). Using BWA-MEM and SAMtools Pileup, sequence identity and polymorphism were detected and then plotted across each reference. The regions of each gene encoding specific protein domains are indicated. Genes of the 3D7 type have high sequence identity across their entire length but those of the IT type show greater polymorphism, particularly in their 3’ half.
Figure 3.
Figure 3.. Extensive sequence sharing between var genes.
( a) Boxplot of nucleotide-alignment lengths versus sequence identity between var genes. ( b) Network of var sharing between normalized dataset of 714 isolates. Each node represents an isolate, coloured by region. Edges represent isolates sharing at least one var gene (> 99% identity, 3.5 kb overlap and > 80% sequence overlap). ( c) Alternative network of var sharing but with nodes (isolates) connected with three shared var genes.
Figure 4.
Figure 4.. var genes record pattern of artemisinin resistance in SE Asia.
Network of var sharing with each node representing an isolate, coloured based on polymorphisms in the kelch13 gene. Edges represent either ( a) ≥ 15 shared var genes (99% identity, ≥ 3.5kb and 80% overlap), or ( b) ≥ 7 shared var genes. Dark blue isolates are where more than one SNP occurs in kelch13. Additional samples were used for this figure (see methods).
Figure 5.
Figure 5.. Overview of recombination.
Circos plots of six var genes, taken from the first 2kb OrthoMCL cluster. Genes are coloured based on the geographic location of the isolate from which they were obtained (using same scheme as Figure 3). Alternating grey and black boxes mark the positions of domains. The inner gray ribbons show similarity between the genes with at least 99% identity and ≥ 2 kb overlap. The black bar plots show frequency of detected recombination events using the normalized var gene dataset. The green bar plots show the number of hits over the genes against the normalized dataset, at three different percent identity cutoffs: 99, 95 and 90%. Maximum (y-axis) values are shown against the bar plots at the bottom of the figure.
Figure 6.
Figure 6.. Ancient patterns of recombination within the Lavernia sub-genus.
Similar to Figure 5, but P. falciparum var genes (blue) were selected that hit against a P. praefalciparum var gene (orange). The ribbons show matches of ≥ 99% identity 99% and a minimum length of 500 bp.
Figure 7.
Figure 7.. Visualisation of motifs in DBLε domains.
Presence of individual MEME motifs (columns) in each DBLε domain (row) is shown (red). For each domain, annotation of subdomains, according to the VarDom server, is also shown (blue). The top dotted box shows the similarities between DBLε4 and DBLε10 and thus that they should be combined into a single subdomain. The bottom dotted box shows that a small sample of DBLε10 clusters with either DBLε1 or 11.
Figure 8.
Figure 8.. Meme motifs DBLε and CIDRα domains.
Matrix of MEME abundance (from Figure 7) visualized using t-SNE plots for ( a) DBLε and ( b) CIDRα.
Figure 9.
Figure 9.. Diversity projection of domains.
Accumulation plots of the number of domains versus the number of unique domains. Only hits with ≥ 99% amino acid sequence identity over their full lengths included.
Figure 10.
Figure 10.. Diversity in domains.
Boxplots showing sequence identity for 1,000 randomly selected sequences from each domain type based on an all-against-all BLAST analysis. In ( a) all results are shown, in ( b) the sequence matches for the top hits are shown.

References

    1. Voss TS, Healer J, Marty AJ, et al. : A var gene promoter controls allelic exclusion of virulence genes in Plasmodium falciparum malaria. Nature. 2006;439(7079):1004–8. 10.1038/nature04407 - DOI - PubMed
    1. Gardner MJ, Hall N, Fung E, et al. : Genome sequence of the human malaria parasite Plasmodium falciparum. Nature. 2002;419(6906):498–511. 10.1038/nature01097 - DOI - PMC - PubMed
    1. Su XZ, Heatwole VM, Wertheimer SP, et al. : The large diverse gene family var encodes proteins involved in cytoadherence and antigenic variation of Plasmodium falciparum-infected erythrocytes. Cell. 1995;82(1):89–100. 10.1016/0092-8674(95)90055-1 - DOI - PubMed
    1. Taylor HM, Kyes SA, Harris D, et al. : A study of var gene transcription in vitro using universal var gene primers. Mol Biochem Parasitol. 2000;105(1):13–23. 10.1016/s0166-6851(99)00159-0 - DOI - PubMed
    1. Ruybal-Pesántez S, Tiedje KE, Tonkin-Hill G, et al. : Population genomics of virulence genes of Plasmodium falciparum in clinical isolates from Uganda. Sci Rep. 2017;7(1):11810. 10.1038/s41598-017-11814-9 - DOI - PMC - PubMed

LinkOut - more resources