. 2020 Jun;18(3):407-428.
doi: 10.1007/s12021-019-09451-w.

Understanding Computational Costs of Cellular-Level Brain Tissue Simulations Through Analytical Performance Models

Affiliations

Understanding Computational Costs of Cellular-Level Brain Tissue Simulations Through Analytical Performance Models

Francesco Cremonesi et al. Neuroinformatics. 2020 Jun.

Abstract

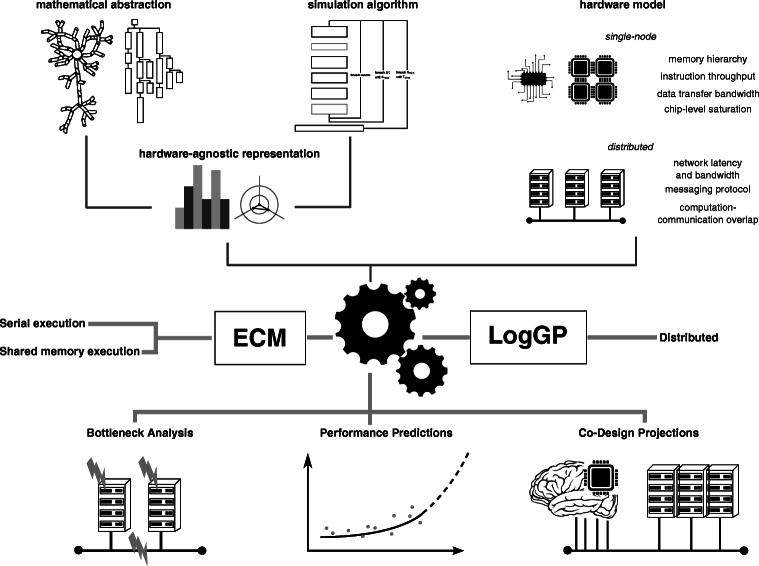
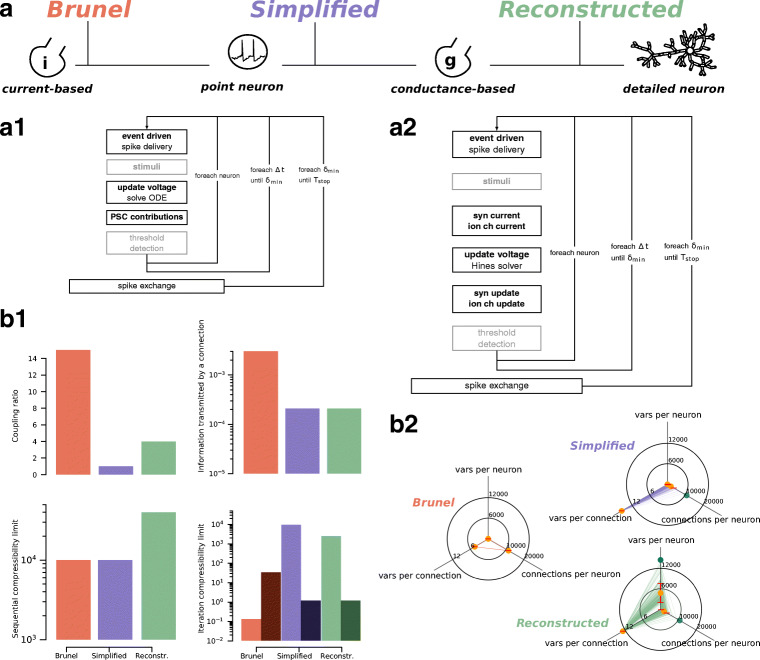
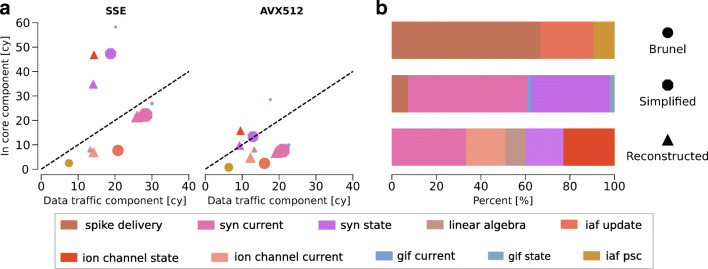
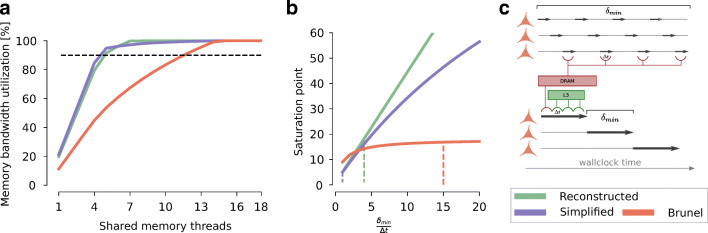
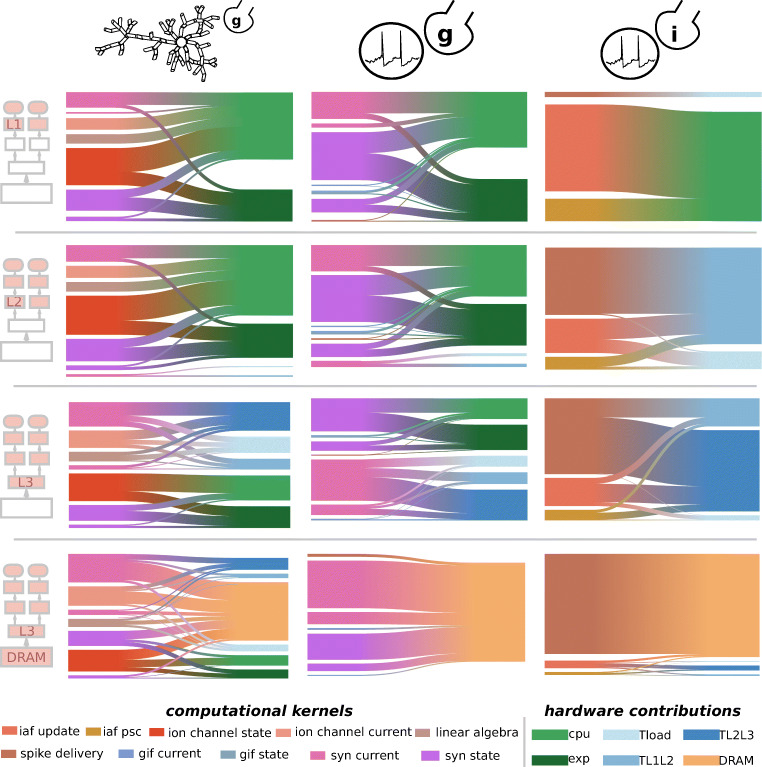
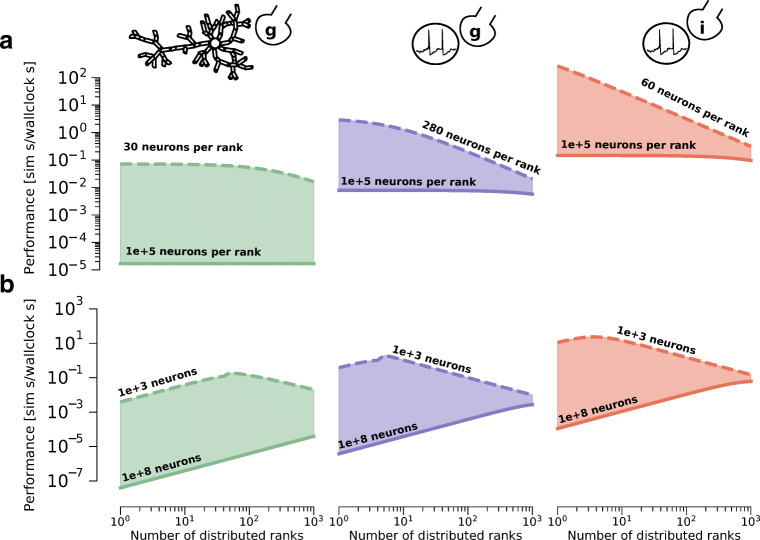
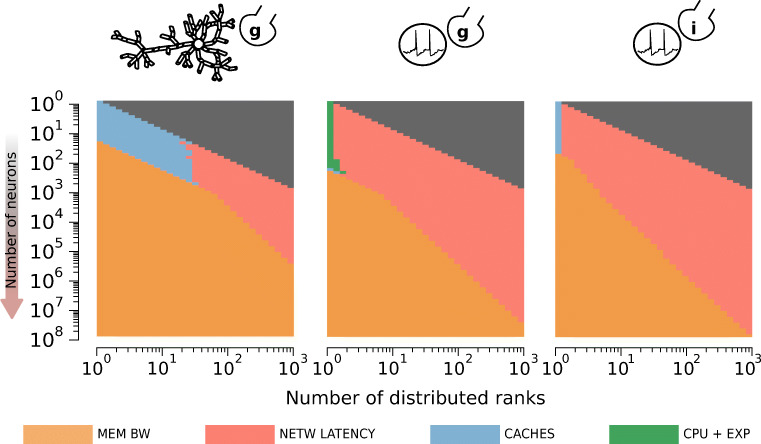
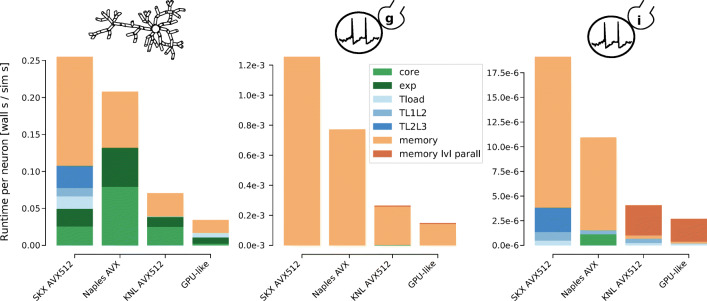
Computational modeling and simulation have become essential tools in the quest to better understand the brain's makeup and to decipher the causal interrelations of its components. The breadth of biochemical and biophysical processes and structures in the brain has led to the development of a large variety of model abstractions and specialized tools, often times requiring high performance computing resources for their timely execution. What has been missing so far was an in-depth analysis of the complexity of the computational kernels, hindering a systematic approach to identifying bottlenecks of algorithms and hardware. If whole brain models are to be achieved on emerging computer generations, models and simulation engines will have to be carefully co-designed for the intrinsic hardware tradeoffs. For the first time, we present a systematic exploration based on analytic performance modeling. We base our analysis on three in silico models, chosen as representative examples of the most widely employed modeling abstractions: current-based point neurons, conductance-based point neurons and conductance-based detailed neurons. We identify that the synaptic modeling formalism, i.e. current or conductance-based representation, and not the level of morphological detail, is the most significant factor in determining the properties of memory bandwidth saturation and shared-memory scaling of in silico models. Even though general purpose computing has, until now, largely been able to deliver high performance, we find that for all types of abstractions, network latency and memory bandwidth will become severe bottlenecks as the number of neurons to be simulated grows. By adapting and extending a performance modeling approach, we deliver a first characterization of the performance landscape of brain tissue simulations, allowing us to pinpoint current bottlenecks for state-of-the-art in silico models, and make projections for future hardware and software requirements.

Keywords: Brain tissue simulations; Computational models of neurons; High performance computing; Performance modeling.


Figures

Fig. 1
Fig. 1
Comprehensive performance modeling of brain tissue simulations. An hardware-agnostic representation of the in silico model is obtained by combining detailed information about the mathematical abstraction, such as e.g. the representation of neurons and its implementation as data structures, or the formulation of the differential equations at the basis of the temporal and spatial dynamics, as well as the simulation algorithm and the dependencies between different simulation phases. This is combined with an abstract representation of the hardware based on a few key parameters, as well as a detailed understanding of the software implementation and the execution of the flow of instructions on the reference hardware, to obtain runtime predictions based on the ECM model for serial and shared-memory execution, and on the LogGP model for interprocess communication. Once our performance model is validated, we use it to predict the performance of brain tissue simulations in multiple configurations, analyze bottlenecks through introspection of the model and provide informed guidelines for the co-design of future hardware
Fig. 2
Fig. 2
In silico models and experiments. Presentation and summary of the in silico models and experiments examined in this paper. a Color-coding for the three in silico models and salient features: in red the I-based point neuron Brunel model, in purple the G-based point neuron Simplified model and in green the G-based detailed neuron Reconstructed model. a1,a2 I-based (resp. G-based) simulation algorithm. The simulation kernels within light grey boxes are included for completeness but are not considered in our analysis because they are not part of the computation loop. The larger boxes denote a synchronization point for distributed simulations. b1 Hardware-agnostic metrics. Coupling ratio denotes the number of simulation timesteps before a global synchronization point. Information transmitted by a connection denotes the average number of variables transmitted via a connection during one minimum delay period. Sequential compressibility limit denotes the number of time iterations required to simulate one second of biological time. Iteration compressibility limit denotes the number of degrees of freedom updated in a δmin interval. Lighter bars represent clock-driven updates, darker bars represent (average) event-driven updates. b2 Breakdown of the unit size metric. This metric captures the memory footprint of in silico models, broken down in three components: number of variables to represent a single neuron excluding synaptic connections, number of variables to represent a connection, and number of connections per neuron. Orange dots represent mean values, red bars represent standard deviation and green dots represent maximal values. The lines represent actual samples from the model
Fig. 3
Fig. 3
Predicted serial performance characteristics of clock-driven computational kernels in brain tissue simulations. We predict the serial runtime of in silico models as a sum of their individual kernels on the reference SKX AVX512 architecture. a: Tcore and Tdata components of the clock-driven kernels from brain tissue simulations. The dashed black line delineates the boundary between core-bound kernels (over the line) and data-bound kernels (under the line). Marker type denotes the in silico model whence the kernel is taken, while marker size is proportional to the relative importance of the kernel in the total runtime. b: breakdown of the relative importance of individual kernels over the total serial runtime
Fig. 4
Fig. 4
Predicted shared-memory performance characteristics. We predict the shared-memory runtime of in silico models as a sum of their individual kernels on the reference SKX AVX512 architecture. a Percentage of memory bandwidth utilization as a function of the number of shared memory threads. The dashed black line denotes the threshold of 90% utilization. b To mitigate the effect of memory bandwidth saturation, a smart ordering of time and neuron loops is implemented by state-of-the-art simulators, as shown in the diagram on the right. We plot the number of threads required to reach saturation of memory bandwidth as a function of the coupling ratio. Different coupling ratios were enforced by keeping the Δt fixed to each model’s published value, and changing the δmin accordingly. Dashed lines represent the actual published values for the coupling ratio. c schematic representation of the loop ordering optimization to improve cache reuse. The top shows the naïve implementation: each neuron, represented by an horizontal line, is advanced by a single timestep, as shown by the short black arrows. In this case, every time a neuron’s state is advanced by one timestep data must be fetched from the main memory (red lines), since the caches will be overwritten by the data from other neurons at the same timestep. The bottom shows the optimized version: each neuron is advanced by several timesteps (longer black arrows) until it reaches a δmin boundary. In the optimized version data must be fetched from main memory only during the first timestep, while consequent operations can reuse the data for the same neuron immediately (green lines represent data coming from the L3 cache)
Fig. 5
Fig. 5
Predicted shared-memory runtime contributions from computational kernels and hardware features. We assume a single node of the SKX AVX512 and using the maximum number of threads (18 threads). We do not make the assumption of memory bandwidth saturation, but we assume that the loop ordering optimization is used. For each level of the cache hierarchy, we show the breakdown of the total runtime into computational kernels on the left of each box. Furthermore, we show the breakdown of the runtime, as well as the breakdown of individual computational kernels, into hardware contributions on the right of each box. Hardware contributions labels have the following meaning: CPU stands for the execution of non-memory access instructions in the core (excluding the exponential function), exp for the computation of exponential function, Tload for the execution of memory access instructions in the core, and the rest for the data traffic time of the relevant datapath
Fig. 6
Fig. 6
Performance of distributed scaling and most relevant hardware bottlenecks. The SKX AVX512 architecture with HPE Infiniband EDR is used as reference. a Predicted performance of the three in silico models in a memory constrained scenario. We consider different numbers of neurons per distributed ranks. The solid lines represent simulations with 105 neurons per rank, while the dashed lines represent the estimated minimum number of neurons that is still larger than an L3 cache. The unit of performance is simulated seconds per wallclock second to simulate the whole network. b Predicted performance of the three in silico models in a constant problem size scenario. We consider different total network sizes. The dashed and solid lines represent simulations with networks of 103 and 108 neurons respectively. The unit of performance is simulated seconds per wallclock second to simulate the whole network
Fig. 7
Fig. 7
The SKX AVX512 architecture with HPE Infiniband EDR is used as reference. Most prominent hardware bottlenecks as a function of the total number of neurons (inverted y axis) and the number of distributed ranks (x axis) in the simulation. The grey areas denote a configuration that would require splitting of individual neurons, and are thus deemed outside the scope of this investigation.
Fig. 8
Fig. 8
Breakdown of contributions to total runtime from individual hardware features. Bars represent the total predicted runtime on different strawman hardware architectures for the Reconstructed, Simplified and Brunel model on the left, center and right respectively. Each strawman architecture represents a simplified version of the target hardware, capturing salient hardware properties such as the amount of available shared-memory parallelism, the memory bandwidth, the clock frequency and the memory hierarchy. The rest of the hardware details, most notably the throughput of instructions in the core and the memory level parallelism and latency, were obtained by adapting the corresponding known values from the reference Skylake architecture. The meaning of individual hardware contributions is based on the corresponding ECM model dimension as in Fig. 5
Fig. 9
Fig. 9
a Stacked plot of the mean relative contributions from hardware features as a function of the average firing frequency of neurons in the simulation. The mean was extracted by simulating 1000 randomly generated simulation configurations, defined by number of neurons and number of distributed ranks. b Stacked plot of the mean relative contributions from hardware features as a function of the δmin. The range of acceptable values for δmin changes across different in silico models because they were computed as multiples of the model’s timestep, hence the greyed-out areas. c Number of neurons able to fit in 1 GB of memory, normalized by the memory requirements of a model with 10 incoming synapses, as a function of the average fan in per neuron. d Contour plot of predicted memory requirements of the connections table, as a function of the total number of neurons (x axis) and the number of distributed ranks (y axis). The contour levels corresponding to 1 KB, 1 MB and 1 GB are shown for different values of the fan in

References

    1. Aamir, S.A., Stradmann, Y., Müller, P., Pehle, C., Hartel, A., Grübl, A., Schemmel, J., Meier, K. (2018). An accelerated lif neuronal network array for a large-scale mixed-signal neuromorphic architecture. IEEE Transactions on Circuits and Systems I: Regular Papers (99), 1–14. 10.1109/tcsi.2018.2840718.
    1. Akar, N.A., Cumming, B., Karakasis, V., Küsters, A., Klijn, W., Peyser, A., Yates, S. (2019). Arbor: a morphologically-detailed neural network simulation library for contemporary high-performance computing architectures. In 2019 27th euromicro international conference on parallel, distributed and network-based processing (PDP) (pp. 274–282): IEEE, 10.1109/empdp.2019.8671560
    1. Alexandrov A, Ionescu MF, Schauser KE, Scheiman C. Loggp: Incorporating long messages into the logp model for parallel computation. Journal of Parallel and Distributed Computing. 1997;44(1):71–79. doi: 10.1006/jpdc.1997.1346. - DOI
    1. Ananthanarayanan, R., & Modha, D.S. (2007). Anatomy of a cortical simulator. In Proceedings of the 2007 ACM/IEEE conference on Supercomputing (p. 3): ACM, 10.1145/1362622.1362627
    1. Ananthanarayanan, R., Esser, S.K., Simon, H.D., Modha, D.S. (2009). The cat is out of the bag: cortical simulations with 10 9 neurons, 10 13 synapses. In Proceedings of the conference on high performance computing networking, storage and analysis (p. 63): ACM.

Publication types

LinkOut - more resources