. 2020 Jun 15;37(12):1463-1480.
doi: 10.1089/neu.2019.6725. Epub 2020 Mar 16.

Modulation of Post-Traumatic Immune Response Using the IL-1 Receptor Antagonist Anakinra for Improved Visual Outcomes

Affiliations

Modulation of Post-Traumatic Immune Response Using the IL-1 Receptor Antagonist Anakinra for Improved Visual Outcomes

Lucy P Evans et al. J Neurotrauma. .

Abstract

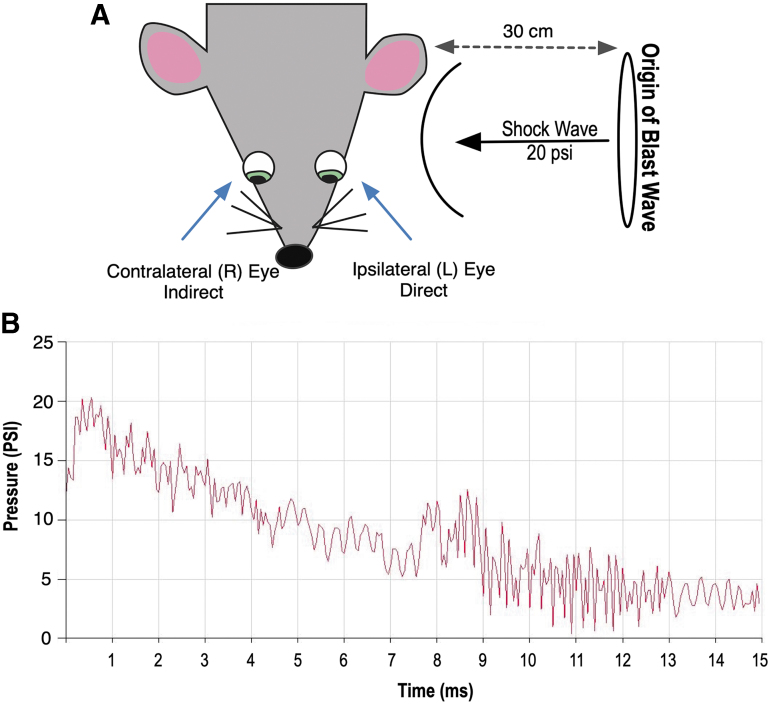
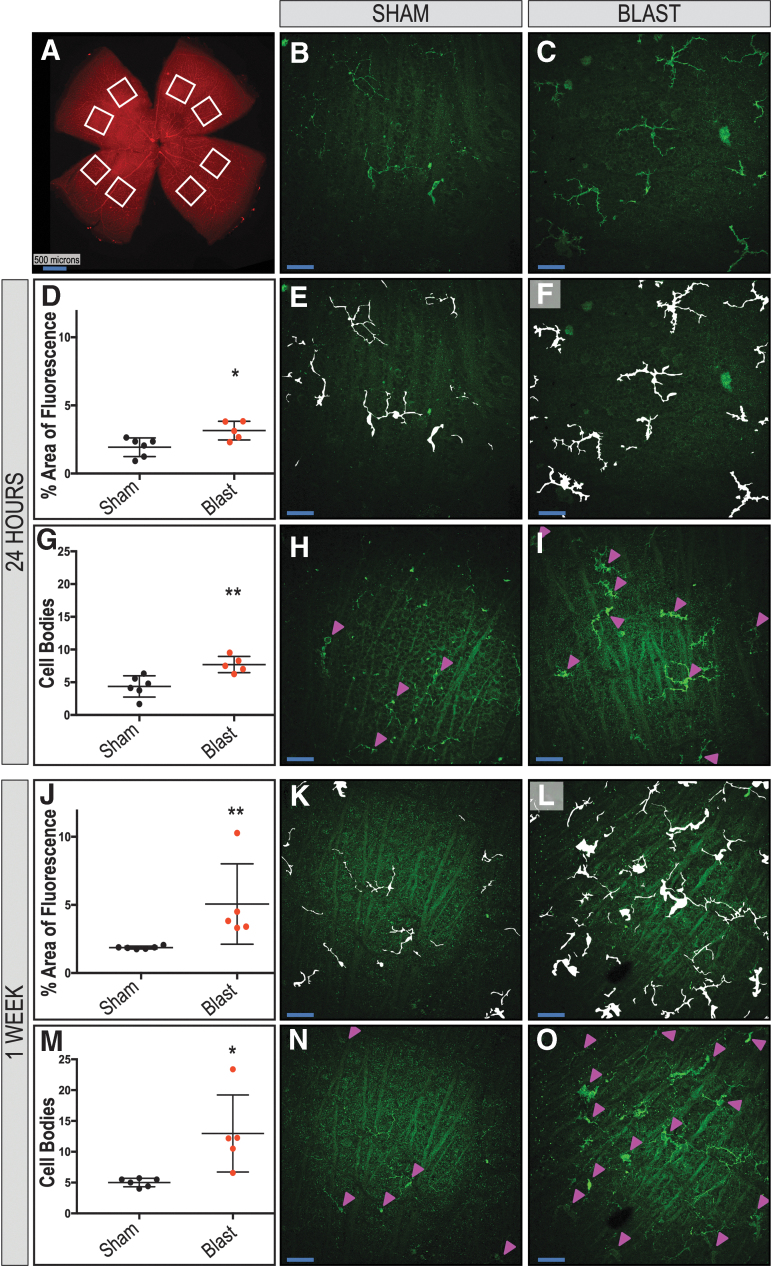
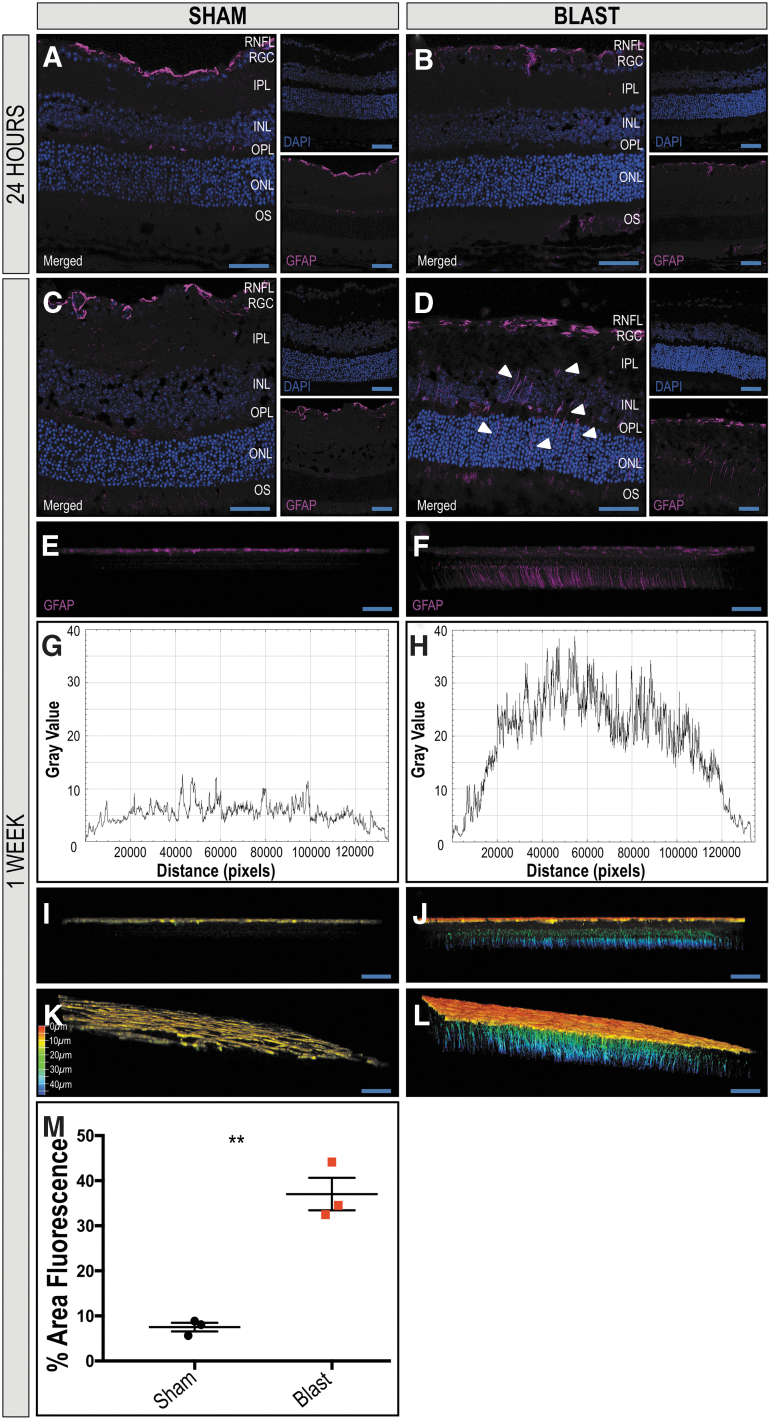
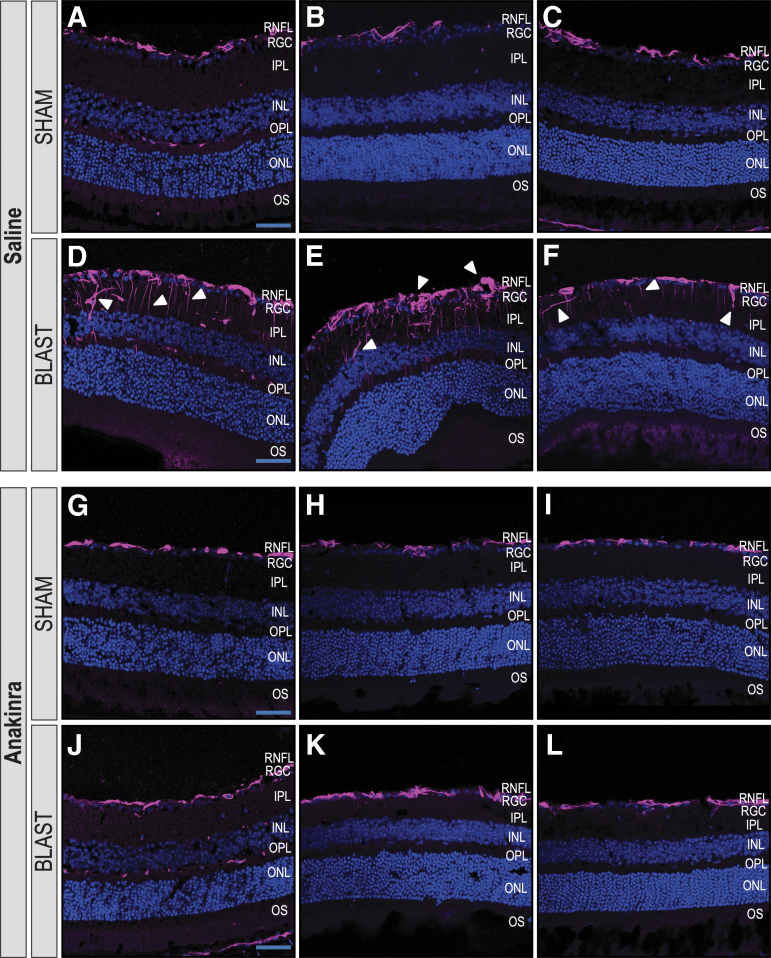
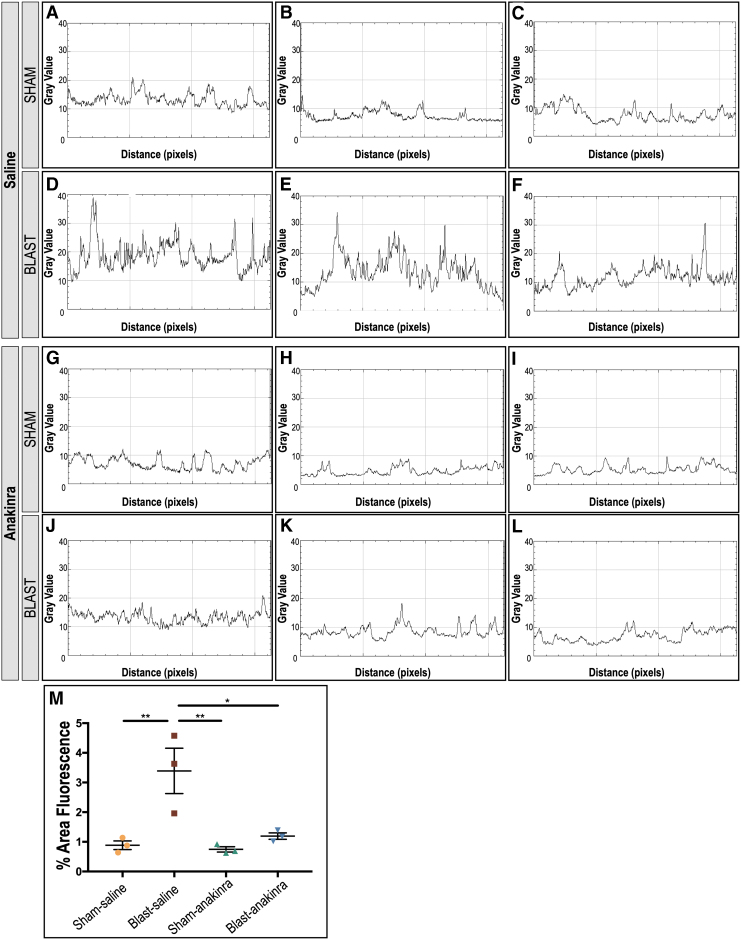
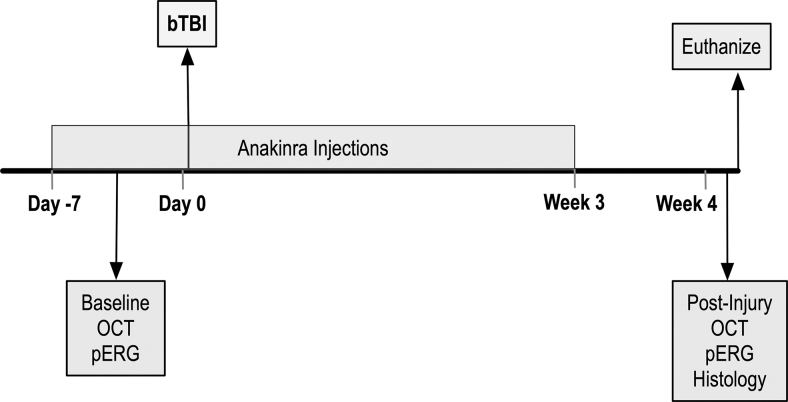
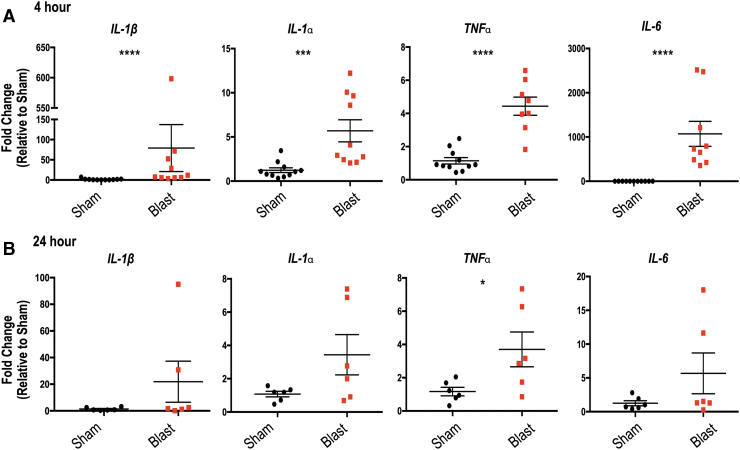
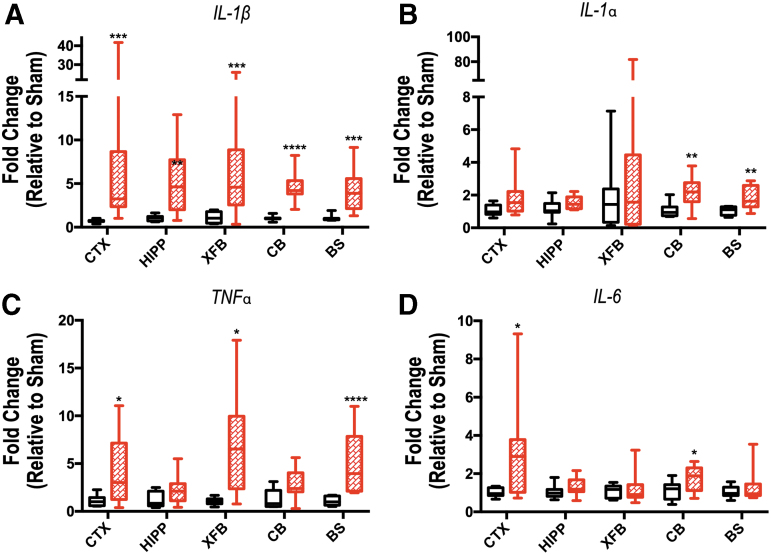
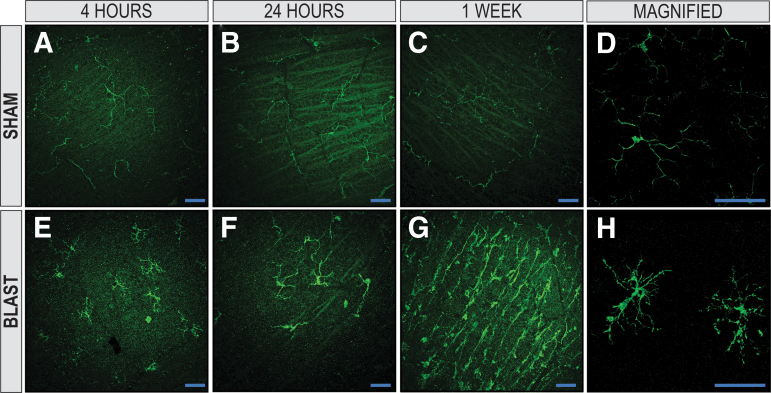
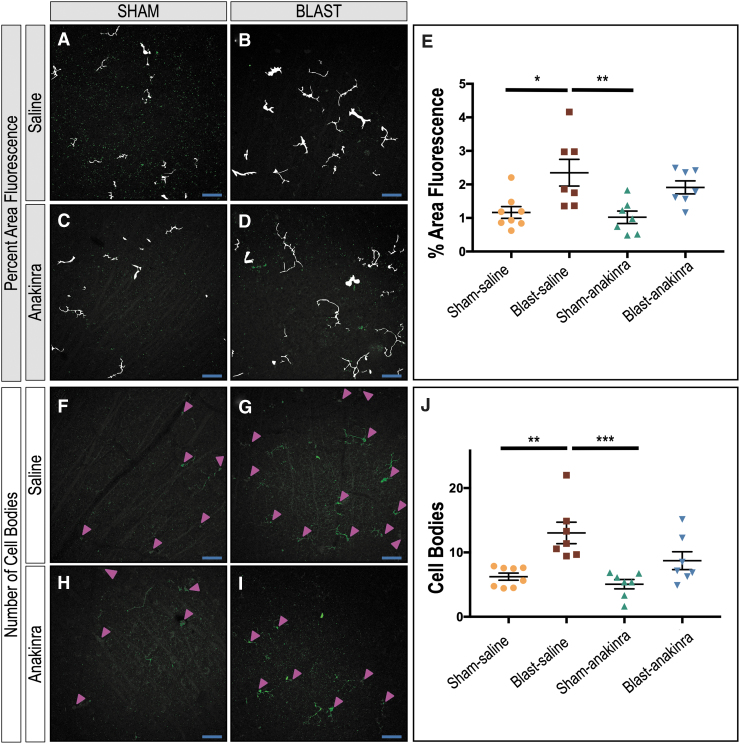
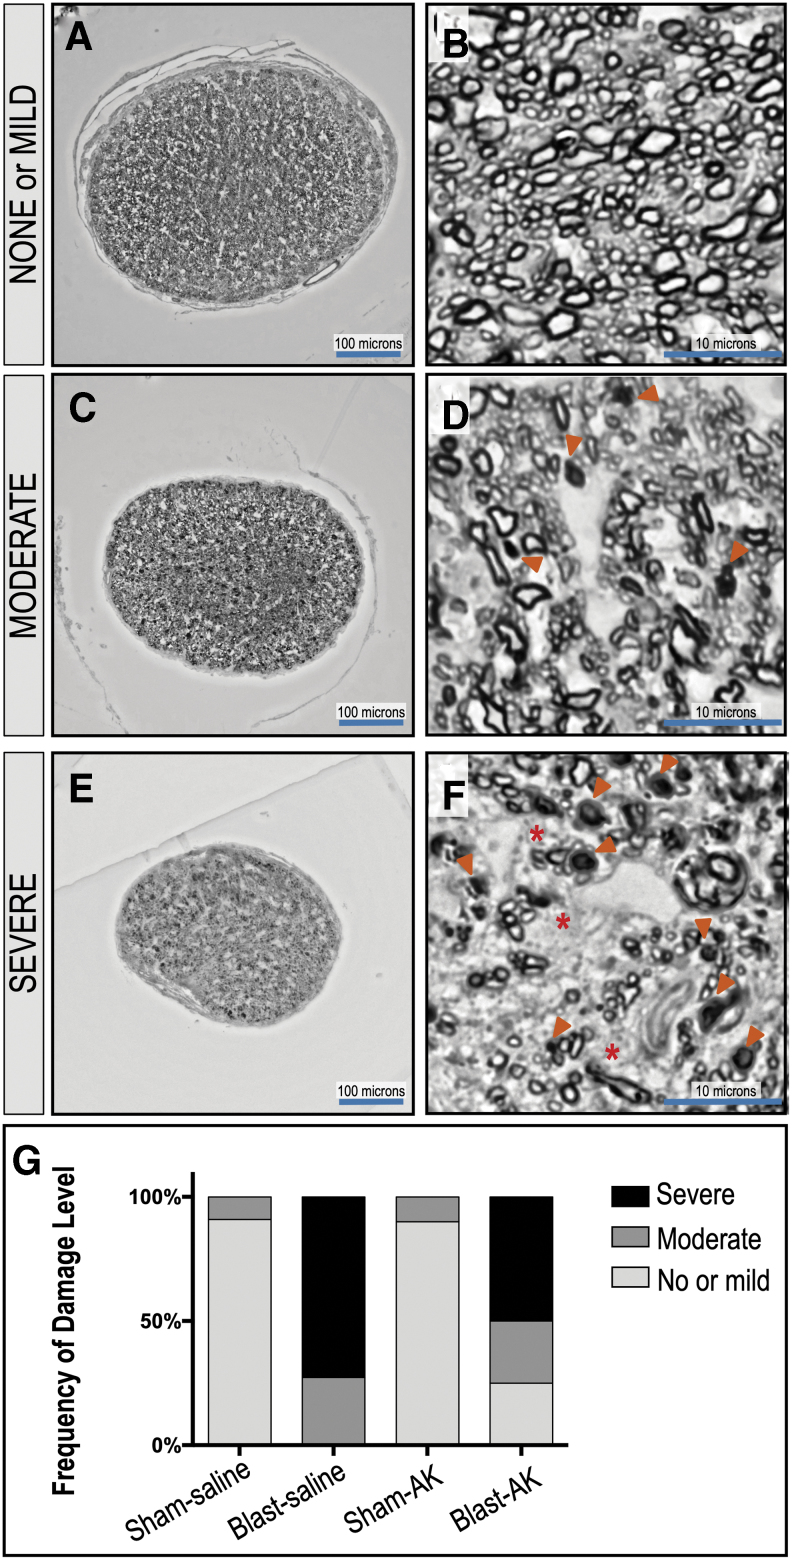
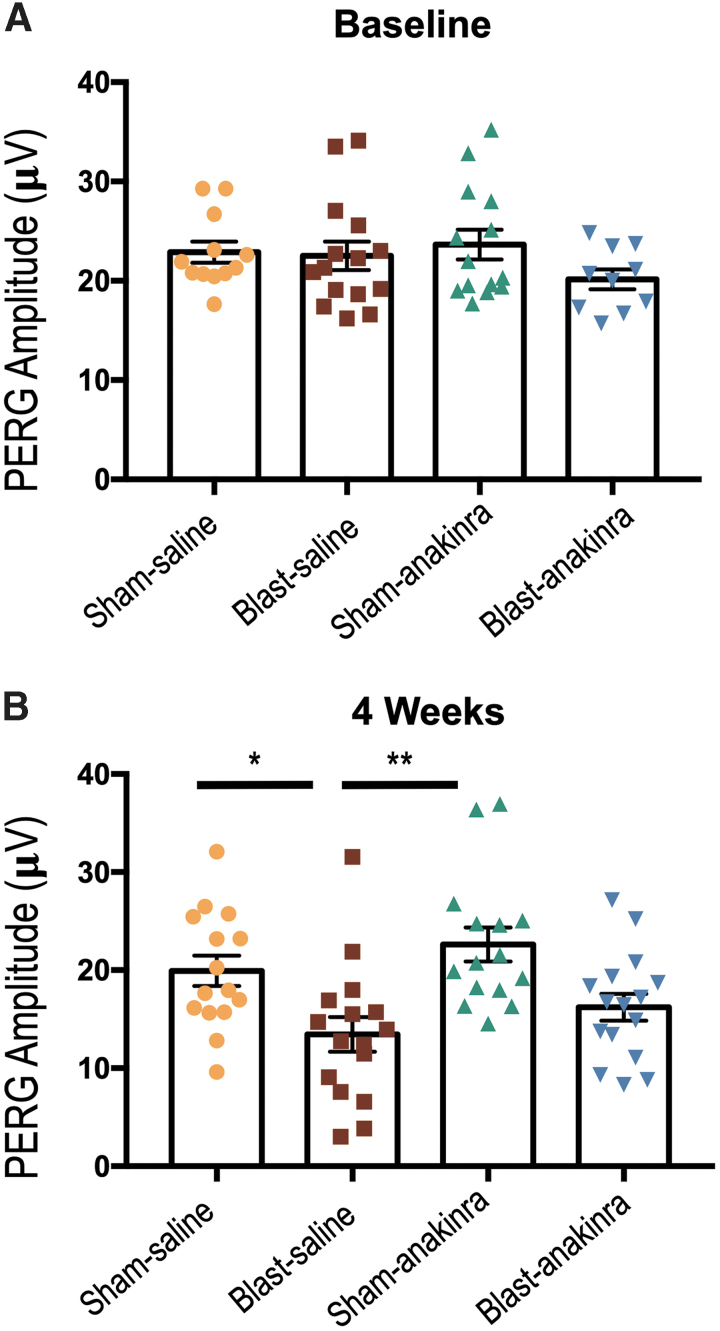
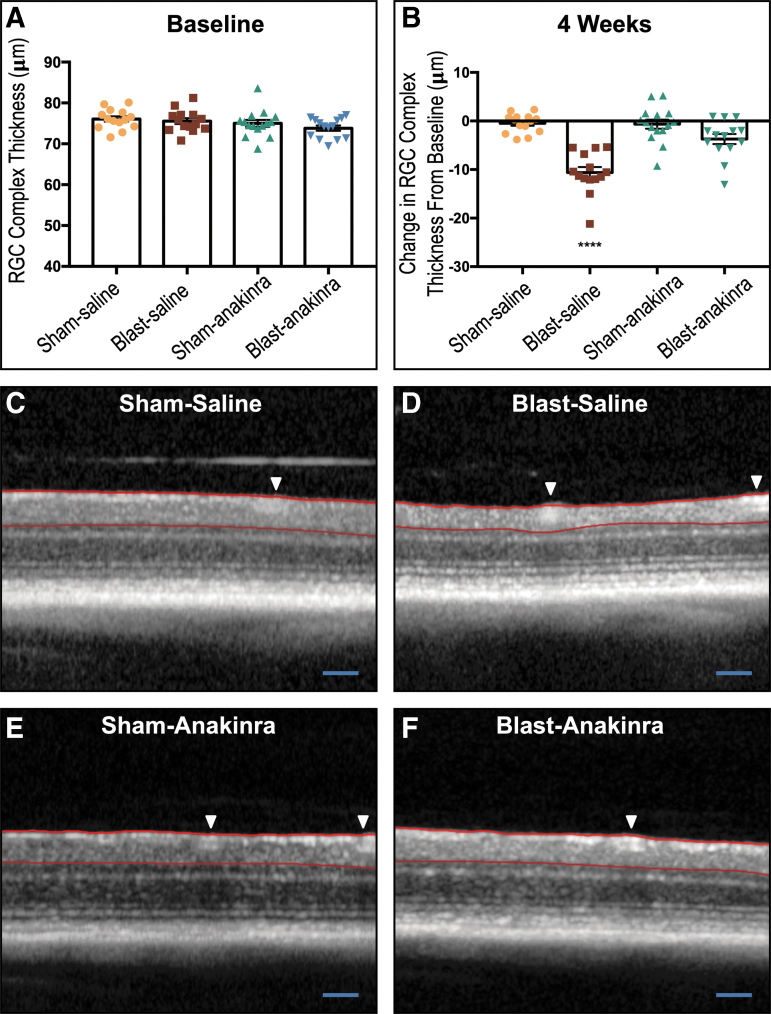
The purpose of this study was to characterize acute changes in inflammatory pathways in the mouse eye after blast-mediated traumatic brain injury (bTBI) and to determine whether modulation of these pathways could protect the structure and function of retinal ganglion cells (RGC). The bTBI was induced in C57BL/6J male mice by exposure to three 20 psi blast waves directed toward the head with the body shielded, with an inter-blast interval of one hour. Acute cytokine expression in retinal tissue was measured through reverse transcription-quantitative polymerase chain reaction (RT-qPCR) four hours post-blast. Increased retinal expression of interleukin (lL)-1β, IL-1α, IL-6, and tumor necrosis factor (TNF)α was observed in bTBI mice exposed to blast when compared with shams, which was associated with activation of microglia and macroglia reactivity, assessed via immunohistochemistry with ionized calcium binding adaptor molecule 1 and glial fibrillary acidic protein, respectively, one week post-blast. Blockade of the IL-1 pathway was accomplished using anakinra, an IL-1RI antagonist, administered intra-peritoneally for one week before injury and continuing for three weeks post-injury. Retinal function and RGC layer thickness were evaluated four weeks post-injury using pattern electroretinogram (PERG) and optical coherence tomography (OCT), respectively. After bTBI, anakinra treatment resulted in a preservation of RGC function and RGC structure when compared with saline treated bTBI mice. Optic nerve integrity analysis demonstrated a trend of decreased damage suggesting that IL-1 blockade also prevents axonal damage after blast. Blast exposure results in increased retinal inflammation including upregulation of pro-inflammatory cytokines and activation of resident microglia and macroglia. This may explain partially the RGC loss we observed in this model, as blockade of the acute inflammatory response after injury with the IL-1R1 antagonist anakinra resulted in preservation of RGC function and RGC layer thickness.

Keywords: IL-1; anakinra; blast; retina; visual function.


Conflict of interest statement

No competing financial interests exist.

Figures

FIG. 1.
FIG. 1.
Schematic representation of blast exposure. Exposure to blast wave pressure was conducted as described previously. Animals were placed lateral to the shock tube axis, 30 cm from the origin of the blast wave (Mylar membrane), with the left (L) side of the head (ipsilateral eye) facing the blast wave. (A) Control mice were restrained the same way, but were not exposed to the blast wave. (B) A representative tracing of a 20 ± 0.2 psi (137.8 ± 1.3 kPa, mean ± SEM) blast wave.
FIG. 2.
FIG. 2.
Increased immunoreactivity and distribution of IBA-1-positive microglia are found in retinas exposed to blast. Eight regions were sampled per ipsilateral retina (A). Quantification shows an increase in total fluorescence area (D, J) and cell body counts (G, M) after blast in the retinal nerve-fiber layer (RNFL) and retinal ganglion-cell layer of whole-mounted retinas at 24 h and one week, respectively. Representative images (B, C) and mask overlays of area are quantified (E, H, K, M and F, I, L, O) for sham and blast-injured mice, respectively. Arrowheads indicate cell bodies (H, I, N, O). Student t test or Mann-Whitney U test are based on distribution of data. *p < 0.05; **p < 0.01. Data are expressed as means ± SEM. n = 5–6 mice per group. X25, original magnification; en face view with the RNFL facing up. Scale bar: 50 μm unless otherwise noted.
FIG. 3.
FIG. 3.
Extended distribution of glial fibrillary acidic protein (GFAP) in Müller glia in retinas ipsilateral to blast exposure suggests increased damage. The GFAP localizes to the retinal nerve fiber layer (RNFL) of retinas of sham and blast mice 24 h after injury (A, B, respectively). One week after blast exposure, the distribution of GFAP immunoreactivity remains in the RNFL of sham mice (C), but increases in Müller glia spanning the retina from the RNFL to the outer nuclear layer (ONL) in blast mice (D) in retinal cross sections. A two-dimensional side facing view of a reconstructed z-stack acquired repeatedly in 0.5 μm confocal sections along the z-axis of retinal whole mounts demonstrates GFAP reactivity limited to the RNFL of sham mice (E) and spanning throughout the retina in blast mice (F). A plot-profile displaying pixel intensity of the GFAP staining in E and F demonstrates a quantitative increase in intensity in the blast retina (H) when compared with sham (G). Figures I–L are depth coded images demonstrate GFAP+ extension into deeper retinal layers of blast mice (J, L) when compared with sham (I, K). Color scale bar corresponds to the z-axis depth of GFAP positive cells as the distance from the vitreous, coded from red at 0 μm and blue at 50 μm. Quantification (M) demonstrates a significant increase in total fluorescent area in the retinas from blast-injured mice when compared with sham-injured mice. Significance was determined via Student t test (**p = 0.0014). Data expressed as means ± SEM. n = 3 per condition. X25, original magnification; scale bar: 50 μm. RGC, retinal ganglion-cell layer; IPL, inner plexiform layer; INL, inner nuclear layer; OPL, outer plexiform layer; OS, photoreceptor outer segments.
FIG. 4.
FIG. 4.
Anakinra treatment prevents Müller glia activation in the retina after blast. Distribution of glial fibrillary acidic protein (GFAP) in retinas ipsilateral to blast exposure are seen four weeks after injury. Images of areas with the highest GFAP reactivity are shown in retinal cross sections of three individual mice per group. The GFAP localizes to the retinal nerve fiber layer (RNFL) of retinas of sham-saline (A–C) and sham-anakinra (D–F) mice four weeks after blast injury. Retinas from blast-saline mice demonstrate increased GFAP immunoreactivity in Müller glia spanning the retina from the RNFL into deeper layers (G–I). Blast-anakinra mice, however, show decreased GFAP immunoreactivity overall (J–L) when compared with the injury group only given saline. n = 3 mice per group. RGC, retinal ganglion-cell layer; IPL, inner plexiform layer; INL, inner nuclear layer; OPL, outer plexiform layer; ONL, outer nuclear layer; OS, photoreceptor outer segments.
FIG. 5.
FIG. 5.
Quantification of glial fibrillary acidic protein (GFAP) suggests anakinra treatment prevents Müller glia activation in the retina after blast. Plot-profiles display pixel intensity of the GFAP staining in retinal cross section images from Figure 4. Blast-saline (D–F) images demonstrate increased GFAP intensity compared with sham-saline (A–C), sham-anakinra (G–I), and blast-anakinra (J–L). Quantification (M) demonstrates a significant increase in the total fluorescent area in the retinal sections from blast-saline mice when compared with all other groups. No other significant differences were found. Significance was determined by comparing means of all groups using one-way analysis of variance with the Dunnett post-test (*p < 0.05, **p < 0.01). Data expressed as means ± SEM. n = 3 per condition.
FIG. 6.
FIG. 6.
Experimental design of anakinra treatment. Mice were given daily intraperitoneal injections of either saline or anakinra beginning one week before injury and continuing three weeks after. Optical coherence tomography (OCT) and pattern electroretinogram (PERG) were conducted before injury as a pre-blast baseline and four weeks after, followed by euthanasia and tissue collection for histological analysis of retinal and optic nerve tissue.
FIG. 7.
FIG. 7.
Retinal expression of inflammatory markers is increased 4 h post-repeated blast traumatic brain injury (bTBI). Quantitative polymerase chain reaction measuring mRNA levels relative to glyceraldehyde-3-phosphate dehydrogenase (GAPDH) at (A) 4 h and (B) 24 h post-bTBI. Increased expression of interleukin (IL)-1β, IL-1α, tumor necrosis factor (TNF)α, and IL-6 in the ipsilateral retinas of blast-injured mice was seen when normalized to sham values at 4 h after injury. At 24 h, only TNFα is increased in the blast retinas. Student t test or Mann-Whitney U test based on distribution of data. *p < 0.05; ***p < 0.001; ****p < 0.0001. Data expressed as means ± standard error of the mean. n = 8–11 and six mice per group at 4 h and 24 h, respectively.
FIG. 8.
FIG. 8.
Inflammatory cytokine expression in brain tissue demonstrates regional changes 4 h after repeated blast traumatic brain injury. Expression of interleukin (IL)-1β (A), IL-1α (B), tumor necrosis factor (TNF)α (C), and IL-6 (D) was evaluated by quantitative polymerase chain reaction in the ipsilateral cortex (CTX), hippocampus (HIPP), extra forebrain (XFB), cerebellum (CB), and brainstem (BS). The mRNA levels are relative to the housekeeping gene GAPDH (glyceraldehyde-3-phosphate dehydrogenase). Data are expressed as fold change in gene expression relative to sham and are presented as box and whiskers plots; the box extends from the 25th to the 75th percentiles, the line represents the median, and the whiskers extend from smallest to largest value. Student t test or Mann-Whitney U test based on distribution of data. *p < 0.05; **p < 0.01; ***p < 0.001; ****p < 0.0001. n = 7–8 mice per group.
FIG. 9.
FIG. 9.
Microglia are activated in retinas of blast-injured animals. The IBA-1+ microglia in the retinal nerve-fiber layer (RNFL) and retinal ganglion-cell layer of retinal whole-mounts exposed to blast injury. Retinas from sham animals had a ramified morphology at 4 h, 24 h, and one week (A, B, and C, respectively). At 4 h, 24 h, and one week post-injury (E, F, and G, respectively), blast-injured retinas demonstrated hyper-ramified and bushy microglia, suggesting activation from injury. A two-dimensional en face view of a reconstructed z-stack acquired repeatedly in 0.5 μm confocal sections along the z-axis of retinal whole mounts demonstrates magnified representative images of ramified, resting sham and hyperramified, activated blast microglia shown in D and H, respectively (X63, original magnification). X25, original magnification for A–C and E–G; en face view with the RNFL facing up. Scale bar: 50 μm.
FIG. 10.
FIG. 10.
Anakinra treatment prevents microglial activation in the retina after blast. Mask overlays of the fluorescent area quantified (A, B, C, D) and arrowheads indicating cell bodies (F, G, H, I) for ipsilateral retinas of sham-saline, blast-saline, sham-anakinra, and blast-anakinra groups, respectively. Quantification shows a significant increase in total fluorescent area (F) and cell body counts (J) in the retinal nerve-fiber layer and retinal ganglion-cell layer of whole-mounted retinas from blast-saline mice when compared with both the sham-saline and anakinra-saline groups. No other significant differences were found. Significance determined comparing means of all groups using one-way analysis of variance with Dunnett post-test (*p < 0.05, **p < 0.01, ***p < 0.001). Data expressed as means ± standard error of the mean. Eight regions sampled per retina; n = 7–8 mice per group. X25, original magnification; scale bar: 50 μm.
FIG. 11.
FIG. 11.
Anakinra treatment supports survival of axon bundles in the optic nerve after blast. The degree of neurodegeneration was assessed by analysis of the optic nerve axonal damage across sections of sham-saline, blast-saline, sham-anakinra, and blast-anakinra groups (n = 11, 11, 10, and 12, respectively). Representative low and high magnification image of ipsilateral optic nerve cross sections. Damage levels are based on grade. Grade 1: healthy-mild damage (A, B), Grade 2: moderate damage (C, D), Grade 3: severe damage (E, F). Arrowheads indicate paraphenylenediamine-positive and infilled dead/dying axons; asterisks indicate glial scar formation adjacent to glial cell nuclei. Frequency of damage level demonstrates that treatment with anakinra prevents damage of the optic nerve (G).
FIG. 12.
FIG. 12.
Blast-induced functional RGC damage post-repeated blast exposure is partially prevented by anakinra. There were no significant differences between groups at pre-blast baseline measurements (A). At four weeks post-injury, the pattern-evoked electroretinography (PERG) analysis revealed deficits in the blast-saline group, but not in the sham-anakinra or blast-anakinra groups (B), suggesting a partial rescue of RGC function. No other significant differences were found. All PERG recordings are of ipsilateral retinas and were measured in the neutral position. Significance was determined comparing means of all groups using Kruskal-Wallis test with the Dunn post-test (*p < 0.05, **p < 0.01). Data expressed as means ± SEM; n = 10–16.
FIG. 13.
FIG. 13.
The retinal ganglion cell (RGC) complex loss from blast exposure is prevented partially by anakinra. The area between the red lines is the RGC complex thickness measured. No significant differences between groups were seen at pre-blast baseline (A). At four weeks post-injury, both sham groups and the blast-anakinra group had significantly less change in the RGC complex from baseline when compared with the blast-saline group, with no significant differences found between other groups (B). Representative optical coherence tomography images of sham-saline (C), blast-saline (D), sham-anakinra (E), and blast-anakinra (F). Arrows indicate blood vessels excluded from analysis. All data from ipsilateral retinas. One-way analysis of variance with a Dunnett post-test comparing all means (****p < 0.0001). Data expressed as means ± SEM; n = 14–16. Scale bar: 200 μm.

References

    1. Cockerham G.C., Goodrich G.L., Weichel E.D., Orcutt J.C., Rizzo J.F., Bower K.S., and Schuchard R.A. (2009). Eye and visual function in traumatic brain injury. J. Rehabil. Res. Dev. 46, 811–818 - PubMed
    1. Cockerham G.C., Rice T.A., Hewes E.H., Cockerham K.P., Lemke S., Wang G., Lin R.C., Glynn-Milley C., and Zumhagen L. (2011). Closed-eye ocular injuries in the Iraq and Afghanistan wars. N. Engl. J. Med. 364, 2172–2173 - PubMed
    1. London A., Benhar I., and Schwartz M. (2013). The retina as a window to the brain–from eye research to CNS disorders. Nat. Rev. Neurol. 9, 44–53 - PubMed
    1. Cho R.I., Bakken H.E., Reynolds M.E., Schlifka B.A., and Powers D.B. (2009). Concomitant cranial and ocular combat injuries during Operation Iraqi Freedom. J. Trauma 67, 516–520;. - PubMed
    1. Bricker-Anthony C., Hines-Beard J., and Rex T.S. (2014). Molecular changes and vision loss in a mouse model of closed-globe blast trauma. Invest. Ophthalmol. Vis .Sci. 55, 4853–4862 - PMC - PubMed

Publication types

MeSH terms

Substances