

Discordant placental oxygenation and autophagy in twin anemia-polycythemia sequence (TAPS)
- PMID: 32056557
- PMCID: PMC7912434
- DOI: 10.1016/j.placenta.2019.11.003
Discordant placental oxygenation and autophagy in twin anemia-polycythemia sequence (TAPS)
Abstract
Background: (Macro)autophagy is an important process of self-degradation of macromolecules and organelles that ensures cellular homeostasis and energy preservation during stressful conditions. Dysregulated placental autophagy has been implicated in a wide range of pregnancy complications. Recent studies identified hypoxia as a key regulator of trophoblast autophagy in vitro; however, its effects on placental autophagy in vivo remain incompletely understood. In this study, we evaluated the monochorionic twin anemia-polycythemia sequence (TAPS) placenta as model of discordant placental oxygenation to determine the effects of hypoxia on placental autophagy in utero.
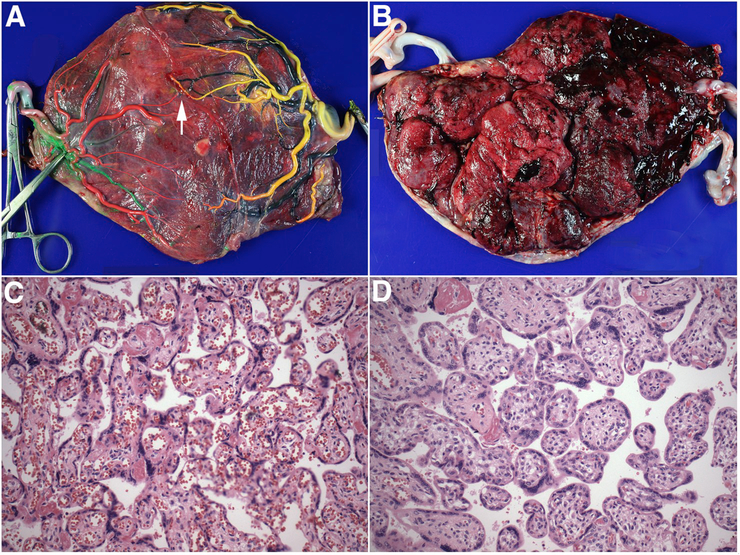
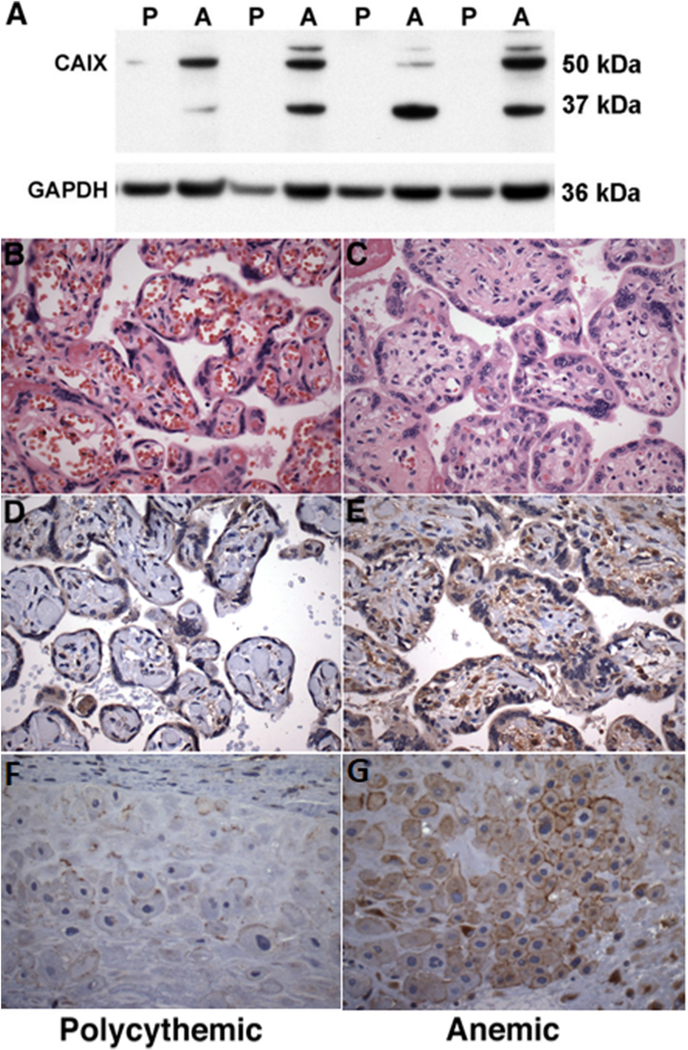
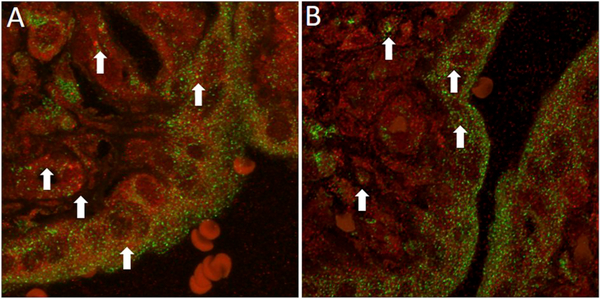
Methods: We performed a retrospective comparative analysis of tissue oxygenation and autophagy in anemic and polycythemic territories of TAPS placentas (N = 12). Archival tissues were subjected to immunohistochemical, immunofluorescence and Western blot analyses of carbonic anhydrase (CA) IX (hypoxia marker) and key autophagy/lysosomal markers.
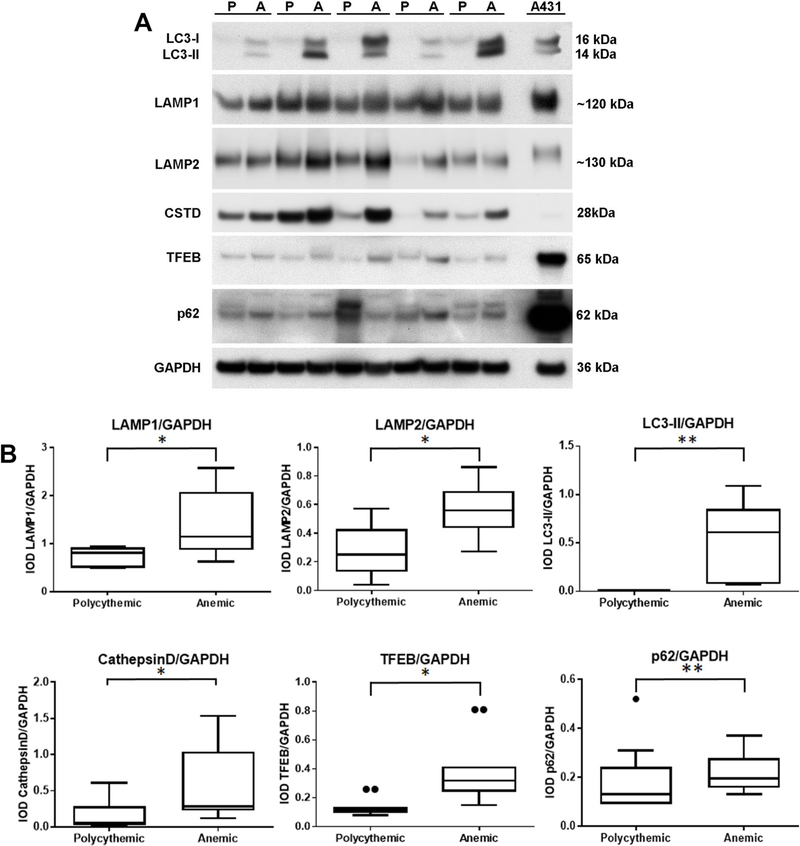
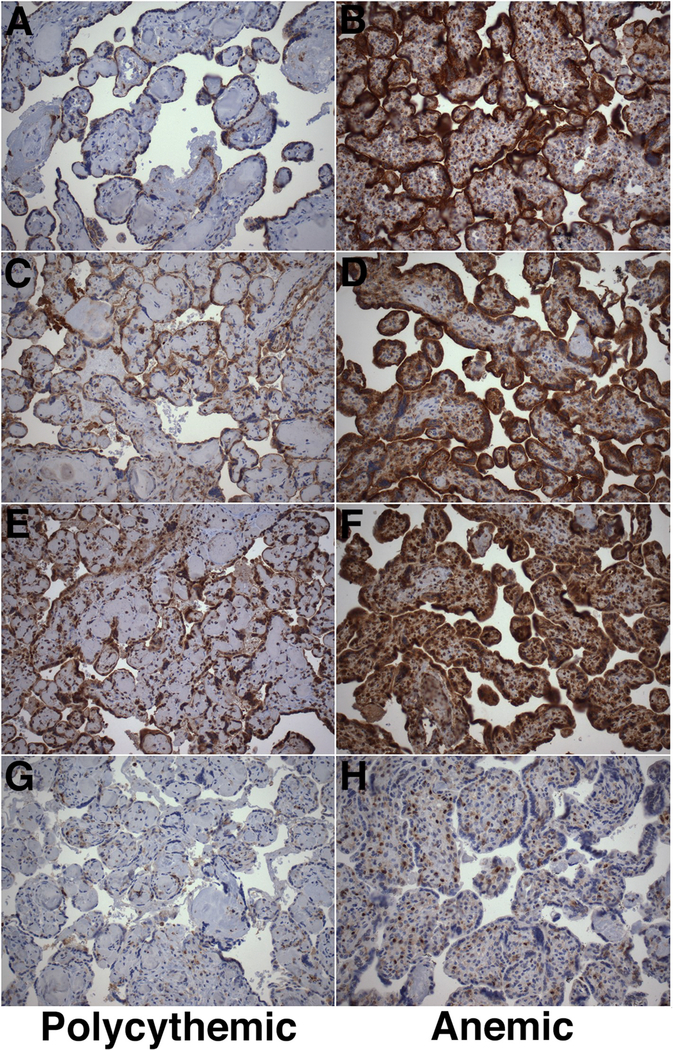
Results: CAIX protein levels were significantly higher in anemic twin territories than in corresponding polycythemic territories, consistent with relative tissue hypoxia. Anemic placental shares further displayed significantly higher levels of LC3I/II (autophagosome markers) and LAMP1/2 (lysosome markers), associated with upregulated expression of lysosome/autophagosome activity-associated markers, transcription factor EB and cathepsin D. The accumulation of autophagosomes and lysosomes in anemic shares was accompanied by elevated p62 protein expression, suggestive of inhibition of the downstream autophagy pathway.
Conclusions: TAPS placentas display striking intertwin discordance in tissue oxygenation and autophagic activity and may provide a suitable model for study of the interrelationship between hypoxia, autophagy, and pregnancy outcome in a monochorionic twin setting.
Keywords: Growth restriction; Hypoxia; Monochorionic; Preeclampsia; p62.
Copyright © 2019 Elsevier Ltd. All rights reserved.
Conflict of interest statement
Declaration of competing interest We have no conflict of interest.
Figures
Similar articles
-
Increased placental expression of angiotensin-converting enzyme 2, the receptor of SARS-CoV-2, associated with hypoxia in twin anemia-polycythemia sequence (TAPS).Placenta. 2021 Feb;105:7-13. doi: 10.1016/j.placenta.2021.01.008. Epub 2021 Jan 15. Placenta. 2021. PMID: 33497931 Free PMC article.
-
Placental share and hemoglobin level in relation to birth weight in twin anemia-polycythemia sequence.Placenta. 2014 Dec;35(12):1070-4. doi: 10.1016/j.placenta.2014.09.019. Epub 2014 Oct 7. Placenta. 2014. PMID: 25449031
-
Quantified discordant placental echogenicity in twin anemia-polycythemia sequence (TAPS) and middle cerebral artery peak systolic velocity.Ultrasound Obstet Gynecol. 2018 Sep;52(3):373-377. doi: 10.1002/uog.17535. Epub 2018 Jul 23. Ultrasound Obstet Gynecol. 2018. PMID: 28557152
-
In utero Partial Exchange Transfusion Combined with in utero Blood Transfusion for Prenatal Management of Twin Anemia-Polycythemia Sequence.Fetal Diagn Ther. 2019;45(1):28-35. doi: 10.1159/000486198. Epub 2018 Mar 13. Fetal Diagn Ther. 2019. PMID: 29533957 Review.
-
[Report of a case with twin anemia-polycythemia sequence and literature review].Zhonghua Er Ke Za Zhi. 2013 Jan;51(1):21-8. Zhonghua Er Ke Za Zhi. 2013. PMID: 23527927 Review. Chinese.
Cited by
-
Molecular Mechanisms Underlying Twin-to-Twin Transfusion Syndrome.Cells. 2022 Oct 17;11(20):3268. doi: 10.3390/cells11203268. Cells. 2022. PMID: 36291133 Free PMC article. Review.
-
Placental SARS-CoV-2 distribution correlates with level of tissue oxygenation in COVID-19-associated necrotizing histiocytic intervillositis/perivillous fibrin deposition.Placenta. 2022 Jan;117:187-193. doi: 10.1016/j.placenta.2021.12.002. Epub 2021 Dec 2. Placenta. 2022. PMID: 34929459 Free PMC article.
-
Autophagy Process in Trophoblast Cells Invasion and Differentiation: Similitude and Differences With Cancer Cells.Front Oncol. 2021 Apr 15;11:637594. doi: 10.3389/fonc.2021.637594. eCollection 2021. Front Oncol. 2021. PMID: 33937039 Free PMC article. Review.
-
Increased placental expression of angiotensin-converting enzyme 2, the receptor of SARS-CoV-2, associated with hypoxia in twin anemia-polycythemia sequence (TAPS).Placenta. 2021 Feb;105:7-13. doi: 10.1016/j.placenta.2021.01.008. Epub 2021 Jan 15. Placenta. 2021. PMID: 33497931 Free PMC article.
-
Middle Cerebral Artery Doppler Velocimetry for the Diagnosis of Twin Anemia Polycythemia Sequence: A Systematic Review.J Clin Med. 2020 Jun 4;9(6):1735. doi: 10.3390/jcm9061735. J Clin Med. 2020. PMID: 32512796 Free PMC article.
References
MeSH terms
Grants and funding
LinkOut - more resources
Full Text Sources
Medical
Miscellaneous
