Randomized Controlled Trial
. 2020 May;87(5):700-709.
doi: 10.1002/ana.25702. Epub 2020 Feb 27.

Sleep Deprivation Affects Tau Phosphorylation in Human Cerebrospinal Fluid

Affiliations
Randomized Controlled Trial

Sleep Deprivation Affects Tau Phosphorylation in Human Cerebrospinal Fluid

Nicolas R Barthélemy et al. Ann Neurol. 2020 May.

Abstract

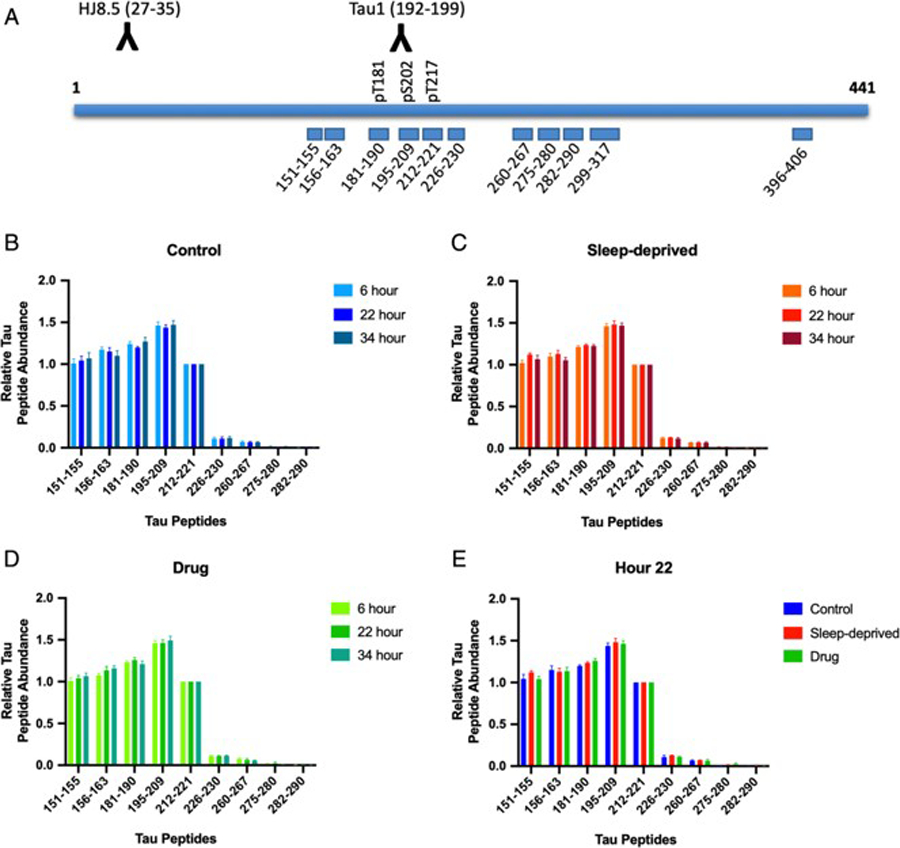
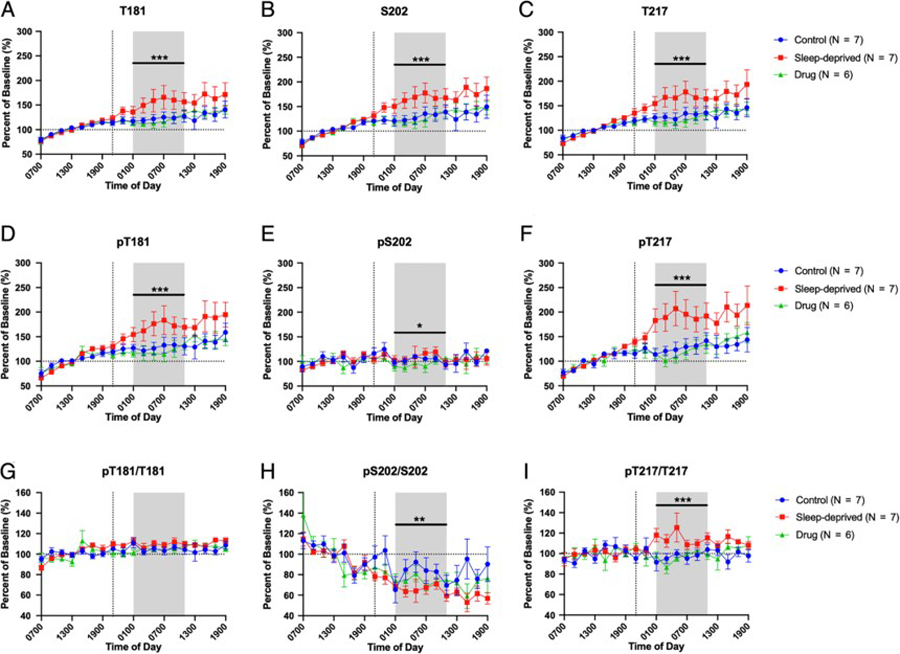
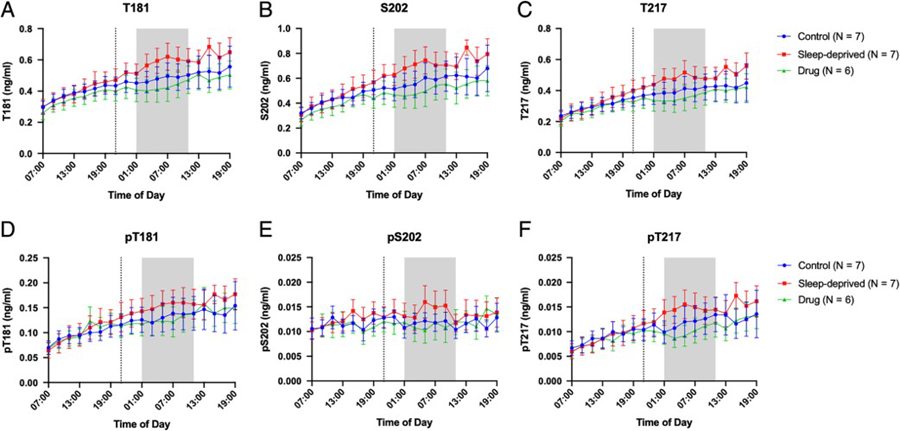
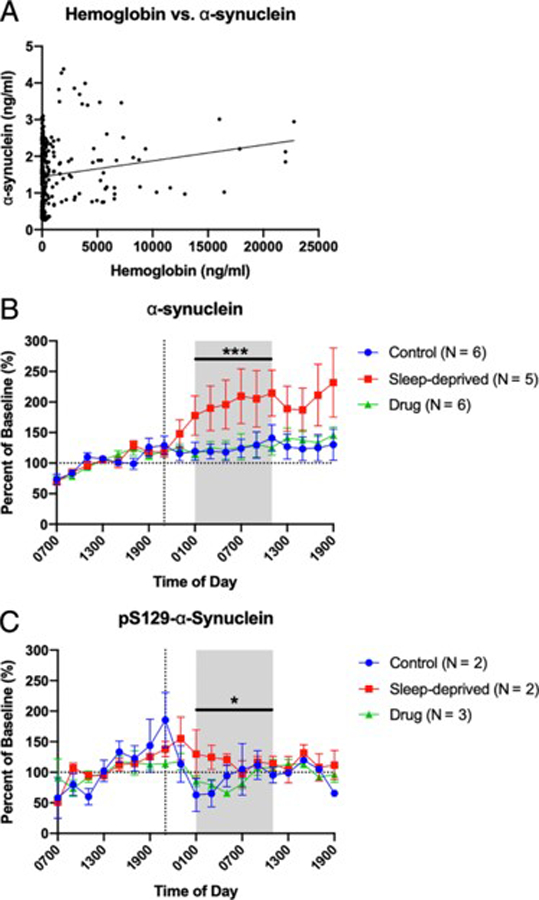
Tau hyperphosphorylation is an early step in tau-mediated neurodegeneration and is associated with intracellular aggregation of tau as neurofibrillary tangles, neuronal and synaptic loss, and eventual cognitive dysfunction in Alzheimer disease. Sleep loss increases the cerebrospinal fluid concentration of amyloid-β and tau. Using mass spectrometry, we measured tau and phosphorylated tau concentrations in serial samples of cerebrospinal fluid collected from participants who were sleep-deprived, treated with sodium oxybate, or allowed to sleep normally. We found that sleep loss affected phosphorylated tau differently depending on the modified site. These findings suggest a mechanism for sleep loss to increase risk of Alzheimer disease. ANN NEUROL 2020;87:700-709.


Conflict of interest statement

Potential Conflicts of Interest:

Washington University, with N.R.B. and R.J.B. as coinventors, has submitted the U.S. nonprovisional patent application “Cerebrospinal fluid (CSF) Tau Rate of Phosphorylation Measurement to Define Stages of Alzheimer’s Disease and Monitor Brain Kinases/Phosphatases Activity.”

Figures

Figure 1:
Figure 1:
Cerebrospinal fluid (CSF) tau isoforms are consistently truncated regardless of time of day or intervention. (A) Tau peptides monitored by the mass spectrometry (MS) tau assay are shown. CSF tau isoforms are immunoprecipitated using the combination of HJ8.5 and Tau1 antibodies. Absolute amounts of tau peptides obtained after trypsin digestion are measured by comparison with a labeled internal standard. Phosphorylated peptides at T181, S202 and T217 levels are measured and compared to corresponding unmodified peptides. (B-E) Tau peptides 151–290 (x-axis) were measured at three time points: 1) hour 6 during the baseline period; 2) hour 22 during the intervention; 3) hour 34 during the post-intervention period. Peptides levels were normalized to the level of 212–221 peptide (y-axis) and the truncation profiles were not significantly different for participants in the control group (B), the sleep-deprived group (C), and the drug group (D) (all p>0.05). During the intervention period at hour 22 (E), the truncation profiles were also not significantly different between groups (p>0.05). Levels of tau peptides after residue 221 markedly decrease and peptides monitored after residue 290 are not detected.
Figure 2:
Figure 2:
Overnight cerebrospinal fluid (CSF) tau and phosphorylated tau (p-tau). Eight subjects participated in the study. Four participants repeated the study in the control, sleep-deprived, and drug intervention groups; four participants repeated the study in 2 groups. In all graphs, concentrations and ratios were normalized to the baseline 07:00 to 19:00. The overnight period during the intervention night was defined as hours 18 to 28 (01:00–11:00) to account for transit time of CSF from the brain to lumbar catheter (shaded area). (A-C) Sleep deprivation increased overnight non-phosphorylated T181, S202, and T217 by 30–50% over the baseline compared to participants in the control and drug groups; however, the control and drug groups were not significantly different. (D-F) Phosphorylated T181 (pT181) and phosphorylated T217 (pT217) were increased during sleep deprivation. pT217 increased 60–80% in the sleep-deprived group compared to the control and drug groups while pT181 showed a similar increase as the unphosphorylated tau forms. Phosphorylated S202 (pS202) was decreased during drug treatment only but did not change with sleep deprivation compared to control. (G-I) Ratio of p-tau/tau for each truncated form. pT181/T181 showed no significant difference between groups during the overnight period. pS202/S202 was decreased in the sleep deprived group compared to control but was not significantly different from the drug group. pT217/T217 was increased in the sleep-deprived group compared to both the control and drug groups. Blue: control; Red: sleep-deprived; Green: drug. Error bars indicate standard error. The vertical dashed line is the intervention start time. The horizontal dashed line is at 100% of baseline. *p<0.05; **p<0.001; ***p<0.0001.
Figure 3:
Figure 3:
Tau and P-tau concentrations over 36-hours for the control, sleep-deprived, and drug groups. Average T181 (A), S202 (B), T217 (C), pT181 (D), pS202 (E), and pT217 (F) concentrations in ng/ml are shown over 36-hours between 07:00–19:00 and are not normalized to baseline. The overnight period during the intervention night was defined as hours 18 to 28 (01:00–11:00) to account for transit time of CSF from the brain to lumbar catheter (shaded area). Blue: control; Red: sleep-deprived; Green: drug. Error bars indicate standard error. The vertical dashed line is the intervention start time.
Figure 4:
Figure 4:
Within-subject changes in CSF concentration of T181 and pT181 (ng/ml) in the control (A, D), sleep-deprived (B, E), and drug (C, F) groups. Participants are shown individually. The overnight period during the intervention night was defined as hours 18 to 28 (01:00–11:00) to account for transit time of CSF from the brain to lumbar catheter (shaded area). The vertical dashed line is the intervention start time.
Figure 5:
Figure 5:
Within-subject changes in CSF concentration of S202 and pS202 (ng/ml) in the control (A, D), sleep-deprived (B, E), and drug (C, F) groups. Participants are shown individually. The overnight period during the intervention night was defined as hours 18 to 28 (01:00–11:00) to account for transit time of CSF from the brain to lumbar catheter (shaded area). The vertical dashed line is the intervention start time.
Figure 6:
Figure 6:
Within-subject changes in CSF concentration of T217 and pT217 (ng/ml) in the control (A, D), sleep-deprived (B, E), and drug (C, F) groups. Participants are shown individually. The overnight period during the intervention night was defined as hours 18 to 28 (01:00–11:00) to account for transit time of CSF from the brain to lumbar catheter (shaded area). The vertical dashed line is the intervention start time.
Figure 7:
Figure 7:
Overnight cerebrospinal fluid (CSF) α-synuclein and pS129-α-synuclein. Seven participants who completed control (N=6), sleep-deprived (N=5), and drug (N=6) groups underwent measurement of hemoglobin, α-synuclein, and pS129-α-synuclein. Concentrations of α-synuclein and pS129-α-synuclein were normalized to the baseline 07:00 to 19:00. The overnight period during the intervention night was defined as hours 18 to 28 (01:00–11:00) to account for transit time of CSF from the brain to lumbar catheter (shaded area). (A) α-synuclein concentration does not increase with increased hemoglobin concentration. For each time point, the graph shows the concentration of α-synuclein (ng/ml) to hemoglobin (ng/ml). The best fit line for all time points is shown. (B) Sleep deprivation increased overnight α-synuclein by ~80% over baseline compared to participants in the control and drug groups; however the control and drug groups were not significantly different. (C) pS129-α-synuclein was not increased in the sleep-deprived group compared to controls, although the sleep-deprived groups was significantly increased compared to the drug group by ~30%. pS129-α-synuclein was below the limit of detection in four participants regardless of group. Blue: control; Red: sleep-deprived; Green: drug. Error bars indicate standard error. The vertical dashed line is the intervention start time. The horizontal dashed line is at 100% of baseline. *p<0.05; ***p<0.0001

References

    1. Morris JC, Price JL. Pathologic correlates of nondemented aging, mild cognitive impairment, and early-stage Alzheimer’s disease. J Molec Neurosci 2001; 17 (2): 101–18. - PubMed
    1. Spillantini MG, Goedert M. Tau pathology and neurodegeneration. Lancet Neurol 2013; 12 (6): 609–22. - PubMed
    1. Ju Y-E, Lucey BP, Holtzman DM. Sleep and Alzheimer disease pathology-a bidirectional relationship. Nat Rev Neurol 2014; 10 (2): 115–9. - PMC - PubMed
    1. Cirrito JR, Yamada KA, Finn MB, Sloviter RS, Bales KR, May PC, Schoepp DD, Paul SM, Mennerick S, Holtzman DM. Synaptic activity regulates interstitial fluid amyloid-β levels in vivo. Neuron 2005; 48: 913–22. - PubMed
    1. Lucey BP, Hicks TJ, McLeland JS, Toedebusch CD, Boyd J, Elbert DL, Patterson BW, Baty J, Morris JC, Ovod V, Mawuenyega KG, Bateman RJ. Effect of sleep on overnight CSF amyloid-β kinetics. Ann Neurol 2018; 83 (1): 197–204. - PMC - PubMed

Publication types