

doi: 10.1016/j.jcmgh.2020.02.001.
Epub 2020 Feb 10.
African Ancestry Proportion Influences Ileal Gene Expression in Inflammatory Bowel Disease
Affiliations
- PMID: 32058087
- PMCID: PMC7296223
- DOI: 10.1016/j.jcmgh.2020.02.001
Item in Clipboard
African Ancestry Proportion Influences Ileal Gene Expression in Inflammatory Bowel Disease
Cell Mol Gastroenterol Hepatol.
2020.
No abstract available
Figures
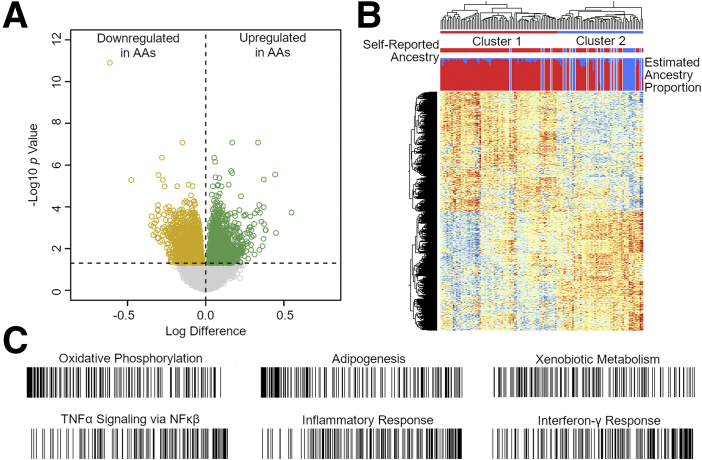
Differential gene expression by ancestry. (A) Volcano plot depicting log difference (x-axis) and –log10 P value (y-axis) for 14,392 genes between African (n = 104) and European (n = 25) ancestry patients. (B) Hierarchical clustering of 2705 genes differentially expressed at FDR <0.05 from A. Top bar: Individuals grouped into cluster 1 (red; n = 70 AA, 4 European) and cluster 2 (blue; n = 34 AA, 21 European). Middle bar: Self-reported AA (red) or European (blue) ancestry. Bottom bar: Estimated proportion of African (red) and European (blue) ancestry from supervised ADMIXTURE analysis. (C) Gene set enrichment analysis ranking plots. Each line represents a gene, whereas position from left to right represents ranking calculated by multiplying sign of fold change by inverse of FDR value. Top row shows bias toward downregulated genes in AA; bottom row shows bias toward upregulated genes. NF-kB, nuclear factor-kappa B; TNF, tumor necrosis factor.
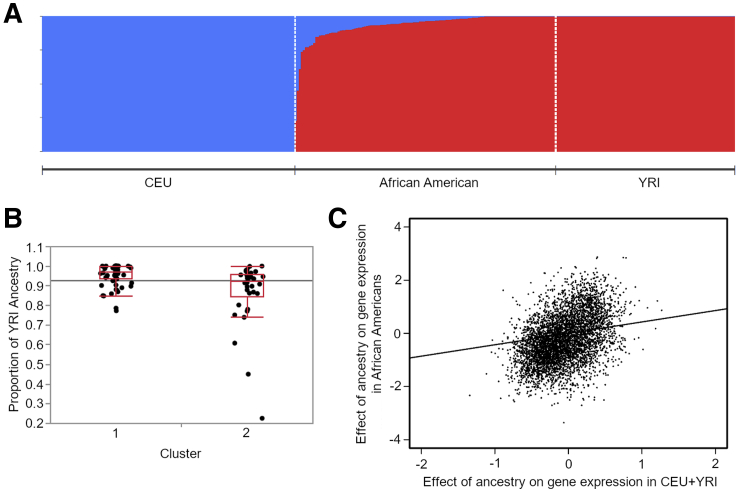
Influence of ancestry proportions on gene expression. (A) Proportions of ancestry assigned to AA. CEU population consists of 1000 Genomes Utah Northern and Western European ancestry individuals (n = 85) and European ancestry individuals from this study; YRI population consists of 1000 Genomes Yoruban individuals (n = 88). (B) Representative boxplot for analysis of variance between self-identified AA in cluster 1 (n = 70) and cluster 2 (n = 34) from Figure 1B. The y-axis represents proportion of YRI ancestry (P = 6×10⁻⁵). Horizontal line is grand mean. (C) Plot of regressed estimates of the effect of ancestry proportion on gene expression for the top 5000 most highly expressed genes, calculated in CEU versus YRI (x-axis) and within AA (y-axis). The slope of the correlation line is c = 0.43.
References
-
- Nguyen G.C. J Crohns Colitis. 2014;8:288–295. - PubMed
Publication types
MeSH terms
Grants and funding
LinkOut - more resources
Full Text Sources
Medical
Molecular Biology Databases
