. 2020 Mar;48(3):276-288.
doi: 10.1097/CCM.0000000000004224.

Sepsis Among Medicare Beneficiaries: 1. The Burdens of Sepsis, 2012-2018

Affiliations

Sepsis Among Medicare Beneficiaries: 1. The Burdens of Sepsis, 2012-2018

Timothy G Buchman et al. Crit Care Med. 2020 Mar.

Abstract

Objectives: To provide contemporary estimates of the burdens (costs and mortality) associated with acute inpatient Medicare beneficiary admissions for sepsis.

Design: Analysis of paid Medicare claims via the Centers for Medicare & Medicaid Services DataLink Project.

Setting: All U.S. acute care hospitals, excluding federally operated hospitals (Veterans Administration and Defense Health Agency).

Patients: All Medicare beneficiaries, 2012-2018, with an inpatient admission including one or more explicit sepsis codes.

Interventions: None.

Measurements and main results: Total inpatient hospital and skilled nursing facility admission counts, costs, and mortality over time. From calendar year (CY)2012-CY2018, the total number of Medicare Part A/B (fee-for-service) beneficiaries with an inpatient hospital admission associated with an explicit sepsis code rose from 811,644 to 1,136,889. The total cost of inpatient hospital admission including an explicit sepsis code for those beneficiaries in those calendar years rose from $17,792,657,303 to $22,439,794,212. The total cost of skilled nursing facility care in the 90 days subsequent to an inpatient hospital discharge that included an explicit sepsis code for Medicare Part A/B rose from $3,931,616,160 to $5,623,862,486 over that same interval. Precise costs are not available for Medicare Part C (Medicare Advantage) patients. Using available federal data sources, we estimated the aggregate cost of inpatient admissions and skilled nursing facility admissions for Medicare Advantage patients to have risen from $6.0 to $13.4 billion over the CY2012-CY2018 interval. Combining data for fee-for-service beneficiaries and estimates for Medicare Advantage beneficiaries, we estimate the total inpatient admission sepsis cost and any subsequent skilled nursing facility admission for all (fee-for-service and Medicare Advantage) Medicare patients to have risen from $27.7 to $41.5 billion. Contemporary 6-month mortality rates for Medicare fee-for-service beneficiaries with a sepsis inpatient admission remain high: for septic shock, approximately 60%; for severe sepsis, approximately 36%; for sepsis attributed to a specific organism, approximately 31%; and for unspecified sepsis, approximately 27%.

Conclusion: Sepsis remains common, costly to treat, and presages significant mortality for Medicare beneficiaries.


Figures
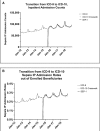
Figure 1.
Figure 1.
Analysis of the transition between editions of the coding system (n = 6,731,828 inpatient [IP] admissions to acute care hospitals of Medicare Part A/B beneficiaries). A, Transition from International Classification of Diseases, 9th Edition (ICD-9) to International Classification of Diseases, 10th Edition (ICD-10), IP admission counts. Counts of Medicare fee-for-service–only IP admissions with a sepsis code, by month. B, Transition from ICD-9 to ICD-10 sepsis IP admission rates out of enrolled beneficiaries. Sepsis IP admission rates as a fraction of enrolled beneficiaries, by month. Dashed line, ICD-9; dotted line, ICD-10 crosswalk; solid line, ICD-10 Centers for Medicare & Medicaid Services core measure (SEP-1) metric denominator code set. Note that the SEP-1 metric denominator is a superset of the ICD-10 crosswalk from ICD-9 (the filled squares are slightly higher valued than the open squares).
Figure 2.
Figure 2.
Analysis of sepsis admissions stratified by severity by counts, rates, and proportions (n = 6,731,828 inpatient [IP] admissions to acute care hospitals of Medicare Part A/B beneficiaries). A, IP sepsis admissions, by severity. Sepsis by IP hospital admission counts. Filled circles: septic shock; filled squares: severe sepsis; open circles, nonsevere sepsis (organism unspecified); open triangles, nonsevere sepsis (organism-specified). B, Sepsis admission rates versus all IP admissions, by severity. Percentage of IP admissions featuring a sepsis code (rate). Even for severe sepsis and septic shock, both the count and the rate of sepsis admissions are rising. The impact of seasonal infections on sepsis rates during the winter months is apparent. Note to reviewers, “count” plots have abnormal right “tails” because claims through December 2018 are not yet complete. These tails will disappear when the data and plots are updated in January 2020 prior to publication. C, Fractional severity tiers, by month. Despite the increase in counts and in the fraction of total admissions requiring a sepsis code, the fraction of admissions coded as septic shock and as severe sepsis has remained stable. The fraction of less severe sepsis has also remained stable; however, the identification of specific organisms has declined among the less severe sepsis IP admissions.
Figure 3.
Figure 3.
Medicare fee-for-service mortality stratified by sepsis severity within 1 wk (A), 6 mo (B), 1 yr (C), and 3 yr (D) of hospital discharge. Even the least severe sepsis admissions serve to mark substantial risk of late mortality. Filled circles, septic shock; filled squares, severe sepsis; open circles, nonsevere sepsis (organism unspecified); open triangles, nonsevere sepsis (organism-specified).
Figure 4.
Figure 4.
Percentage of Medicare fee-for-service inpatient (IP) admissions associated with a sepsis code. Dual beneficiaries have a sepsis code assigned to an IP admission more than twice as frequently as non–dual beneficiaries. Furthermore, the likelihood of a sepsis code assignment is rising faster in the dual beneficiary population. Dual beneficiaries: open circles, International Classification of Diseases, 9th Edition (ICD-9); open squares, International Classification of Diseases, 10th Edition (ICD-10); filled squares, Centers for Medicare & Medicaid Services core measure (SEP-1). Non–dual beneficiaries: open triangles, ICD-9; open diamonds, ICD-10; filled diamonds, SEP-1.
Figure 5.
Figure 5.
Counts of Medicare fee-for-service sepsis present on admission (POA), not POA (NPOA), and unknown. During the 7-yr study period, the counts of sepsis POA have risen steadily, whereas the counts of sepsis NPOA (i.e., acquired during the inpatient [IP] stay) have declined slightly. The fraction of admissions where the sepsis status at admission could not be determined was typically 0.2–0.3% of the total. POA: open circles, International Classification of Diseases, 9th Edition (ICD-9); open squares, International Classification of Diseases, 10th Edition (ICD-10); filled squares, SEP-1. NPOA: open triangles, ICD-9; open wedge, ICD-10; filled wedge, Centers for Medicare & Medicaid Services core measure (SEP-1). Unknown: circle-dot, ICD-9; open hexagon, ICD-10; filled hexagon, SEP-1.
Figure 6.
Figure 6.
Total monthly payments for all inpatient sepsis admission by severity, Medicare fee-for-service only (n = 6,998,888 inpatient admissions [acute care hospitals, psychiatric hospitals, rehabilitation hospitals, and long-term care hospitals]). Solid line, total payment; dashed line, septic shock; dash and single dot, sepsis with organism unspecified; dotted line, severe sepsis; dash and double dot, sepsis with organism specified.
Figure 7.
Figure 7.
Average payment for inpatient hospital admission by sepsis severity, Medicare fee-for-service only. Data are given in current dollars, not constant dollars. Solid line, overall average payment; dashed line, septic shock; dash and single dot, sepsis with organism unspecified; dotted line, severe sepsis; dash and double dot, sepsis with organism specified. There has been a reduction in payment across all sepsis severities and in the average payment. The payment for organism-specific treatment is now less than that caused by an unspecified organism.
Figure 8.
Figure 8.
Average payments for sepsis survivors, Medicare fee-for-service (FFS) only. Dashed line, average inpatient (IP) payment for beneficiaries who survive and will go on to a skilled nursing facility (SNF) stay; solid line, average IP payment for all beneficiaries who survive the IP admission; dotted line, average 90 d payment to SNF for beneficiaries who survive sepsis and require SNF care. Although average payments for IP care are declining, payments for SNF care are steady. As a consequence, the average payments for IP care and for subsequent SNF care appear to be converging.

Comment in

References

    1. Rhee C, Dantes R, Epstein L, et al. ; CDC Prevention Epicenter Program: Incidence and trends of sepsis in US hospitals using clinical vs claims data, 2009-2014. JAMA 2017; 318:1241–1249 - PMC - PubMed
    1. Rhee C, Wang R, Zhang Z, et al. ; CDC Prevention Epicenters Program: Epidemiology of hospital-onset versus community-onset sepsis in U.S. Hospitals and association with mortality: A retrospective analysis using electronic clinical data. Crit Care Med 2019; 47:1169–1176 - PMC - PubMed
    1. Tillmann B, Wunsch H. Epidemiology and outcomes. Crit Care Clin 2018; 34:15–27 - PubMed
    1. National Center for Emerging and Zoonotic Infectious Diseases (NCEZID), Centers for Disease Control and Prevention, Division of Healthcare Quality Promotion (DHQP) CDC Data and Reports, 2016. Cited August 23, 2016. Available at: https://www.cdc.gov/sepsis/datareports/index.htmlAccessed August 23, 2016.
    1. Torio CM, Moore BJ. National Inpatient Hospital Costs: The Most Expensive Conditions by Payer, 2013: Statistical Brief #204. Healthcare Cost and Utilization Project (HCUP) Statistical Briefs. 2006Rockville, MD, Agency for Healthcare Research and Quality. - PubMed

Publication types