. 2020 Mar;48(3):289-301.
doi: 10.1097/CCM.0000000000004226.

Sepsis Among Medicare Beneficiaries: 2. The Trajectories of Sepsis, 2012-2018

Affiliations

Sepsis Among Medicare Beneficiaries: 2. The Trajectories of Sepsis, 2012-2018

Timothy G Buchman et al. Crit Care Med. 2020 Mar.

Abstract

Objectives: To distinguish characteristics of Medicare beneficiaries who will have an acute inpatient admission for sepsis from those who have an inpatient admission without sepsis, and to describe their further trajectories during and subsequent to those inpatient admissions.

Design: Analysis of paid Medicare claims via the Centers for Medicare and Medicaid Services DataLink Project.

Setting: All U.S. acute care hospitals, excepting federal hospitals (Veterans Administration and Defense Health Agency).

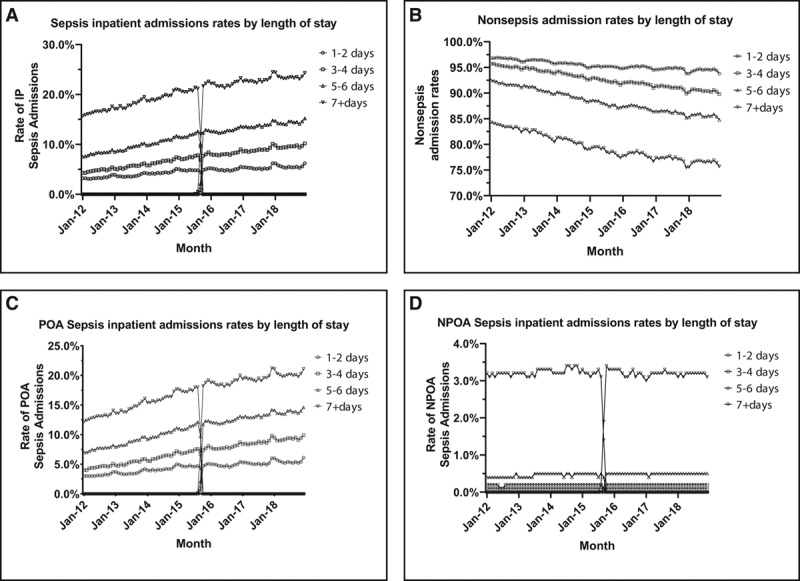
Patients: Medicare beneficiaries, 2012-2018, with an inpatient hospital admission including one or more explicit sepsis codes.

Interventions: None.

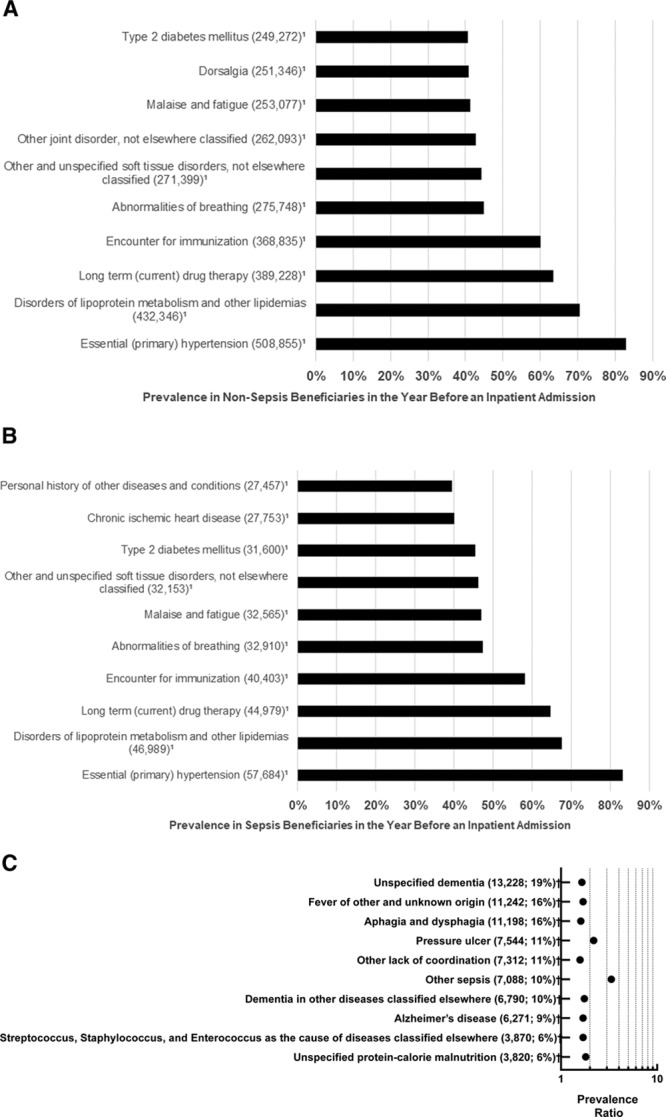
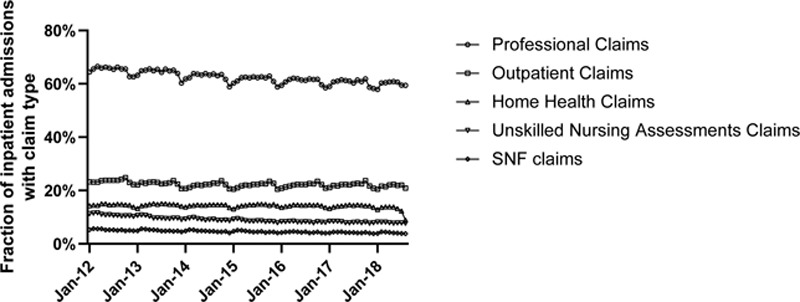
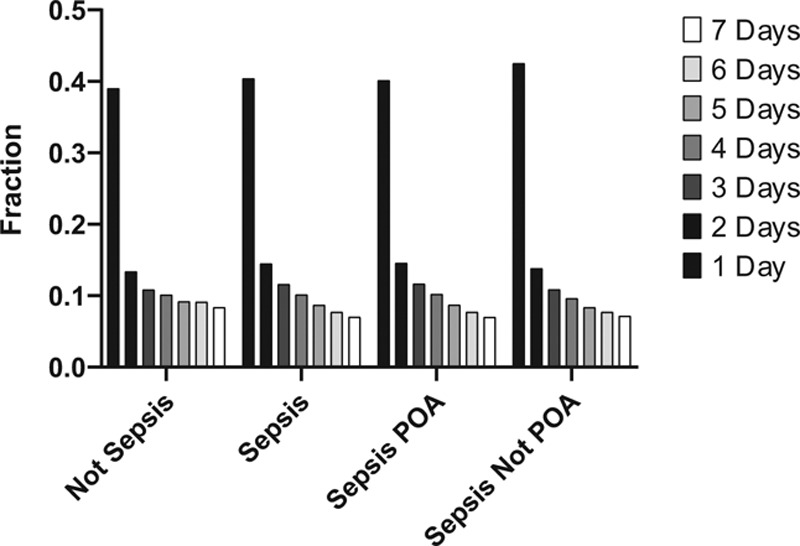
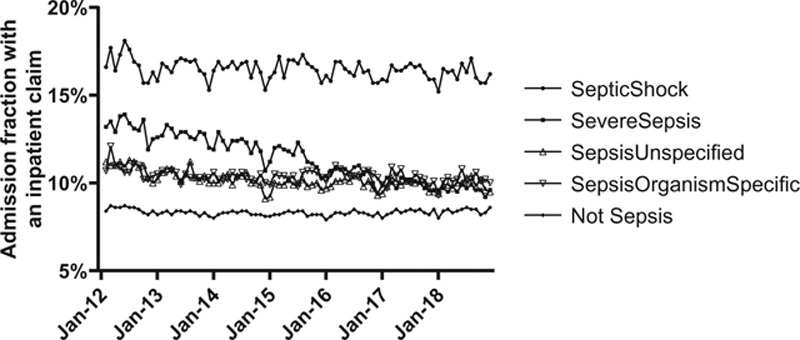
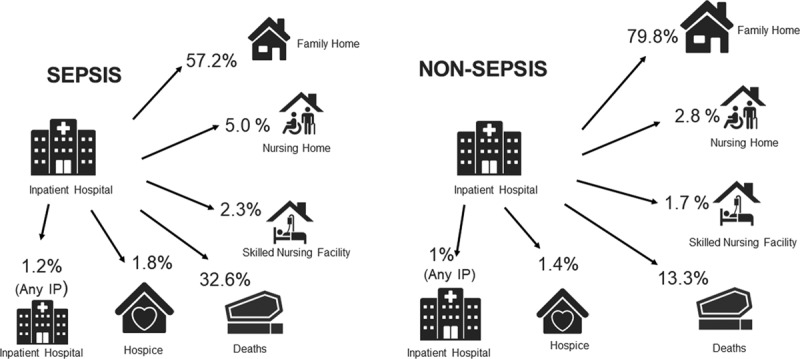
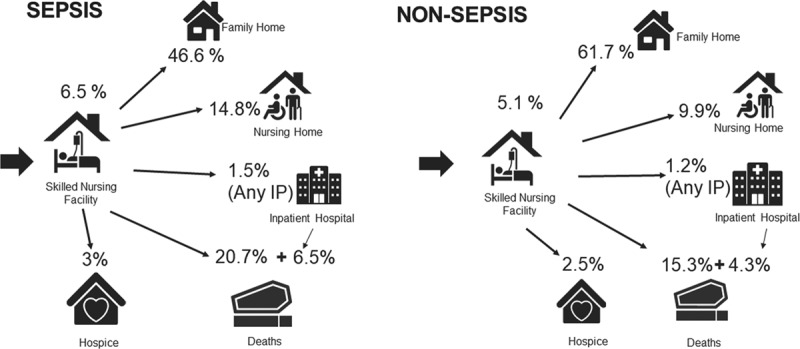
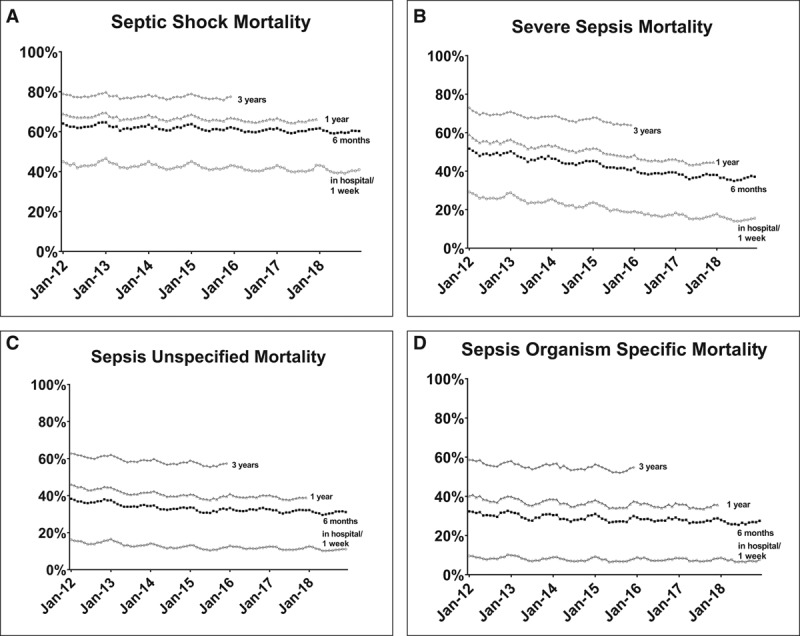
Measurements and main results: Prevalent diagnoses in the year prior to the inpatient admission; healthcare contacts in the week prior to the inpatient admission; discharges, transfers, readmissions, and deaths (trajectories) for 6 months following discharge from the inpatient admission. Beneficiaries with no sepsis inpatient hospital admission for a year prior to an index hospital admission for sepsis were nearly indistinguishable by accumulated diagnostic codes from beneficiaries who had an index hospital admission without sepsis. Although the timing of healthcare services in the week prior to inpatient hospital admission was similar among beneficiaries who would be admitted for sepsis versus those whose inpatient admission did not include a sepsis code, the setting differed: beneficiaries destined for a sepsis admission were more likely to have received skilled nursing or unskilled nursing (e.g., nursing aide for activities of daily living) care. In contrast, comparing beneficiaries who had been free of any inpatient admission for an entire year and then required an inpatient admission, acute inpatient stays that included a sepsis code led to more than three times as many deaths within 1 week of discharge, with more admissions to skilled nursing facilities and fewer discharges to home. Comparing all beneficiaries who were admitted to a skilled nursing facility after an inpatient hospital admission, those who had sepsis coded during the index admission were more likely to die in the skilled nursing facility; more likely to be readmitted to an acute inpatient hospital and subsequently die in that setting; or if they survive to discharge from the skilled nursing facility, they are more likely to go next to a custodial nursing home.

Conclusions: Although Medicare beneficiaries destined for an inpatient hospital admission with a sepsis code are nearly indistinguishable by other diagnostic codes from those whose admissions will not have a sepsis code, their healthcare trajectories following the admission are worse. This suggests that an inpatient stay that included a sepsis code not only identifies beneficiaries who were less resilient to infection but also signals increased risk for worsening health, for mortality, and for increased use of advanced healthcare services during and postdischarge along with an increased likelihood of an inpatient hospital readmission.


Figures

Figure 1.
Figure 1.
Prevalent and disproportionate diagnoses. A, Most prevalent diagnoses before a sepsis admission. Most prevalent International Classification of Diseases, 10th Edition (ICD-10) codes reported for the CY2016 prior to an acute inpatient admission in January 2017 that includes a sepsis code in January 2017. B, Most prevalent diagnoses before a nonsepsis admission. Most prevalent ICD-10 codes reported for the CY2016 prior to an acute inpatient admission in January 2017 that does not include a sepsis code in January 2017. C, Top prevalent diagnoses before a sepsis admission relative to a nonsepsis admission. The top disproportionally prevalent ICD-10 codes relative to an acute inpatient admission in January 2017 that did not include a sepsis code. Neither the sepsis nor the nonsepsis patients had any inpatient admission during the prior year. Note that the top disproportionally prevalent diagnoses (other sepsis and pressure ulcer) affected only 10–11% of the patients whose inpatient admission would have a sepsis code. The remaining disproportionally prevalent diagnoses had prevalence ratios less than 2.
Figure 2.
Figure 2.
Percentage of inpatient sepsis admissions who had a claim in the week prior to admission, by claim type. The seasonal dips in the outpatient professional evaluation and management codes appear to slightly precede the seasonal rise in admissions, mortality, and costs. SNF = skilled nursing facility.
Figure 3.
Figure 3.
Distribution of acute inpatient stays by the number of days between the most recent evaluation and management and the acute inpatient admission date. Data are summarized at the admission level (not the beneficiary level). The majority of the claims occur on the day prior to admission, suggesting that beneficiaries present themselves for care and are admitted to hospital soon thereafter. The pattern of claims is indistinguishable among patients with sepsis or not and irrespective of whether the sepsis was present on admission (POA) or not.
Figure 4.
Figure 4.
Percentage of inpatient sepsis admissions who had an inpatient claim in the week prior to admission, by sepsis severity. An inpatient claim may be made by an acute care hospital, a long-term acute care hospital, a rehabilitation hospital, or a psychiatric hospital.
Figure 5.
Figure 5.
Sepsis and nonsepsis inpatient (IP) admissions by length of stay. A, Sepsis admission rates out of all IP admissions. B, Present on admission (POA) sepsis admission rates out of all IP admissions. C, Not POA (NPOA) sepsis admission rates out of all IP admissions. D, Nonsepsis admission rates out of all IP admissions. For each length of stay band, total sepsis admission rates (A) and nonsepsis admission rates (D) total 100%; similarly POA and NPOA sum to the total admission rate.
Figure 6.
Figure 6.
Six-month trajectories of patients whose inpatient (IP) admission included a sepsis code or not. From the acute IP hospital, at 6 mo, patients could be back in an IP hospital (acute, rehabilitation, or psychiatric), at their family (personal) home, in custodial care, in a nursing home, in a skilled nursing facility, in hospice, or deceased. Percentages sum to 100%.
Figure 7.
Figure 7.
Six-month trajectories of patients whose inpatient (IP) admission included a sepsis code, or not, and who were initially sent to a skilled nursing facility (SNF). From the acute IP hospital and admission to a SNF, at 6 mo, patients could still be in a SNF, an IP hospital (acute, rehabilitation, or psychiatric), at their family (personal) home, in custodial care, in a nursing home, in hospice, or deceased. Percentages sum to 100%.
Figure 8.
Figure 8.
Mortality of sepsis stratified by severity and presented as monthly cohorts. Filled circles, 1-wk mortality; filled squares, 6-mo mortality; filled triangles (pointing up), 1-yr mortality; filled triangles (pointing down), 3-yr mortality. Each month represents a cohort of ≈70,000–100,000 Medicare Fee-For Service sepsis patients, of which approximately one-quarter of the total are septic shock admissions, one-fifth of the total are severe sepsis admissions, and the balance are less severe sepsis admissions. Among the four stratifications, no monthly cohort (i.e., no column representing 1 mo in any of the four graphs) contains fewer than 11,000 admissions. The mortality decline is greatest among those with severe sepsis, and the lives appear to be being saved during the hospitalization (the longer-term mortalities decline in parallel). One hypothesis is that early and aggressive case finding and treatment are preventing progression (i.e., to more severe organ dysfunction and shock).

Comment in

References

    1. Buchman TG, Simpson SQ, Sciarretta KL, et al. Sepsis Among Medicare Beneficiaries: 1. The Burdens of Sepsis, 2012–2018. Crit Care Med 2020; 48:276–288 - PMC - PubMed
    1. Liu VX, Escobar GJ, Chaudhary R, et al. Healthcare utilization and infection in the week prior to sepsis hospitalization. Crit Care Med 2018; 46:513–516 - PMC - PubMed
    1. Rothman M, Levy M, Dellinger RP, et al. Sepsis as 2 problems: Identifying sepsis at admission and predicting onset in the hospital using an electronic medical record-based acuity score. J Crit Care 2017; 38:237–244 - PubMed
    1. Leisman DE, Angel C, Schneider SM, et al. Sepsis presenting in hospitals versus emergency departments: Demographic, resuscitation, and outcome patterns in a multicenter retrospective cohort. J Hosp Med 2019; 14:340–348 - PMC - PubMed
    1. Maley JH, Mikkelsen ME. Short-term gains with long-term consequences: The evolving story of sepsis survivorship. Clin Chest Med 2016; 37:367–380 - PubMed

Publication types

MeSH terms