Residency Selection Preferences and Orthopaedic Career Perceptions: A Notable Mismatch
- PMID: 32058421
- PMCID: PMC7310506
- DOI: 10.1097/CORR.0000000000001161
Residency Selection Preferences and Orthopaedic Career Perceptions: A Notable Mismatch
Abstract
Background: Despite near-equal enrollment of males and females in medical schools, orthopaedic surgery continues to have one of the lowest percentage of female orthopaedic residents. This suggests there may be factors that specifically influence females to select other specialties. Some of these possible reasons have been explored in other studies; however, in this study, we sought to identify latent or unobserved variables that may be influencing this difference by conducting an explanatory factor analysis of male and female residency preferences.
Purposes/questions: In this study, by surveying a cohort of medical students at a single institution, we asked, is there a difference between males and females (1) in their perception of orthopaedic surgery and (2) in their preferences for residency and practice? We further asked, if there are differences, (3) is there a correlation between perception and preferences for residency and practice?
Methods: A 46-question survey was sent to all current medical students (n = 628) at a major urban university with near-equal enrollment of males (55%, 345 of 628) and females (45%, 283 of 628) from September 2017 to November 2017. The survey consisted of two main parts: (1) desired attributes of a residency program and (2) perceptions of orthopaedic residency and practice. The design of the survey instruments closely followed The Checklist for Reporting Results of Internet E-Surveys (CHERRIES) checklist and went through several variations and pilot studies before release. In all, 33% (205 of 628) total medical students responded to the email survey, 55% (112 of 205) were male and 45% (93 of 205) were female. The proportion of male and female respondents matched the gender distribution of the total population surveyed, which at the time of the survey was 55% male and 45% female.The data analysis was performed using a Mann-Whitney U test and an explanatory factor analysis. The explanatory factor analysis was used to identify the correlation between survey variables among male and female students. An alpha less than 0.05 was considered significant for the Mann-Whitney U test and a factor greater than 0.5 was considered significant for the factor analysis.
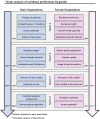
Results: Both male and female students ranked "work-life balance" and "variety in specialty" among the top three most important preferences. Females ranked "range of practice options," higher than males (72% females versus 60% males, r = 0.18; p = 0.009), and males ranked "previous exposure to the specialty" higher than females (65% females versus 71% males, r = 0.03; p = 0.70). Both male and female students had similar overall perceptions of orthopaedic surgery. Both males and females indicated that orthopedics is "male dominated," has "competitive entrance requirements," and requires "long residency work hours." They differed in their perception of "requires physical strength" (60% females versus 38% males, r = 0.28; p < 0.0005), and by how much orthopaedics is "male dominated" (95% females versus 77% males, r = 0.26; p < 0.0005). The factor analysis recognized that, although male and female students do have some similar residency preferences, the influence or weighing of those preferences is different for male and female students. In a manner similar to a personality assessment, the factor analysis produced four latent factors that can help explain variation seen in responses and helped identify influential factors that were not directly tested by the survey. The first such latent factor for females consisted of "work-life balance," "residency length," 'residency work hours," and "family-friendly specialty." Although the first latent factor for males consisted of "prestige," "income potential," "grade or step scores," and "competitiveness of residency program." The three subsequent latent factors also displayed variation in the make-up of the latent factors between males and female students.
Conclusions: This study of medical students at an urban medical school found that male and female students shared many preferences for residency specialties and held many of the same perceptions regarding orthopaedic surgery. The explanatory factor analysis indicated that male and female students weight preferences differently when selecting a specialty; this difference may account for the large differences in proportion between males and females in orthopaedic residency.
Clinical relevance: Attracting talented residents and attending physicians is important for the success of any medical department. Although orthopaedics attracts some of the most talented students, these students are predominantly male. By identifying the multifactorial areas that may be inadvertently discouraging females from applying, orthopaedic residency programs may be able to better address those issues and attract the best talent of both genders.
Conflict of interest statement
All ICMJE Conflict of Interest Forms for authors and
Each author certifies that neither he or she, nor any member of his or her immediate family, has funding or commercial associations (consultancies, stock ownership, equity interest, patent/licensing arrangements, etc.) that might pose a conflict of interest in connection with the submitted article.
Figures


Comment in
-
CORR Insights®: Residency Selection Preferences and Orthopaedic Career Perceptions: A Notable Mismatch.Clin Orthop Relat Res. 2020 Jul;478(7):1526-1528. doi: 10.1097/CORR.0000000000001221. Clin Orthop Relat Res. 2020. PMID: 32187096 Free PMC article. No abstract available.
References
-
- Accreditation Council for Graduate Medical Education. ACGME Data Resource Book Academic Year 2007-2008. Department of Applications and Data Analysis; 2008. Available at: https://www.acgme.org/About-Us/Publications-and-Resources/Graduate-Medic.... Accessed November 2, 2019.
-
- Accreditation Council for Graduate Medical Education. Data Resource Book Academic Year 2017-2018. Department of Applications and Data Analysis; 2018. Available at: https://www.acgme.org/About-Us/Publications-and-Resources/Graduate-Medic.... Accessed November 16, 2019.
-
- Accreditation Council for Graduate Medical Education. ACGME Data Resource Book Academic Year 2018-2019. Department of Applications and Data Analysis; 2019. Available at: https://www.acgme.org/About-Us/Publications-and-Resources/Graduate-Medic.... Accessed November 16, 2019.
-
- Allen E, Seaman C. Statistics Roundtable: Likert Scales and Data Analyses. Available at: http://asq.org/quality-progress/2007/07/statistics/likert-scales-and-dat.... Accessed November 17, 2019.
-
- Association of American Medical Colleges. Table B-1: Total Enrollment by U.S. Medical School and Sex. Available at: https://www.aamc.org/data/facts/enrollmentgraduate/158808/total-enrollme.... Accessed January 1, 2019.
MeSH terms
LinkOut - more resources
Full Text Sources

