

Deep Proteomics Using Two Dimensional Data Independent Acquisition Mass Spectrometry
- PMID: 32058701
- PMCID: PMC7255061
- DOI: 10.1021/acs.analchem.9b04418
Deep Proteomics Using Two Dimensional Data Independent Acquisition Mass Spectrometry
Abstract
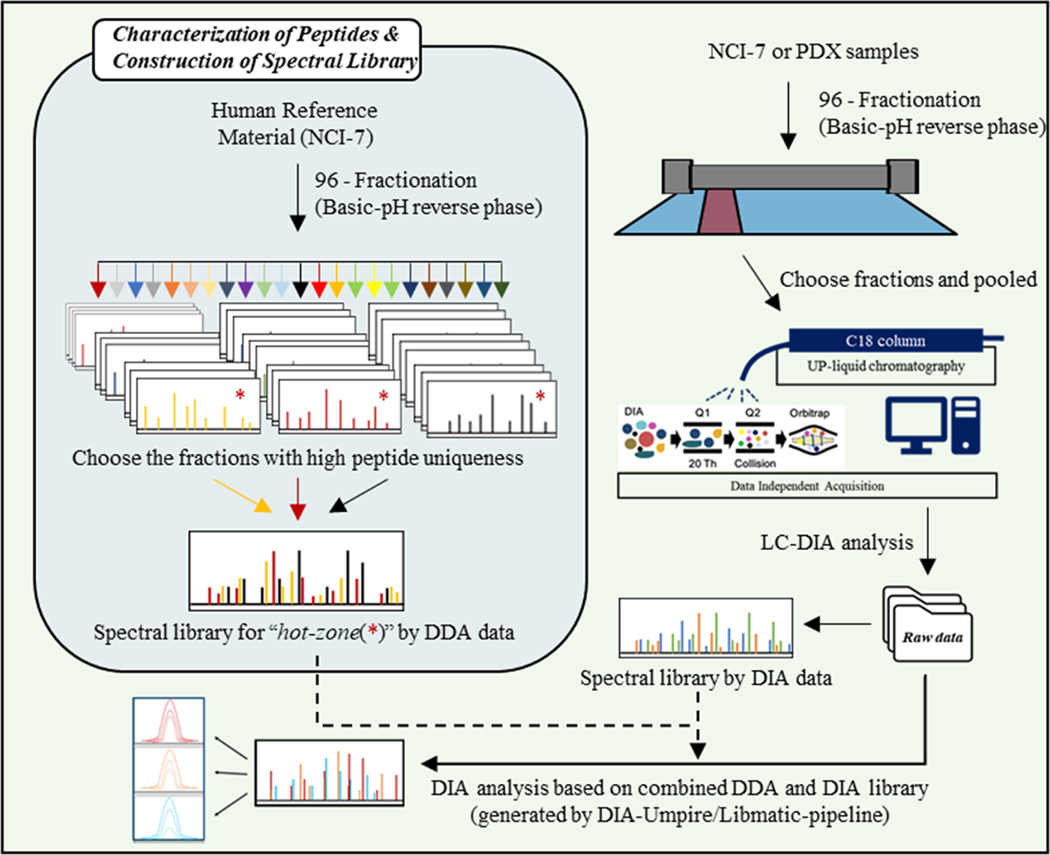
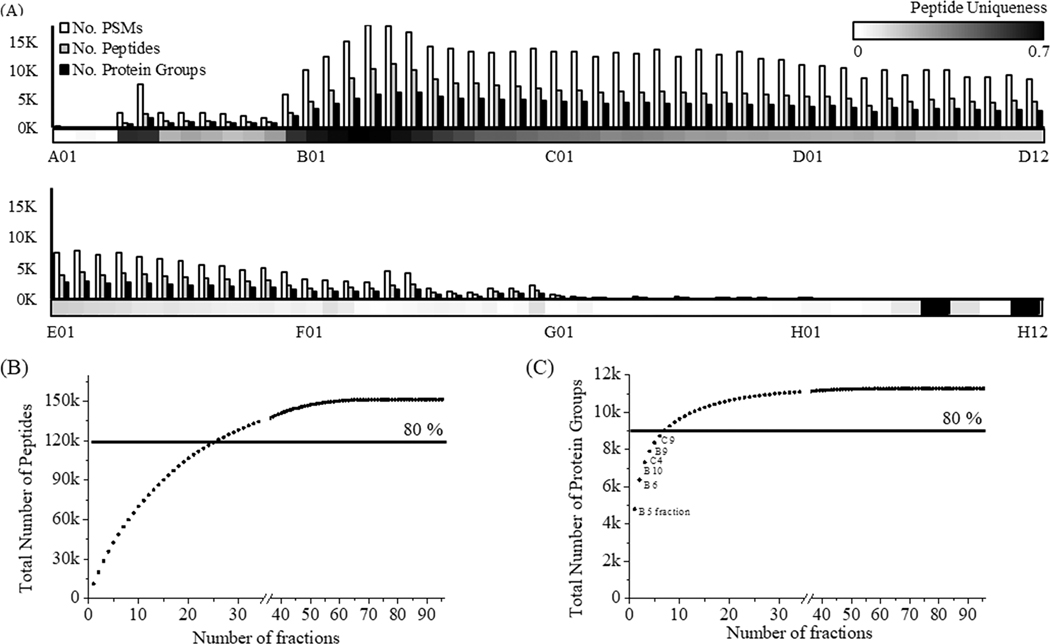
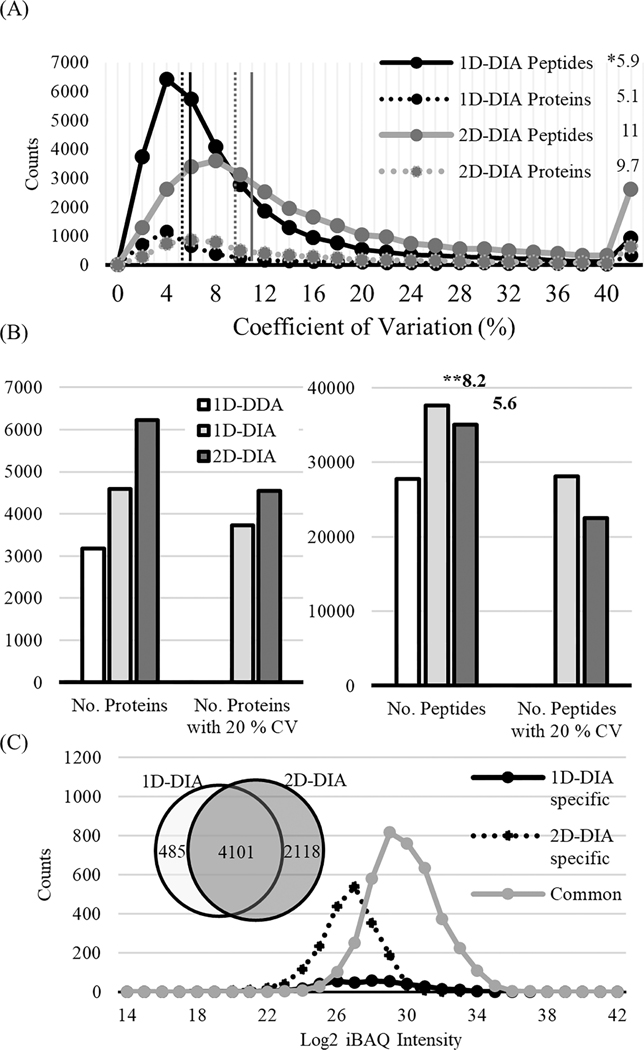
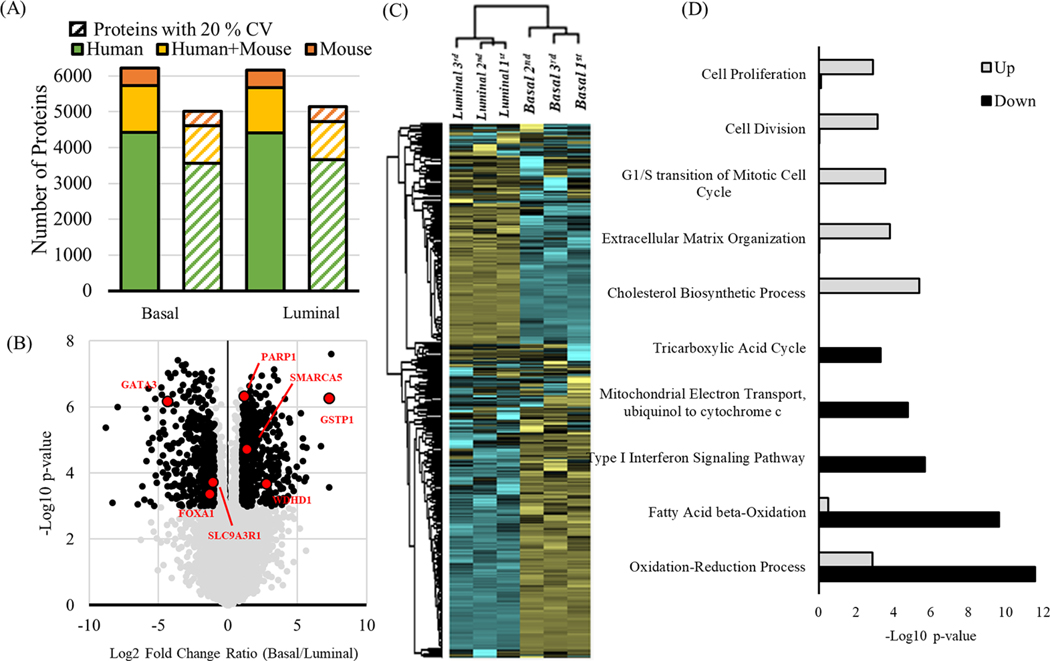
Methodologies that facilitate high-throughput proteomic analysis are a key step toward moving proteome investigations into clinical translation. Data independent acquisition (DIA) has potential as a high-throughput analytical method due to the reduced time needed for sample analysis, as well as its highly quantitative accuracy. However, a limiting feature of DIA methods is the sensitivity of detection of low abundant proteins and depth of coverage, which other mass spectrometry approaches address by two-dimensional fractionation (2D) to reduce sample complexity during data acquisition. In this study, we developed a 2D-DIA method intended for rapid- and deeper-proteome analysis compared to conventional 1D-DIA analysis. First, we characterized 96 individual fractions obtained from the protein standard, NCI-7, using a data-dependent approach (DDA), identifying a total of 151,366 unique peptides from 11,273 protein groups. We observed that the majority of the proteins can be identified from just a few selected fractions. By performing an optimization analysis, we identified six fractions with high peptide number and uniqueness that can account for 80% of the proteins identified in the entire experiment. These selected fractions were combined into a single sample which was then subjected to DIA (referred to as 2D-DIA) quantitative analysis. Furthermore, improved DIA quantification was achieved using a hybrid spectral library, obtained by combining peptides identified from DDA data with peptides identified directly from the DIA runs with the help of DIA-Umpire. The optimized 2D-DIA method allowed for improved identification and quantification of low abundant proteins compared to conventional unfractionated DIA analysis (1D-DIA). We then applied the 2D-DIA method to profile the proteomes of two breast cancer patient-derived xenograft (PDX) models, quantifying 6,217 and 6,167 unique proteins in basal- and luminal- tumors, respectively. Overall, this study demonstrates the potential of high-throughput quantitative proteomics using a novel 2D-DIA method.
Figures
References
-
- Huang Z; Ma L; Huang C; Li Q; Nice EC Proteomics 2017, 17 (6), 1600240. - PubMed
-
- Kelstrup CD; Bekker-Jensen DB; Arrey TN; Hogrebe A; Harder A; Olsen JV J. Proteome Res. 2018, 17 (1), 727–738. - PubMed
-
- Kim MS; Pinto SM; Getnet D; Nirujogi RS; Manda SS; Chaerkady R; Madugundu AK; Kelkar DS; Isserlin R; Jain S; Thomas JK; Muthusamy B; Leal-Rojas P; Kumar P; Sahasrabuddhe NA; Balakrishnan L; Advani J; George B; Renuse S; Selvan LD; Patil AH; Nanjappa V; Radhakrishnan A; Prasad S; Subbannayya T; Raju R; Kumar M; Sreenivasamurthy SK; Marimuthu A; Sathe GJ; Chavan S; Datta KK; Subbannayya Y; Sahu A; Yelamanchi SD; Jayaram S; Rajagopalan P; Sharma J; Murthy KR; Syed N; Goel R; Khan AA; Ahmad S; Dey G; Mudgal K; Chatterjee A; Huang TC; Zhong J; Wu X; Shaw PG; Freed D; Zahari MS; Mukherjee KK; Shankar S; Mahadevan A; Lam H; Mitchell CJ; Shankar SK; Satishchandra P; Schroeder JT; Sirdeshmukh R; Maitra A; Leach SD; Drake CG; Halushka MK; Prasad TS; Hruban RH; Kerr CL; Bader GD; Iacobuzio-Donahue CA; Gowda H; Pandey A Nature 2014, 509 (7502), 575–81. - PMC - PubMed
Publication types
MeSH terms
Substances
Grants and funding
LinkOut - more resources
Full Text Sources
