. 2020 Feb 14;16(2):e1008641.
doi: 10.1371/journal.pgen.1008641. eCollection 2020 Feb.

Integrative comparison of the genomic and transcriptomic landscape between prostate cancer patients of predominantly African or European genetic ancestry

Affiliations

Integrative comparison of the genomic and transcriptomic landscape between prostate cancer patients of predominantly African or European genetic ancestry

Jiao Yuan et al. PLoS Genet. .

Abstract

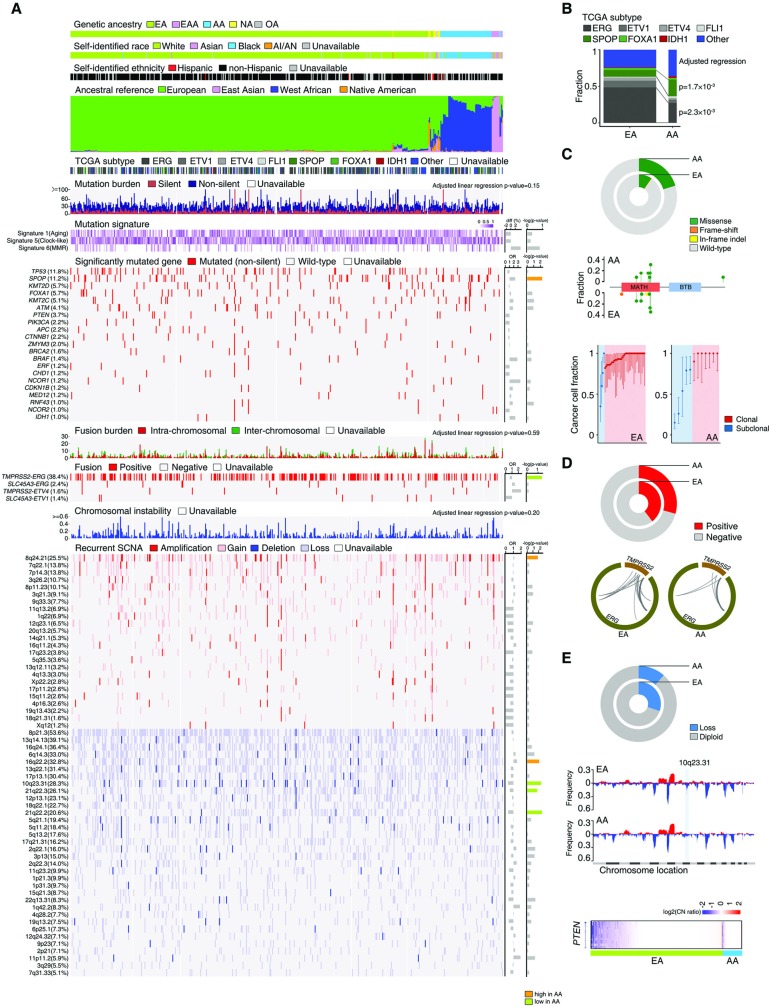
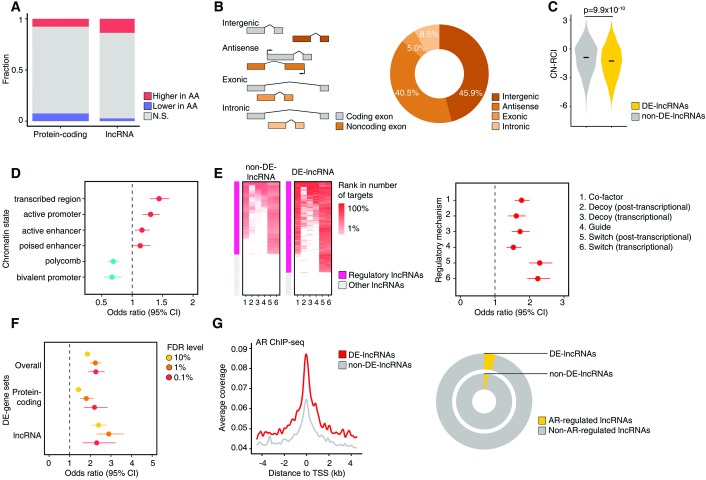
Men of predominantly African Ancestry (AA) have higher prostate cancer (CaP) incidence and worse survival than men of predominantly European Ancestry (EA). While socioeconomic factors drive this disparity, genomic factors may also contribute to differences in the incidence and mortality rates. To compare the prevalence of prostate tumor genomic alterations and transcriptomic profiles by patient genetic ancestry, we evaluated genomic profiles from The Cancer Genome Atlas (TCGA) CaP cohort (n = 498). Patient global and local genetic ancestry were estimated by computational algorithms using genotyping data; 414 (83.1%) were EA, 61 (12.2%) were AA, 11 (2.2%) were East Asian Ancestry (EAA), 10 (2.0%) were Native American (NA), and 2 (0.4%) were other ancestry. Genetic ancestry was highly concordant with self-identified race/ethnicity. Subsequent analyses were limited to 61 AA and 414 EA cases. Significant differences were observed by ancestry in the frequency of SPOP mutations (20.3% AA vs. 10.0% EA; p = 5.6×10-03), TMPRSS2-ERG fusions (29.3% AA vs. 39.6% EA; p = 4.4×10-02), and PTEN deletions/losses (11.5% AA vs. 30.2% EA; p = 3.5×10-03). Differentially expressed genes (DEGs) between AAs and EAs showed significant enrichment for prostate eQTL target genes (p = 8.09×10-48). Enrichment of highly expressed DEGs for immune-related pathways was observed in AAs, and for PTEN/PI3K signaling in EAs. Nearly one-third of DEGs (31.3%) were long non-coding RNAs (DE-lncRNAs). The proportion of DE-lncRNAs with higher expression in AAs greatly exceeded that with lower expression in AAs (p = 1.2×10-125). Both ChIP-seq and RNA-seq data suggested a stronger regulatory role for AR signaling pathways in DE-lncRNAs vs. non-DE-lncRNAs. CaP-related oncogenic lncRNAs, such as PVT1, PCAT1 and PCAT10/CTBP1-AS, were found to be more highly expressed in AAs. We report substantial heterogeneity in the prostate tumor genome and transcriptome between EA and AA. These differences may be biological contributors to racial disparities in CaP incidence and outcomes.


Conflict of interest statement

I have read the journal's policy and the authors of this manuscript have the following competing interests: Drs. Lin Zhang and Xiaowen Hu received research grant from Bristol-Myers Squibb/Celgene. The other authors declare no potential conflicts of interest.

Figures

Fig 1
Fig 1. Genetic ancestry and clinical characteristics of the TCGA CaP population.
(A) Three-dimensional visualization of genetic variation of EA (left) and AA (right) individuals from the TCGA CaP cohort and the reference populations from the HapMap and HGDP on the first three principle components calculated by EIGENSTRAT. Dot colors show concordance between inferred genetic ancestry and SIRE. (B) Genetic ancestry, SIRE, ancestral composition, and clinical characteristics of the patients in the TCGA CaP sample. Ancestral composition is inferred by STRUCTURE and each color represents an ancestral reference group. Individuals are ordered by hierarchical clustering using Ward's methods on distance matrix calculated as cosine dissimilarity of genetic composition. (C) Pie charts showing agreement between inferred genetic ancestry by EIGENSTRAT and SIRE. Pie chart size is proportional to the number of individuals. (D) Distributions of age at diagnosis among men with AA and EA ancestry. (E) Distribution of Gleason score among men with AA and EA ancestry.
Fig 2
Fig 2. Comparison of genomic alterations by genetic ancestry.
(A) Overview of genomic alterations by genetic ancestry in the TCGA CaP cohort. The upper panels show patient genetic ancestry estimated by EIGENSTRAT, SIRE, and ancestral composition estimated by STRUCTURE. Middle panels show participant tumor molecular subtype, mutation burden, presence of mutation signatures 1, 5, and 6, and a heatmap of the mutation frequency at 21 specific genes with ≥1% mutation frequency in the sample. Lower panels show total fusion burden, a heatmap of the frequency of four gene fusions with ≥1% frequency in the sample, total chromosomal instability, and a heatmap of the frequency of 58 recurrent focal somatic copy number alterations (red: amplification/gain; blue: deletion/loss) in the sample. Odds ratios (OR) and differences (diff) compare genomic alteration frequency among men with AA ancestry relative to men with EA ancestry.–log(p-values) are color-coded as significantly more frequent in AA men (orange), significantly less frequent in AA men (green), or no significant difference between AA and EA men (gray). (B) Distributions of seven TCGA CaP molecular subtypes among men with AA and EA ancestry. Men with AA were more likely to have SPOP subtype tumors and less likely to have ERG subtype tumors. (C) Frequency (upper), location (middle), and clonality (lower) of SPOP mutations among men with AA and EA ancestry. SPOP mutations more frequently occurred in men with AA ancestry (upper). Mutations were preferentially located in the MATH domain for men with AA and EA ancestry. Mutations are color-coded by type: missense (green), frame-shift (red), in-frame insertion/deletion (yellow). Men with AA ancestry had a greater frequency of subclonal SPOP mutations than men with EA ancestry (lower). Red represents clonal mutations and blue represents subclonal mutations. (D) Frequency of the TMPRSS2-ERG fusion (upper) and distribution of gene breakpoint sites (lower) by genetic ancestry. The TMPRSS2-ERG fusion was more prevalent among men with EA ancestry, although breakpoint site patterns were similar among men with EA and AA ancestry. (E) Copy number deletions and losses at 10q23.31 were more common among men with EA ancestry than with AA ancestry (upper). The lower prevalence of 10q23.31 loss for AA men is evident when viewing copy number alterations across the genome (middle). Greater focus on the PTEN locus indicates that PTEN loss is less common among men with AA ancestry (lower).
Fig 3
Fig 3. Differences in the prostate tumor transcriptome by genetic ancestry.
(A) Heatmap of expression of 220 genes differentially expressed between genetic ancestry groups with fold-change >2. Red denotes a gene more highly expressed in AA men, and blue more highly expressed in EA men. Genetic ancestry is shown using EIGENSTRAT classification (top) and STRUCTURE-estimated composition (bottom). (B) Circle plots showing (from inner to outer): 1) distribution of types of differentially expressed genes (DEGs); 2) fold-change in gene expression comparing AA to EA men in tumor tissue; 3) fold-change in gene expression comparing AA to EA men in tumor-adjacent normal tissue; 4) fold-change in gene expression comparing tumor to tumor-adjacent normal tissue; 5) fold-change in gene expression comparing AA to EA men for protein-coding genes evaluated in Wallace et al microarray dataset. (C) Enrichment in DEGs for genes regulated by eQTLs in normal prostate tissues (eGenes) and genes identified in prior GWAS or TWAS of CaP risk. The proportion of eGenes was higher among the DEGs than non-DEGs and increased with more stringent cutoffs in the FDR (upper plot). The prevalence odds of eGenes were higher among the DEGs, while the prevalence odds of GWAS and TWAS genes did not differ between DEGs and non-DEGs (lower plot). (D) Gene sets identified through gene set enrichment analysis that were significantly activated (upper plot; n = 18) and repressed (lower plot; n = 13) in tumors of AA men (FDR corrected p<0.1 through permutation test). Candidate gene sets were identified from the BioCarta pathway database and Wallace et al. Many gene sets pertaining to immune-related signaling were activated in AA tumors, while sets related to PTEN/PI3K were repressed in AA tumors. (E) Network plot of the 18 gene sets significantly activated in AA tumors. Nodes are grouped by gene set function. Node size is proportional to the number of genes in the gene set and node shading reflects the Normalized Enrichment Score (NES). An edge indicates there are shared genes between gene sets and edge shading reflects the number of shared genes. (F) Enrichment plots of the Wallace Prostate Cancer Race (Up), T Cytotoxic Cell Surface Molecules, Wallace Prostate Cancer Race (Down), and PTEN dependent cell cycle and apoptosis gene sets.
Fig 4
Fig 4. Comparison of the prostate tumor non-coding transcriptome by genetic ancestry.
(A) Proportions of DE-protein-coding and DE-non-coding genes. Red indicates statistically significantly higher expression in AA, while blue indicates lower expression in AA. Width of bars is proportional to the number of genes. (B) Classification of lncRNAs by genomic location relative to protein-coding genes (left). Circle plot of distribution of DE-lncRNAs by lncRNA genomic location (right). (C) Distributions of cytoplasmic-nuclear relative concentration index (CN-RCI) for DE-lncRNAs and non-DE-lncRNAs. DE-lncRNAs are more enriched in the nucleus (lower CN-RCI). (D) Odds ratios and 95% confidence intervals (95% CI) of differential expression by genetic ancestry of lncRNAs by chromatin state of the genomic region. Chromatin state is estimated by ChromHMM partitioning of the LNCaP cell. (E) Heatmap displaying enrichment for regulatory lncRNAs among non-DE-lncRNAs and DE-lncRNAs by regulatory mechanism (left). Odds ratios (95% CI) of differential expression by genetic ancestry of lncRNAs by regulatory mechanism (right). (F) Odds ratios (95% CIs) of enrichment with genes regulated by normal prostate tissue eQTLs (eGenes) for DE-genes overall, DE-protein-coding genes, and DE-lncRNAs. Odds ratios are displayed by FDR level of the differentially expressed gene. (G) Average signals of AR binding at transcription start sites (TSSs) of DE-lncRNAs (red) and non-DE-lncRNAs (gray) from AR ChIP-seq data from VCaP cell (left). Circle plot showing proportion of AR-regulated lncRNAs among DE-lncRNAs and non-DE-lncRNAs (right). AR regulation was inferred by analysis of DHT-stimulated transcriptome.
Fig 5
Fig 5. Characterization of the DE-lncRNAs PVT1, PCAT1, and PCAT10/CTBP1-AS in TCGA sample.
(A) Circle plot shows the percentage of 1,868 DE-lncRNAs that have been characterized based on related publications in PubMed (left). Red and gray indicate characterized and uncharacterized DE-lncRNAs, respectively. Characterized DE-lncRNAs are defined as the lncRNAs having at least one related publication. The characterized DE-lncRNAs were further ranked into three groups, with a darker shade of red indicating a greater number of related publications. Pie charts show the percentages of the characterized DE-lncRNAs with cancer-related (light blue) or CaP-related (dark blue) results among each group (right). (B) Crude and age- and Gleason score-adjusted expression levels of PVT1, PCAT1, and PCAT10 in AA and EA patients. (C) Expression levels of PVT1, PCAT1, and PCAT10 in prostate tumors and tumor-adjacent normal prostate tissues. (D) Percentile ranks of enrichment in AA men for PVT1, PCAT1, and PCAT10 across 33 TCGA cancer types. Color of bars reflects the fold change of expression (AA vs EA) ranks in a specific cancer type relative to others. High relative expression of PCAT1 and PCAT10 among AA men is specific to CaPs, while high relative expression of PVT1 occurs across cancer types. (E) AR binding signals at genomic loci surrounding or containing PCAT1 (left) and PCAT10 (right) from AR ChIP-seq analysis of two CaP cell lines (LNCaP, VCaP) treated with synthetic androgen agonists (R1881, DHT). (F) Expression levels of PVT1 and PCAT1 by copy number status (left). Number of men and frequency of SCNAs at 8q24.21 within categories of Gleason score and genetic ancestry (right).

References

    1. Siegel RL, Miller KD, Jemal A. Cancer statistics, 2019. CA Cancer J Clin. 2019;69(1):7–34. 10.3322/caac.21551 - DOI - PubMed
    1. Zeng C, Wen W, Morgans AK, Pao W, Shu XO, Zheng W. Disparities by Race, Age, and Sex in the Improvement of Survival for Major Cancers: Results From the National Cancer Institute Surveillance, Epidemiology, and End Results (SEER) Program in the United States, 1990 to 2010. JAMA Oncol. 2015;1(1):88–96. 10.1001/jamaoncol.2014.161 - DOI - PMC - PubMed
    1. DeSantis CE, Miller KD, Goding Sauer A, Jemal A, Siegel RL. Cancer statistics for African Americans, 2019. CA Cancer J Clin. 2019. 10.3322/caac.21555 - DOI - PubMed
    1. Bray F, Ferlay J, Soerjomataram I, Siegel RL, Torre LA, Jemal A. Global Cancer Statistics 2018: GLOBOCAN Estimates of Incidence and Mortality Worldwide for 36 Cancers in 185 Countries. CA Cancer J Clin. 2018. Epub 2018/09/13. 10.3322/caac.21492 - DOI - PubMed
    1. Rebbeck TR. Prostate Cancer Disparities by Race and Ethnicity: From Nucleotide to Neighborhood. Cold Spring Harb Perspect Med. 2018;8(9). 10.1101/cshperspect.a030387 - DOI - PMC - PubMed

Publication types

MeSH terms