. 2020 Feb 14;16(2):e1008365.
doi: 10.1371/journal.ppat.1008365. eCollection 2020 Feb.

B cells infected with Type 2 Epstein-Barr virus (EBV) have increased NFATc1/NFATc2 activity and enhanced lytic gene expression in comparison to Type 1 EBV infection

Affiliations

B cells infected with Type 2 Epstein-Barr virus (EBV) have increased NFATc1/NFATc2 activity and enhanced lytic gene expression in comparison to Type 1 EBV infection

James C Romero-Masters et al. PLoS Pathog. .

Abstract

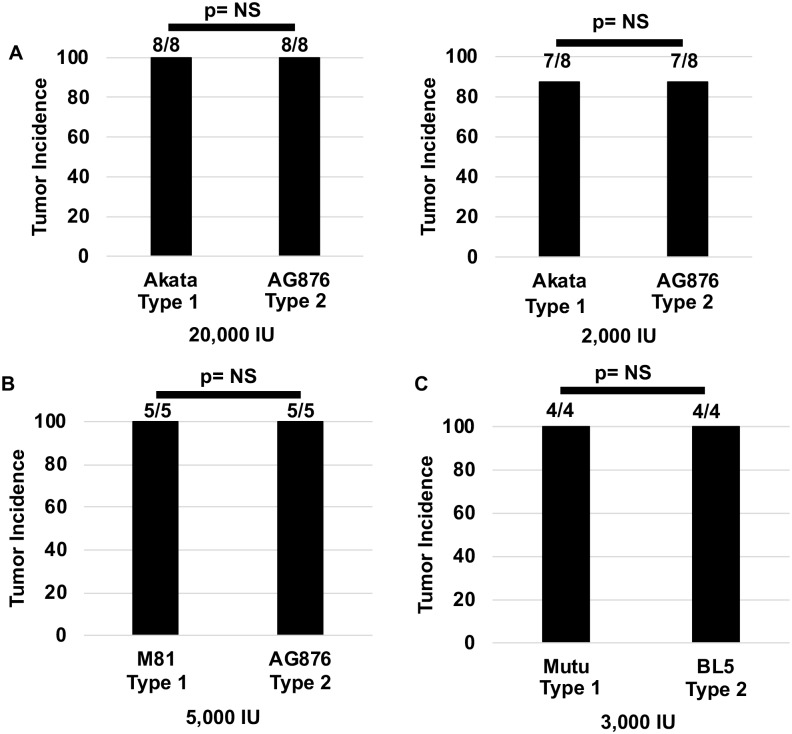
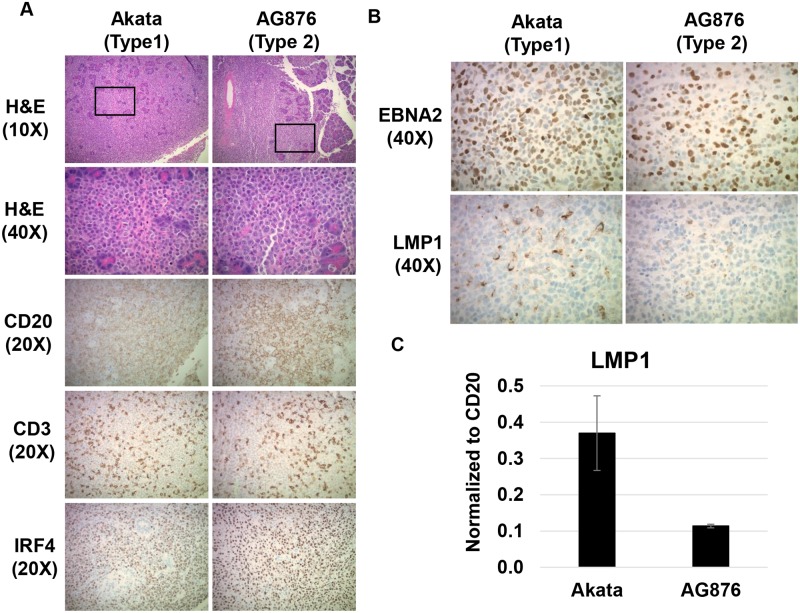
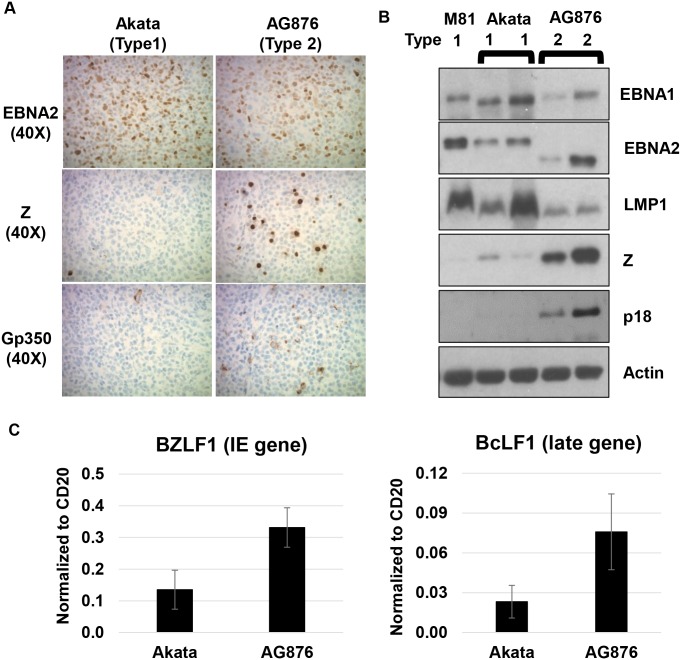
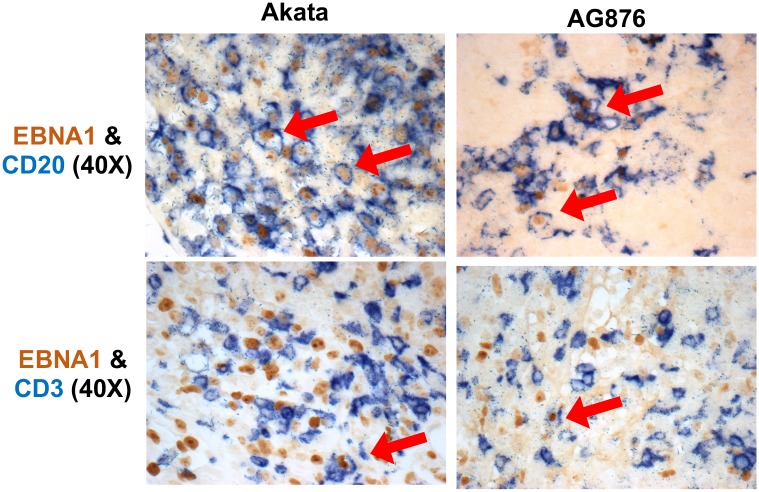
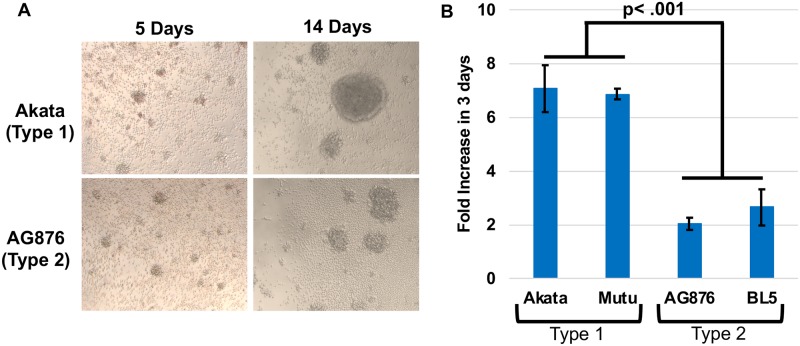
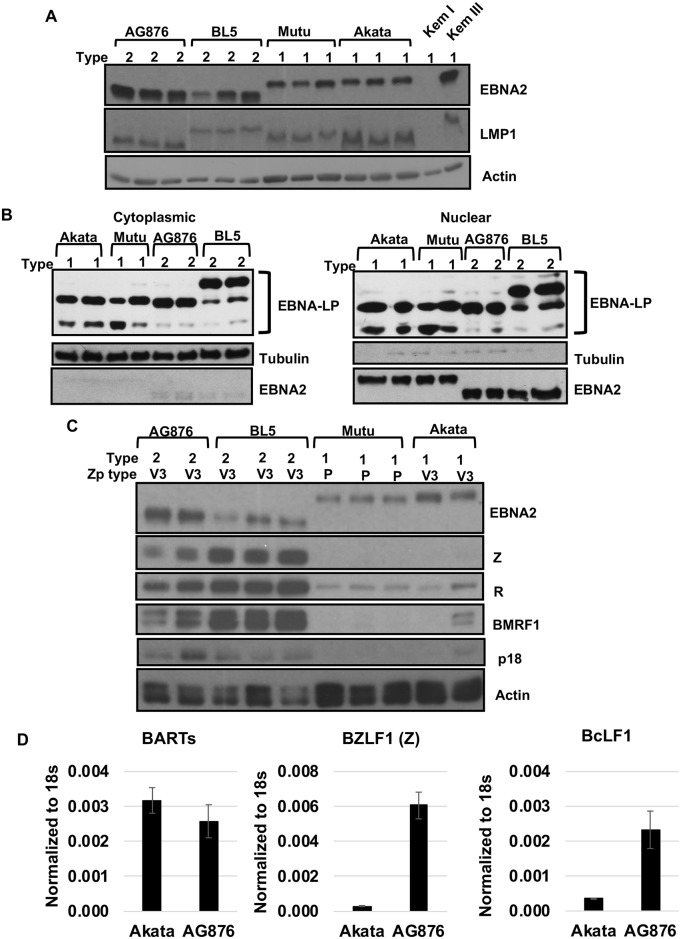
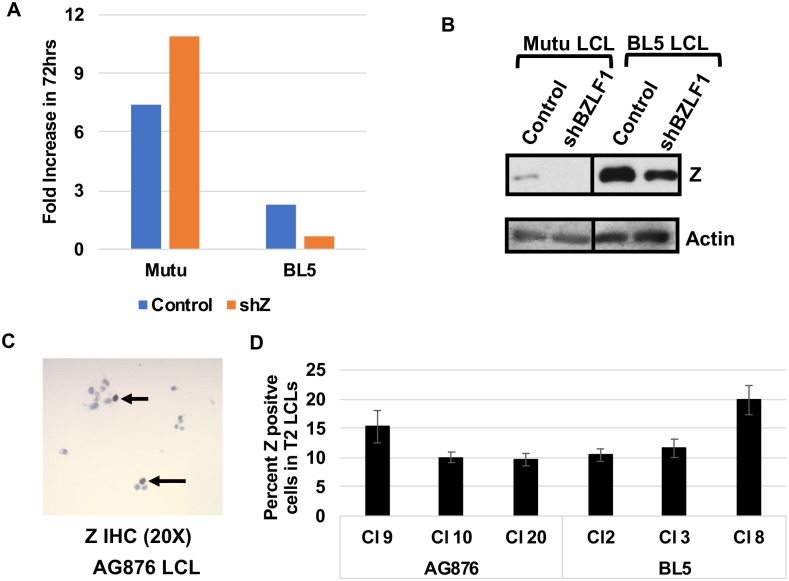
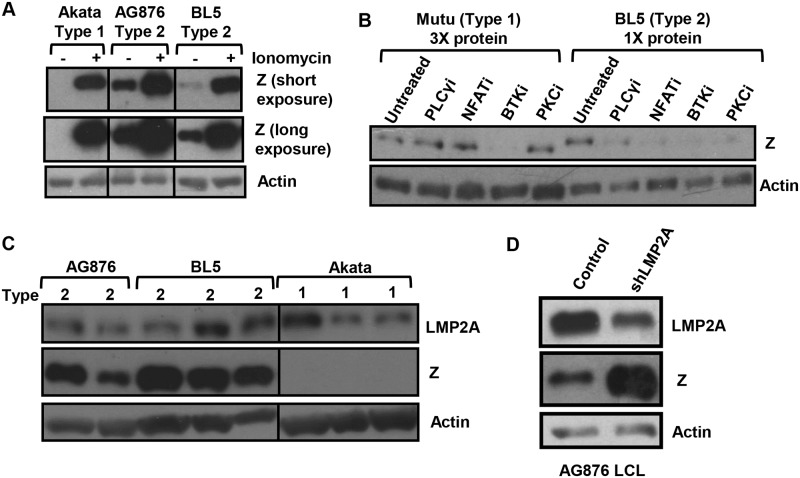
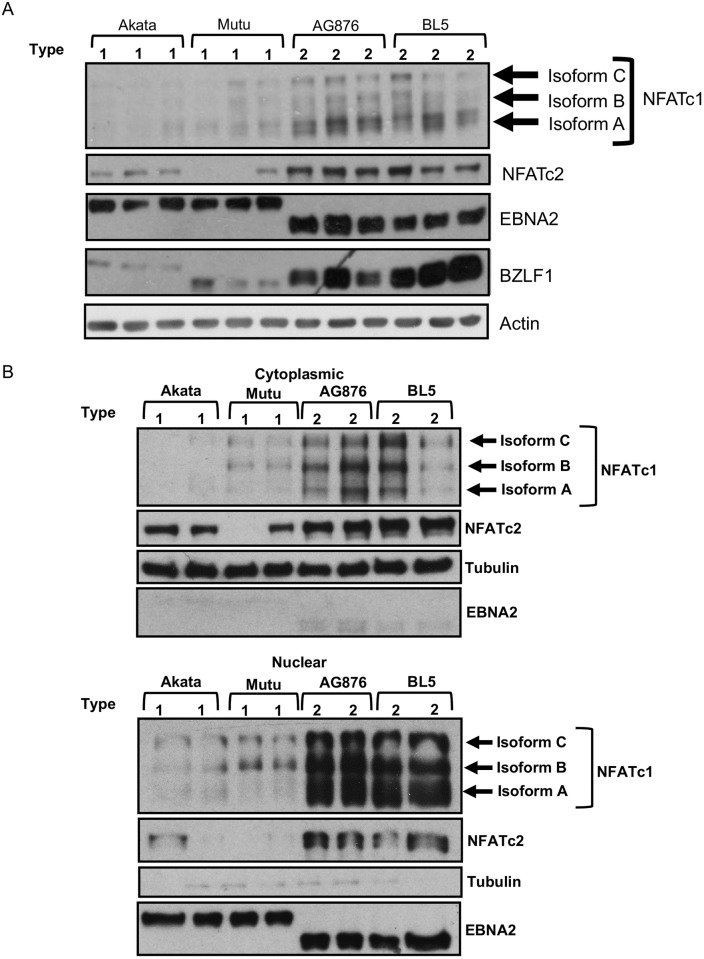
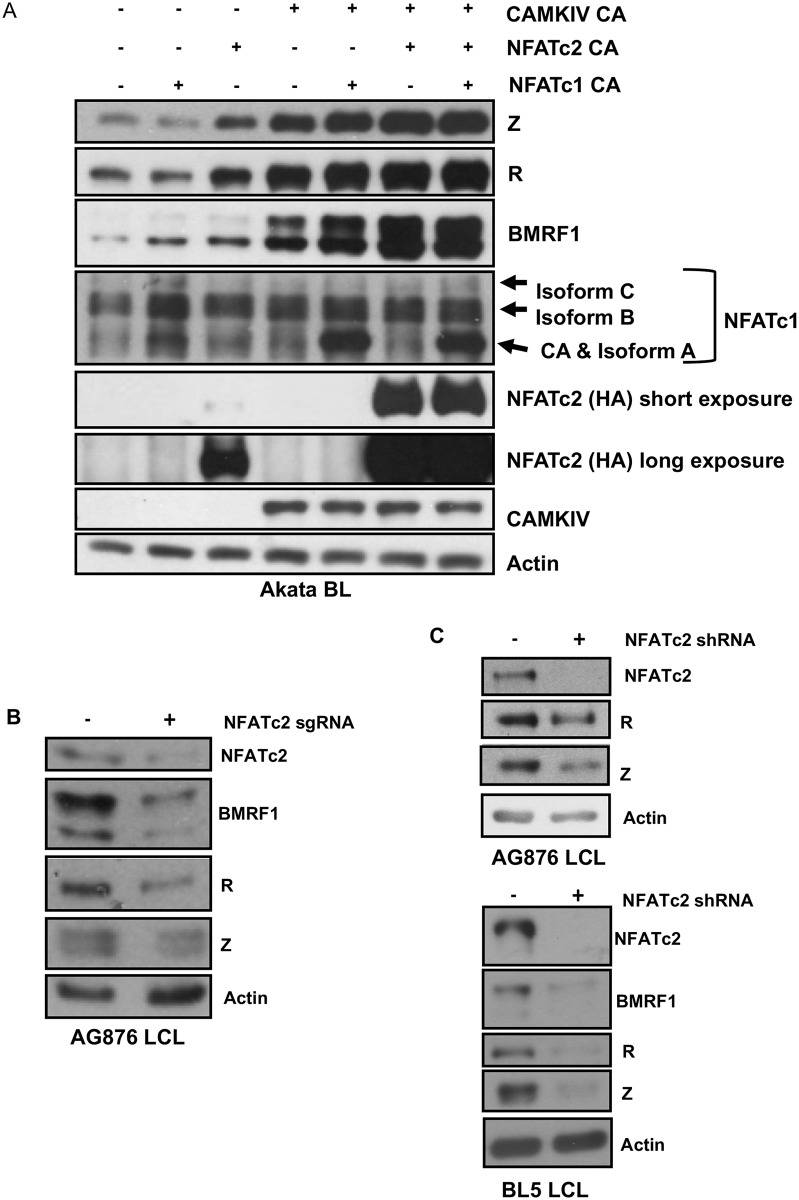
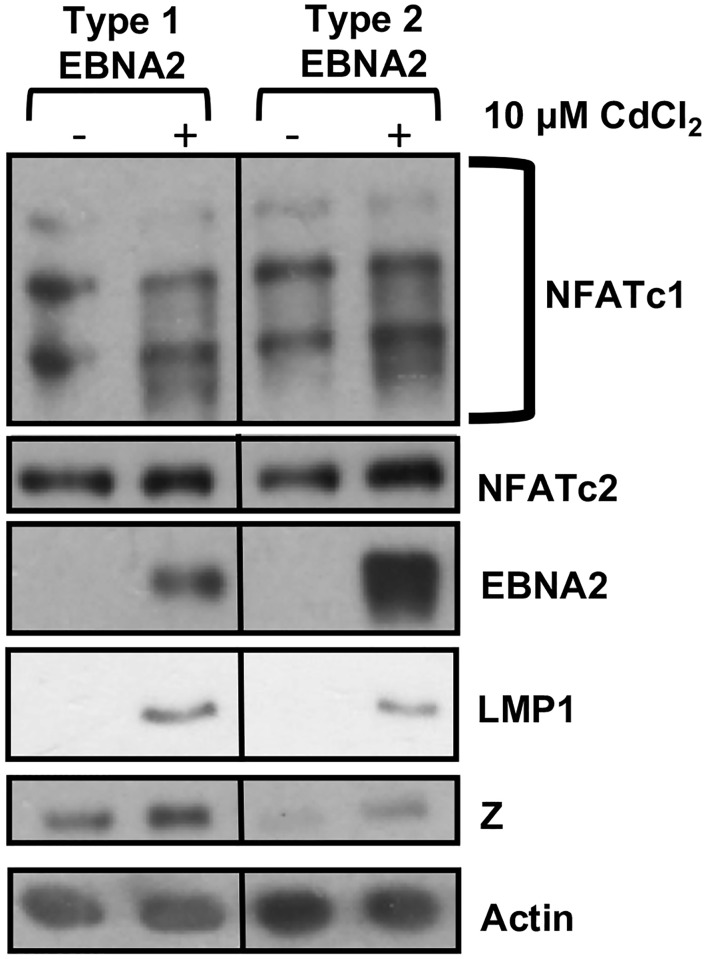
Humans are infected with two distinct strains (Type 1 (T1) and Type 2 (T2)) of Epstein-Barr virus (EBV) that differ substantially in their EBNA2 and EBNA 3A/B/C latency genes and the ability to transform B cells in vitro. While most T1 EBV strains contain the "prototype" form of the BZLF1 immediate-early promoter ("Zp-P"), all T2 strains contain the "Zp-V3" variant, which contains an NFAT binding motif and is activated much more strongly by B-cell receptor signalling. Whether B cells infected with T2 EBV are more lytic than cells infected with T1 EBV is unknown. Here we show that B cells infected with T2 EBV strains (AG876 and BL5) have much more lytic protein expression compared to B cells infected with T1 EBV strains (M81, Akata, and Mutu) in both a cord blood-humanized (CBH) mouse model and EBV-transformed lymphoblastoid cell lines (LCLs). Although T2 LCLs grow more slowly than T1 LCLs, both EBV types induce B-cell lymphomas in CBH mice. T1 EBV strains (M81 and Akata) containing Zp-V3 are less lytic than T2 EBV strains, suggesting that Zp-V3 is not sufficient to confer a lytic phenotype. Instead, we find that T2 LCLs express much higher levels of activated NFATc1 and NFATc2, and that cyclosporine (an NFAT inhibitor) and knockdown of NFATc2 attenuate constitutive lytic infection in T2 LCLs. Both NFATc1 and NFATc2 induce lytic EBV gene expression when combined with activated CAMKIV (which is activated by calcium signaling and activates MEF2D) in Burkitt Akata cells. Together, these results suggest that B cells infected with T2 EBV are more lytic due to increased activity of the cellular NFATc1/c2 transcription factors in addition to the universal presence of the Zp-V3 form of BZLF1 promoter.


Conflict of interest statement

The authors have declared that no competing interests exist.

Figures

Fig 1
Fig 1. T2 EBV infected CBH mice develop tumors at a similar frequency as T1 EBV infected mice.
A) The proportion of CBH mice that developed tumors after injection with 20,000 or 2,000 infectious units of either T1 Akata or T2 AG876 is shown. Two experiments were performed using both doses with two different donors. B) The proportion of CBH mice that developed tumors using 5,000 infectious units of T1 M81 or T2 AG876. C) The proportion of CBH mice developing tumors using 3,000 infectious units of T1 Mutu and T2 BL5 viruses. Fisher’s exact test was performed to determine if tumor frequency rates were significantly different between the different conditions.
Fig 2
Fig 2. T2 EBV induces activated DLBCLs that are in Type III latency but express less LMP1 than T1 EBV-induced lymphomas.
A) H&E staining was performed on T1 and T2 EBV-induced lymphomas, each invading the pancreas. IHC analysis was performed using antibodies against CD20 (B cell marker), CD3 (T cell marker) and IRF4 (maker of activated DLBCLs) as indicated. B) IHC analysis of T1- and T2-induced lymphomas using antibodies against EBNA2 (EBV latency protein) and LMP1 (EBV latency protein) as indicated. C) qPCR analysis of RNA isolated from T1 and T2 EBV-induced lymphomas using primers that recognize both T1 and T2 LMP1 genes; results were normalized to the level of the cellular B-cell specific CD20 transcript.
Fig 3
Fig 3. T2 EBV-infected lymphomas have elevated lytic infection compared to T1 EBV-infected lymphomas.
A) IHC analysis using antibodies against EBNA2 (EBV latency protein), BZLF1 (Z) (immediate-early lytic protein), and gp350 (late lytic protein) was performed as indicated. B) Immunoblot analysis of proteins isolated from T1 and T2 lymphomas was performed using antibodies against EBNA1 (EBV latency protein), EBNA2, LMP1 (EBV latency protein), Z, p18 VCA (late lytic protein), and actin. C) RNA isolated from T1 and T2 EBV-induced lymphomas was subjected to qPCR analysis using primers that recognize the immediate early lytic gene BZLF1 and late lytic gene BcLF1 from both T1 and T2 EBV; results were normalized to the level of the cellular B-cell specific CD20 transcript.
Fig 4
Fig 4. T2 EBV does not show elevated T cell infection in CBH mouse model.
IHC co-staining analysis was performed on T1 and T2 EBV-induced lymphomas using antibodies that recognize EBNA1 (EBV latency gene), CD20 (B cell marker) and CD3 (T cell marker) as indicated. Co-staining cells are indicated with the arrows. Only very rare CD3/EBNA1 co-staining cells were identified in lymphomas containing either T1 or T2 EBV.
Fig 5
Fig 5. T2 EBV-infected LCLs proliferate at a reduced rate compared to T1 EBV- infected LCLs.
A) Light microscopy images of T1 and T2 EBV-infected B cells at 5 days and 14 days post infection are shown. B) T1 and T2 EBV-infected LCLs were counted 3 days after diluting cells to 1x10^5 cells per mL. The fold increase in cell count was determined by comparing counts at 72 hrs to initial cell number using trypan blue staining. Experiments were performed using three different LCL clones and clones were counted in duplicate. Wilcoxon-Rank Sum Test was performed comparing Type 1 LCLs versus Type 2 LCLs. A p-value < .05 is considered significant.
Fig 6
Fig 6. T2 EBV-infected LCLs have increased lytic infection compared to T1 EBV-infected LCLs.
A) Immunoblot analysis of LCLs (from the same donor) derived from two different T1 strains (Akata and Mutu) and two different T2 strains (AG876 and BL5) was performed using antibodies against EBNA2 (EBV latency protein), LMP1 (EBV latency protein), and actin. Kem I and Kem III serve as negative and positive controls, respectively, for presence of EBNA2 and LMP1. B) Nuclear and cytoplasmic extracts from T1 and T2 EBV-infected LCLs were subjected to immunoblot analysis using antibodies against EBNA-LP, Tubulin (cytoplasmic fraction control), and EBNA2 (as a nuclear fraction control). C) Immunoblot analysis of LCLs using antibodies against EBNA2, Z (immediate-early lytic protein), BRLF1(R) (immediate-early lytic protein), BMRF1 (early lytic protein), p18 VCA (late lytic protein), and actin. D) RNA isolated from T1 (Akata) or T2 (AG876) EBV-infected LCLs was subjected to qPCR analysis using primers against 18S rRNA, BARTs (EBV miRNA transcript), BZLF1 (immediate-early lytic gene), and BcLF1 (late lytic gene). The primers for EBV genes recognize both T1 and T2 EBV; results were normalized to the level of the cellular 18S transcript.
Fig 7
Fig 7. Lytic infection in T2 EBV-infected LCLs does not reduce growth rate.
A) T1 EBV-infected (Mutu) or T2 EBV-infected (BL5) LCLs stably infected with control shRNA or shRNAs targeting Z were diluted to 1x10^5 cells and counted 72 hours later. The fold increase in cell number was determined by comparing cell counts at 72 hours to initial cell number. Experiment was performed in triplicate. B) Immunoblot analysis of BL5 LCLs or Mutu LCLs infected with either control shRNA or shRNA targeting Z using antibodies against Z and actin. C) IHC analysis of T2 LCLs was performed using antibody against Z. Arrows indicated Z staining cells. D) Quantification of the percent of EBV-infected cells in type 2 LCLs expressing Z as determined by IHC analysis. At least 10 fields of view were quantified across 3 independently derived Type 2 LCL clones infected with either the AG876 or BL5 viruses.
Fig 8
Fig 8. T2 EBV lytic infection depends upon NFAT, PLCγ, BTK, and PKC activity.
A) T1 and T2 EBV-infected LCLs were treated with ionomycin for 48 hours and immunoblot analysis performed using antibodies that detect EBV Z protein or cellular actin as indicated. B) T1 and T2 LCLs were treated with inhibitors that target various components of the BCR pathway, including the PLCγ inhibitor, U73133, the NFAT inhibitor, cyclosporin A, the BTK inhibitor, Ibrutinib, and the PKC inhibitor, PKC412. Extracts were harvested 48 hours and immunoblot analysis was performed using antibodies against the EBV Z protein and actin as indicated. Note that three times more protein is loaded in the T1 Mutu lanes to normalize for differences in the level of constitutive Z expression. C). Immunoblot analysis was performed on whole cell lysates from T1 and T2 EBV-infected LCLs using antibodies against LMP2A (an EBV latency protein), Z, and actin as indicated. D) AG876 T2 EBV-infected LCLs were stably transduced with lentiviruses expressing control or LMP2A targeted shRNAs and cell lines were generated. Immunoblot analysis was performed using antibodies against LMP2A (latency gene), Z, and actin as indicated.
Fig 9
Fig 9. T2 EBV-infected LCLs have elevated total and activated (nuclear) NFATc1 and NFATc2 compared to T1 EBV-infected LCLs.
A) Whole cell extracts from T1 and T2 EBV-infected LCLs were subjected to immunoblot analysis using antibodies against NFATc1, NFATc2, EBNA2, Z, and actin. B) Cellular fractionation was performed on T1 and T2 LCLs and fractionation samples were subjected to immunoblot analysis. Upper) Immunoblot analysis performed on cytoplasmic fraction using antibodies against NFATc1, NFATc2, EBNA2 (nuclear fraction control), and Tubulin (cytoplasmic fraction control). Lower) Immunoblot analysis performed on nuclear fraction using antibodies against NFATc1, NFATc2, EBNA2 (nuclear fraction control), and Tubulin (cytoplasmic fraction control).
Fig 10
Fig 10. Calcium levels in T2 EBV-infected LCLs are similar to T1 EBV-infected LCLs.
Using a fluorescent dye that increases in intensity with elevations in cellular calcium concentration, T1 and T2 LCLs were stained with the dye as described in the methods. A) Quantitative imaging analysis was performed using FIJI/ImageJ software and fluorescent intensity was normalized to the intensity of a nuclear control dye (NucBlue) as indicated. B) Representative fluorescent images for each of the different LCLs generated are shown for Calcium and NucBlue.
Fig 11
Fig 11. NFATc1 and NFATc2 collaboratively increase lytic infection in the presence of CAMKIV in Akata Burkitt lymphoma cells.
A) Akata BL cells were nucleofected with plasmids containing constitutively active NFATc1, NFATc2, and CAMKIV either alone or in combination as indicated. Cell extracts were subjected to immunoblot analysis 48 hours later using antibodies against BZLF1, BMRF1, NFATc1, HA (which recognizes tagged NFATc2), CAMKIV, and actin. B) AG876 LCLs were transfected with an NFATc2 directed sgRNA/Cas9 complex as indicated. Transfected cells were subjected to immunoblot analysis using antibodies against NFATc2, BMRF1, Z, R, and actin as indicated. C) AG876 and BL5 type 2 LCLs were stably infected with a lentivirus containing a shRNA against NFATc2, selected in puromycin for 5 days, then subjected to immunoblot analysis using antibodies against NFATc2, R, Z, BMRF1 and actin.
Fig 12
Fig 12. T1 and T2 EBNA2 expression have similar effects on NFATc1/NFATc2 expression in P3HR1 Burkitt lymphoma cells.
P3HR1 cells containing either T1 or T2 pHEBo-MT-EBNA2 constructs were treated with or without 10 μM CdCl2 for 48 hours to induce EBNA2 expression. Immunoblot analysis was performed on whole cell extracts using antibodies against NFATc1, NFATc2, EBNA2, LMP1, Z, and actin.

References

    1. Kieff E, Cohen JI, Longnecker R. Epstein-Barr Virus/Replication and Epstein-Barr Virus 6th ed In: Knipe DM, Howley PM, editors. Fields Virology. 6th ed. Philadelphia, PA: Lippincott Williams & Wilkins; 2013. pp. 1898–1959.
    1. Giulino L, Mathew S, Ballon G, Chadburn A, Barouk S, Antonicelli G, et al. A20 (TNFAIP3) genetic alterations in EBV-associated AIDS-related lymphoma. Blood. 2011;117: 4852–4854. 10.1182/blood-2010-10-310995 - DOI - PMC - PubMed
    1. Cesarman E. Pathology of lymphoma in HIV. Curr Opin Oncol. 2013;25: 487–494. 10.1097/01.cco.0000432525.70099.a4 - DOI - PMC - PubMed
    1. Ma S-D, Hegde S, Young KH, Sullivan R, Rajesh D, Zhou Y, et al. A New Model of Epstein-Barr Virus Infection Reveals an Important Role for Early Lytic Viral Protein Expression in the Development of Lymphomas. J Virol. 2011;85: 165–177. 10.1128/JVI.01512-10 - DOI - PMC - PubMed
    1. Ma S-D, Xu X, Plowshay J, Ranheim EA, Burlingham WJ, Jensen JL, et al. LMP1-deficient Epstein-Barr virus mutant requires T cells for lymphomagenesis. J Clin Invest. 2015;125: 304–315. 10.1172/JCI76357 - DOI - PMC - PubMed

Publication types

MeSH terms